Debt Dilemma: Addressing America’s mounting fiscal pressures

Fiscal pressures are mounting in the United States as past debt accumulation is being compounded by higher interest rates and a large deficit reflecting a fundamental mismatch between government spending and revenues, as described in the latest OECD Economic Survey of the United States.

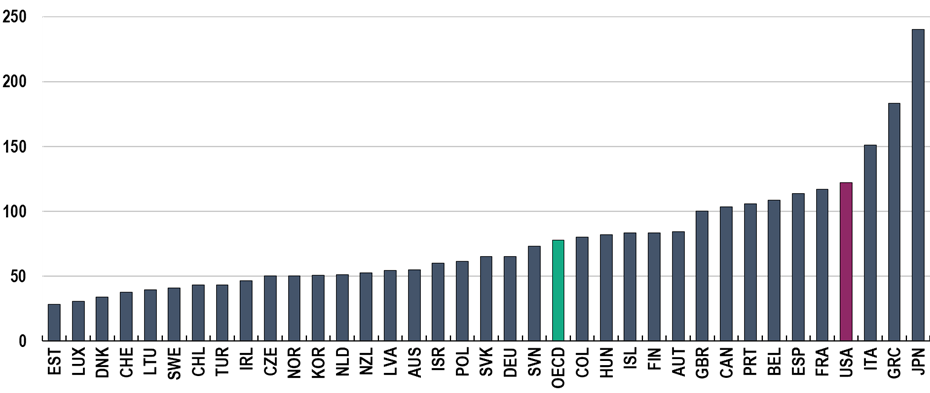
The general government fiscal deficit was 8% in 2023. The debt to GDP ratio is one of the highest in the OECD, after doubling over the past two decades (Figure 1) and reaching the highest level since the aftermath of World War 2.

Figure 1: The government debt to GDP ratio is high compared with other OECD countries

Gross public debt, % of GDP, 2023 or latest year available

Source: OECD Analytical Database.

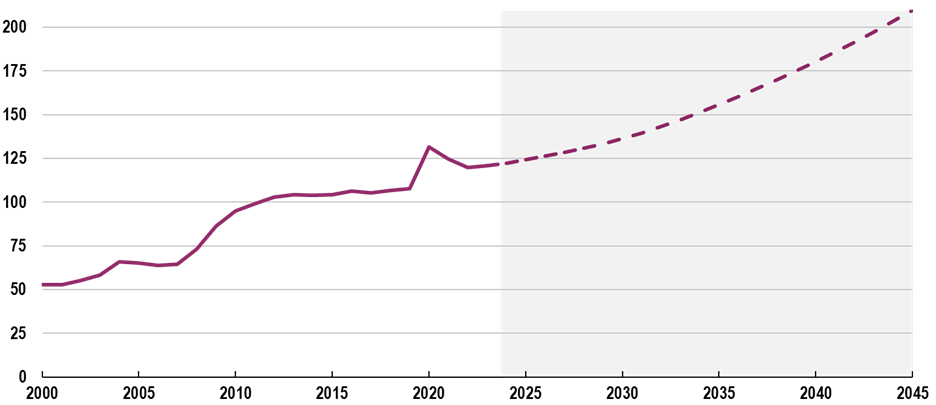
Under current tax and spending policy, the debt ratio will continue to rise sharply to around 150% of GDP in the mid-2030s as spending continues to run ahead of revenues and with rising pension and healthcare costs.  At the same time, the government is facing public spending pressures arising from the climate transition, public investment needs and geopolitical tensions (Figure 2).

Figure 2: If current tax and spending policies persist, the United States debt ratio is projected to increase rapidly over coming decades

Projected gross public debt, % of GDP

Note: Projections assume that current tax and spending policies persist, including the policies enacted in the Tax Cuts and Jobs Act (TCJA). The projections begin with an initial primary deficit of 3% of GDP and include additional future fiscal costs due to ageing and higher interest costs. GDP growth evolves according to projections from the OECD Long Term Model.
Source: OECD calculations

Why is rising public debt in the United States a problem? High debt and deficits can slow economic growth and increase risks to the US economy. Debt issuance puts upward pressure on interest rates and may in turn crowd out private investment. A larger debt and deficit may make it harder to finance urgent spending, impacting the ability of the authorities to respond to future crises. Upward pressure in interest rates in the United States often exerts similar pressure elsewhere, potentially slowing growth across the globe.

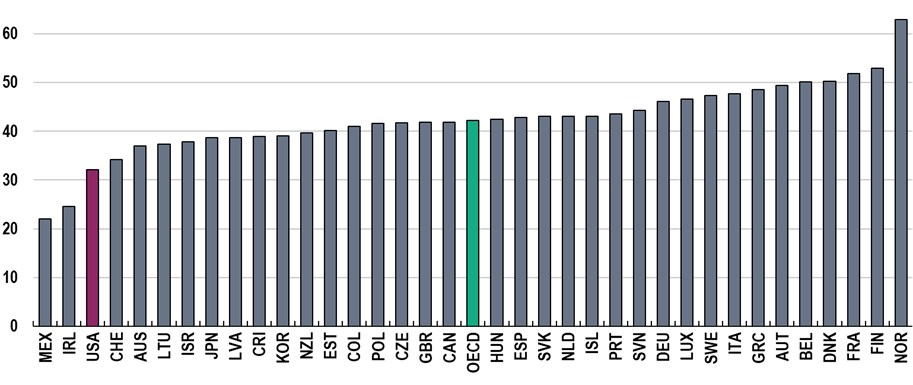
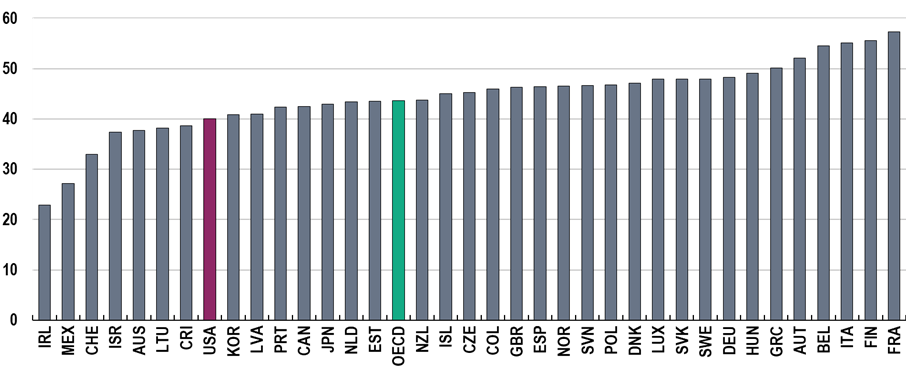
A more prudent path for United States public finances will involve better aligning revenues and expenditures. Tax revenues are low in the United States compared with other OECD countries, while there is limited room for cuts to federal spending given that most is dedicated to important social programs such as the provision of retirement and health services, as well as net interest payments (Figure 3).

Figure 3. Government revenues and expenditures are low relative to other OECD countries

General government total revenue, % of GDP, 2023

General government total expenditure, % of GDP, 2023

Source: OECD Analytical Database

A multi-year fiscal adjustment that includes increases in taxation, particularly on capital incomes, and spending adjustments focused on savings on pensions and healthcare can put debt on a more prudent path.

Changes to corporate tax, personal tax, and estate tax are key instruments and could be phased in earlier in the adjustment. The scheduled expiration of many tax code changes under the Tax Cuts and Jobs Act (TCJA) at the end of the 2025 calendar year provides an opportunity to revisit the tax code prior to that date. Post-tax income inequality in the United States is high by OECD standards, and the proposed tax reforms would make the system less regressive, as well as raise revenues. On the expenditure side, spending restraint should be the immediate priority, while longer term reforms are put in place to lower health care costs while maintaining care.

Improving the federal budgeting process would support putting the public finances on a more prudent path. Currently, the US Congress sets a federal debt ceiling that caps the amount of debt on issuance. However, this debt ceiling is divorced from the budgetary process and has led to brinksmanship, creating unnecessary risks. It should be replaced with a simple debt ratio target focused on the medium term proposed by the President and approved by Congress to improve communication and accountability.

Reference

OECD (2024), OECD Economic Surveys: United States 2024, OECD Publishing, Paris, https://doi.org/10.1787/cdfff156-en.


United States: Challenges Faced by the Middle Class

By Álvaro Leandro, OECD Economics Department

According to Aristotle, “The most perfect political community is one in which the middle class is in control, and outnumbers both of the other classes”. Almost 2400 years later, policymakers around the world still believe that a strong and prosperous middle class is the key to economic and political stability. In fact, many studies show that countries with a strong middle class tend to enjoy higher levels of wellbeing and trust in institutions, and better governance.

It is therefore no surprise that the struggles of the United States middle class and its shrinking size have been front and centre of the economic policy discussions in the country. Indeed, as shown in the 2022 OECD Economic Survey of the United States, low intergenerational mobility and rising income inequality have been accompanied by a rise in the polarisation of the United States income distribution, or a “hollowing out” of the middle class. Whereas more than 60% of US households earned between 66 and 200% of the median income in the 1970s (a common definition of the middle class), this proportion shrank to 50% by 2020. Taking a narrower definition, the proportion of households earning between 75 and 150% of median income shrank from 43% in 1970 to 33% in 2020.

Figure 1. The US middle class has been shrinking

Source: Annual Social and Economic Supplement of the Current Population Survey

Those remaining middle class households have faced stagnating incomes and rising costs of important goods and services. According to the Congressional Budget Office, growth in incomes of the US middle class has lagged those of higher- and lower-income households during the past decades after accounting for taxes and transfers. From 1979 to 2018, the average income after taxes and transfers rose by 53% for the middle three quintiles of the income distribution, while it rose 91% and 120% for the lowest and highest quintiles, respectively.

Figure 2. The middle class has faced stagnating incomes and rising costs

Source: Bureau of Labour Statistics

Improving access to affordable and high-quality child care

While the high costs of health care, higher education and housing in the United States have received much attention, reported child care costs are also very high by international comparison, and have risen significantly in recent years. Additionally, financial aid for child care is very limited, with only a fraction of eligible households receiving public aid despite it being targeted towards the poorest households.

Both poor and middle-class families with young children spend significant amounts of their disposable income on child care, which has led the Biden administration to propose a programme that would cap household spending on child care to 7% of income. Such a programme would require significantly increasing public child care funding, which is very low in the United States compared to other OECD countries. Doing so would bring multigenerational benefits: for children, attending high quality early childhood education contributes to better outcomes later in life in terms of educational attainment, employment, health, earnings and wellbeing, with larger effects for children from disadvantaged socioeconomic backgrounds; for parents, easy access to affordable child care can boost lifelong earnings by increasing labour market participation and human capital accumulation.

Supporting lower- and middle-income households through the climate transition

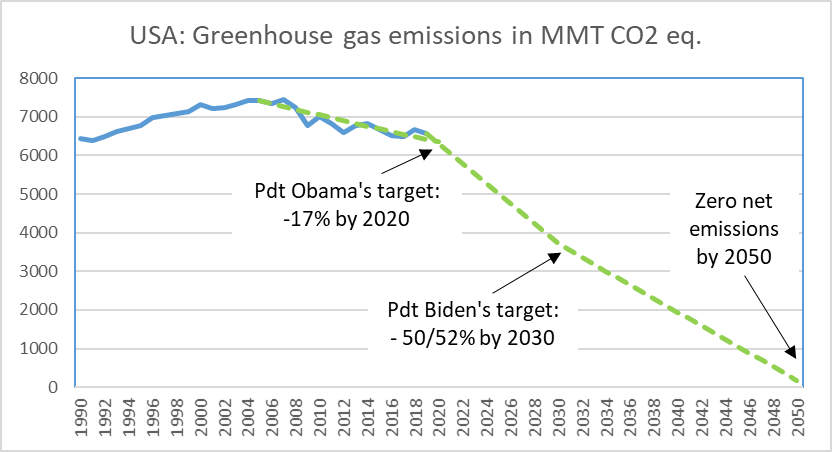
The administration has announced ambitious policy targets for reducing greenhouse gas emissions. The 2030 Nationally Determined Contribution is to reduce greenhouse gas emissions by 50-52% below 2005 levels. In addition, the United States has committed to a goal of achieving net zero greenhouse gas emissions by 2050.

These targets imply that carbon cuts need to accelerate significantly, a considerable endeavour that will have large macroeconomic and redistributive consequences. The pace of the transition towards net zero emissions and the ambition of the policies required to achieve it will inevitably have important economic implications for the middle class. The transition entails a large reallocation of jobs and capital from high-carbon to low-carbon activities, which has already started to occur. Housing and transportation, which account for a large part of US greenhouse gas emissions, will have to rapidly decarbonise. Improving the energy efficiency of their housing and transportation will entail significant costs for lower- and middle-income households.

The Inflation Reduction Act passed in August this year is a major achievement. It includes significant investments and tax credits to improve the US energy system, which are estimated to significantly contribute to reducing net greenhouse gas emissions, while means-tested consumer tax credits and rebates will reduce the burden on lower- and middle-income households. However, more action across all levels of government will be needed to achieve the climate pledges of the United States. For example, state and local governments will have to adopt updated building energy codes and plan and execute renewable energy projects. In achieving the transition in the residential sector, middle income households should be further assisted to invest in greater home energy efficiency, possibly by further expanding home weatherisation and retro-fitting programmes. Well-designed policies in this area and in child care can support the re-emergence of a thriving middle class.

References:

OECD (2022), OECD Economic Surveys: United States 2022, OECD Publishing, Paris, https://doi.org/10.1787/eeb7cbe9-en.


President Biden pledges an ambitious climate strategy

By Patrick Lenain, OECD Economics Department

Ten years ago, the OECD published an in-depth analysis of U.S. greenhouse gas emissions (GHG) and urged the country to reverse gears (Carey, 2010). The analysis welcomed President Obama’s pledge in Copenhagen to cut the country’s emissions by 17% in 2020 from 2005 levels, but found that this would require new policy measures. As we approach the new climate summit in Glasgow (COP26), the United States can display progress: according to the latest data released by the Environment Protection Agency, GHG emissions have declined and President Obama’s target is within reach (Figure 1). President Biden has now pledged further progress with a target to cut GHG emissions by at least half in 2030 and achieve zero net emissions no later than 2050. These targets will imply to bend the curve and accelerate the pace of emission cuts.

Figure 1: A faster pace of emission reductions is required

Note: When published, 2020 data will show a sharp decline of emissions caused by the COVID19 recession, but emissions are likely to rebound in 2021 with the recovery of activity.
Source: Environmental Protection Agency.

The United States has already achieved a welcome reduction in GHG emissions. At first glance, this seems surprising after policy changes made during the Trump Administration such as the repeal of the Clean Air Act, subsidies favouring fossil fuels, and curbs on state-level regulatory standards. The reasons for this progress is that a lot has happened in the energy market, at the subnational level, and with tax credits:

  • Electricity production has been gradually decarbonised thanks to the decline of coal, the rise of natural gas, and the emergence of renewable energy sources such as wind turbines and photovoltaic panels (Figure 2), which have been encouraged by subsidies and regulation. 
  • Cap-and-trade carbon markets have encouraged this energy transformation at the regional level. The Regional Greenhouse Gas Initiative (RGGI) is an agreement between nine states that aim at curbing CO2 emissions in the electric power sector. RGGI helped to reduce emissions in 2020 by 47% relative to 2005 in these states. California and Quebec have also joined forces and maintain a multi-sector cap-and-trade market.
  • Several tax credits already encourage households, firms, and utilities to use clean energy and improve their energy efficiency: an investment tax credit partially pays for the cost of installing photovoltaic solar panels; a plug-in electric vehicle tax credit helps buyers of new electric vehicles; a producer tax credit subsidizes the use of renewable energy sources.
  • Many other policy interventions seek to curb emissions at the federal level (e.g. financial support to research in renewable energy), state level (e.g. California’s vehicle emission rules) and city level (e.g. Seattle’s ban of combustion engine cars by 2030). In addition, many U.S. firms have made net zero emission pledges, and financial institutions have plans to withdraw funding to the fossil fuel industry.

Figure 2: Coal is no longer favoured in electricity production

Source: OurWorldinData based on BP and Ember.

Despite past progress, much remains to be done in the United States, like in many other countries, to limit the rise in global temperature. The United States still emits the largest amounts of GHG and CO2 per capita among G20 countries, together with Australia and Canada. The effective pricing of energy-related carbon emissions in the United States is among the lowest in G20 and OECD countries: only 22% of these emissions are priced at €60 per ton of CO2 or more, the level considered as the minimum to reach the Paris climate targets (OECD, 2021a).

High energy prices are often favoured in terms of cost efficiency, but they would have a regressive impact on income distribution and are politically challenging. President Biden has therefore announced alternative measures to lower GHG emissions:

  • Tax credits will be further increased to decarbonise electricity production and encourage energy efficiency. Such tax credits can act like carbon taxes because they reduce the cost of renewable energy relative to fossil fuels. However, their impact is limited to specific sectors, unlike economy-wide carbon taxes, and their fiscal impact is negative because they reduce government tax revenue.
  • The purchase of plug-in electric cars will be encouraged by tax credits and public investment in battery recharging stations. Ownership of electric vehicles in the United States is one of the lowest in the OECD and G20 and the Administration plans to catch up with other countries.
  • More public investment will help the green transition. Investment will strengthen the nation’s electricity grid, and financial support will target the energy efficiency of buildings.

President Biden’s plans are a big step forward toward a low carbon future. The measures will help to decarbonise electricity generation and transportation, but questions remain about other large emitting sectors, especially industry and agriculture (Figure 3).

Figure 3: Transportation and electricity sectors are large GHG emitters, 2019

Source: Environmental Protection Agency.

References:

Carey, D. (2010), “Implementing Cost-Effective Policies in the United States to Mitigate Climate Change”, OECD Economics Department Working Papers, No. 807, OECD Publishing, Paris, https://doi.org/10.1787/5km5zrs4kc6l-en.

OECD (2021a), Effective Carbon Rates, Pricing Carbon Emissions through Taxes and Emissions Trading.

OECD (2021b, forthcoming), Assessing the economic impacts of environmental policies – Evidence from a decade of OECD research, OECD Publishing.


American Rescue Plan: A first package of President Biden’s transformative reforms

By Patrick Lenain, Carl Romer and Ben Westmore

The American Rescue Plan (ARP) submitted by President Biden and approved by U.S. Congress in mid-March provides US$1.84 trillion (8.4% of GDP) of fiscal support to the economy — a very large stimulus by international standards. Soon after the plan’s approval, the OECD Interim Economic Outlook presented a significant upward revision to the U.S. economic growth forecast, doubling it for 2021 from 3.2% to 6.5%. The fiscal package will boost domestic demand and help activity return more quickly to pre-pandemic levels (Figure 1), with many unemployed workers getting back jobs. Furthermore, OECD modelling highlights that the package may have noteworthy demand spillovers for the major trading partners of the U.S. (for further details, see The American Rescue Plan is set to boost global growth).

Figure 1: U.S. GDP projections
(trillion of US dollars, constant prices)

Source: OECD Economic Outlook projections.

While concerns have been raised that such a large fiscal stimulus could cause a significant future inflation shock, the transformative content of the measures in the package should not be overlooked. As recommended by successive OECD Economic Surveys of the United States, the ARP seeks to address persistent structural challenges that have prevented many Americans from realising their human potential. The Plan will help struggling subnational governments, support unemployed workers, facilitate the reopening of schools, close gaps in unemployment insurance, and reduce child poverty. Besides sending checks of $1400 to eligible families (budget cost of US$412 billion), the Plan contains other important provisions (Figure 2).    

Figure 2 – American Rescue Plan’s main provisions*

Source: Authors’ compilation from various sources.*
Estimates based on available information and subject to changes.

  • Support to subnational governments (US$350 billion). The ARP allocates financial support to States, territories and tribes. States that depend on tourism and sales taxes like Hawaii, Nevada, Florida, Texas have faced steeper budget shortfalls, whereas other states like Idaho and Utah saw large revenue increases owing to strong federal expenditures and relatively short COVID-19 lockdowns. As argued in past OECD work, subnational governments play key social and economic roles, but existing fiscal rules can impose damaging spending cuts during recessions.
  • Unemployment relief (US$246 billion). The Plan provides Federal funding to supplement state-level unemployment insurance benefits with an additional $300 per week – less than the supplement of $600 per week in the CARES Act but nonetheless important, as these benefits would otherwise have fallen back to low pre-crisis levels. By supporting unemployment insurance, the ARP will help to keep unemployed workers active in the labour market, rather than becoming discouraged from job search, as seen in past recessions.
  • Support to schools and higher education (US$170 billion). Manyschools had to close during shutdown orders, with detrimental impacts on vulnerable families and the risk of large numbers of dropouts. K-12 Schools will be given US$125 billion in direct aid with another US$40 billion for colleges and universities to reopen in safe conditions. Reducing gaps in educational outcomes, as measured by PISA, has been a recurring OECD policy recommendation.
  • Child benefits and affordable childcare (US$156 billion). A persistent challenge for families has been the absence of affordable childcare, which has depressed the labor-market participation of American women. Also, the lack of affordable early-childhood education, which is decisive in children’s school performance, has created large inequalities. The ARP provides emergency funding for child-care assistance to essential workers unable to telework, typically people in low-income deciles. The Plan also helps 16 million poor and rural K-12 students without access to high-speed internet. The Child Tax Credit and Earned Income Tax Credit will receive a much-needed boost: the Urban Institute projects that this will cut child poverty in half.
  • Health insurance coverage, vaccines and COVID-19 containment (US$125 billion). PastOECD work has recommended closing existing gaps in healthcare insurance, working towards universal coverage through a system of multiple insurance providers. For employees laid off or who otherwise lost their health insurance, ARP provides US$57 billion in funding for employers to retain COBRA coverage for departing employees and a temporary expansion in subsidies that could be used to pay for health coverage through the Affordable Care Act public exchange system. In addition, ARP increases marketplace premium subsidies for people at every income level and will now be offered to those with income above 4 times the federal poverty level.

While these measures are temporary, the OECD has recommended permanent reforms to alleviate child poverty, improve K-12 education, close gaps in health insurance, and strengthen local communities – all with a beneficial impact on long-term economic growth and well-being. Other reforms recommended by the OECD include wider access to high-speed internet; investment in green technologies; and strengthening anti-trust actions to protect consumers against oligopolies’ market dominance.

President Biden has now turned his attention to implementing new policies to boost investment, which could have a fiscal cost of at least US$3 trillion spread across several years. Notwithstanding the risk of political gridlock, this provides the opportunity to further address long standing challenges, including those reform priorities previously identified by the OECD in the areas of infrastructure, green technologies and education.

References

OECD (2021), “The need for speed: Putting the World Economy on the Fast Track out of the COVID-19 crisis”, ECOSCOPE blog, 17 March.

OECD (2020), Economic Survey of the United States, OECD Publishing, https://doi.org/10.1787/12323be9-en

Azzopardi, D., F. Fareed, M. Hermansen, P. Lenain and D. Sutherland (2020), “The decline in labour mobility in the United States: Insights from new administrative data

Azzopardi, D., F. Fareed, M. Hermansen, P. Lenain and D. Sutherland (2020), “Why are some U.S. cities successful, while others are not? Empirical evidence from machine learning”, OECD Economics Department Working Paper No. 1643.


President Biden’s policy priorities and their impact on the economic outlook

By Miguel R. Gorman, OECD Washington Center, Patrick Lenain, OECD Economics Department, Carl Romer, Brookings Institution, and Ben Westmore, OECD Economics Department

The inauguration of President Biden on January 20 in Washington, D.C, marked the launch of an ambitious policy agenda for the four-year mandate. As he made clear during his inaugural address, President Biden has broad policy priorities in terms of health, jobs, income, climate and equity. If approved by Congress and fully implemented by his administration, these policies will boost the economic recovery in the short term and, in the medium term, will improve the wellbeing of Americans.

US economic situation in early 2021

The US economy has rebounded quickly since the second quarter of 2020, when workers in many states were ordered to stay at home and many businesses were ordered to shut their doors. GDP is now expected by the consensus of economists to have contracted by only 2.5% in 2020 (Q4 over Q4), a much less severe fall than feared initially. After jumping to 13% in May, the unemployment rate quickly dropped below 7% by the end of the year. Boosted by the large fiscal stimulus and monetary support, consumer demand has revived, putting the economy on a pathway toward recovery.

However, these average numbers do not tell the whole story: the pandemic has not impacted all Americans equally. While high-wage workers experienced the recession during only a few weeks and are now in near-normal employment conditions, others have been hit by job losses and are facing weak demand for their labour (Figure 1). Low-wage workers are still unemployed in sectors operating well below capacity such as hospitality, travel, tourism and entertainment. For them, unemployment benefits are essential to make ends meet.

Source: Chetty et al (2020), Opportunity Insights. Change in employment rates (not seasonally adjusted), indexed to January 4-31, 2020. This series is based on payroll data from Paychex and Intuit, worker-level data on employment and earnings from Earnin, and timesheet data from Kronos. The dotted line in the low-wage series is a prediction of employment rates based on Kronos data.

Combatting COVID-19

The COVID-19 pandemic has further increased the existing gaps in income and wealth separating those living in poverty from the well-offs. Job losses have also been disproportionately concentrated in Black and Latino communities, with women particularly hard hit. The pandemic has also highlighted the inadequacies of the health system, where many remain uninsured and even more are under-insured and unable to obtain adequate healthcare when needed.

With COVID-19 contagions and deaths still at record levels (Figure 2), a key priority of the Biden-Harris Administration will be to reduce the spread of the virus and high death tolls. Investment in contact tracing capacity will likely be increased via the US Public Health Jobs Corps, which will hire and deploy 100,000 public health workers. The new administration has also vowed to take a more active role in vaccine distribution, given much of the responsibility to date has been shouldered by state governments, without clear coordination. In the meantime, President Biden has halted the US withdrawal from the World Health Organisation.

Source: Refinitiv.

Fiscal stimulus

The new administration is also prioritising additional fiscal measures to support the economic recovery. The fiscal package of US$900 billion agreed at the end of 2020 is helpful, but insufficient, providing only modest support to the economy beyond Q1 2021. A new package worth US$1.9 trillion (9% of GDP) has been outlined, with spending largely distributed this year. The proposed fiscal package would include another direct cash payment to all Americans (US$1,400 per person), in addition to the previous two payments; it would expand emergency paid leave and unemployment programs, while increasing the minimum wage to US$15; it would extend a 15% increase of benefits under the Supplemental Nutrition Assistance Program; it would expand tax credits for children and child care and reducing health insurance premiums; it would offer grants and investment capital to small businesses; finally, as in some other OECD countries, it would provide funding to help victims of domestic violence. Some of these new initiatives, as well as those designed to contain the pandemic, would entail additional federal funding to state and local governments.

Making growth more inclusive and less carbon-intensive

President Biden has said that longer-term reforms will make growth more inclusive and less carbon intensive (Figure 3). This may include automatic unemployment insurance stabilizers and tax increases for high-income earners and corporations. In addition, significant increase in infrastructure spending could be legislated as well as investment to decarbonise the economy and mitigate climate change. Such pledges accord with the recommendations outlined in the 2020 OECD Economic Survey of the United States. President Biden re-joined the Paris Climate Agreement on the first day of his presidency and intends to introduce more stringent fuel efficiency standards and bolster the climate policies of federal agencies.

Source: OECD.

Working with international partners

President Biden has signalled he would approach international cooperation in a different way, with the objective to “repair alliances and engage with the world once again”. A renewed US commitment to work with international partners to address shared challenges will likely lead to a more ambitious agenda notably on COVID-19, global recovery, climate change, swelling debts in developing countries, trade imbalances, and international corporate taxation.

A bipartisan approach to the reform agenda?

Although President Biden enters office with a united government, his slim majority in both chambers of Congress may make it difficult to enact some aspects of his policy agenda. A simple majority is needed for legislation attached to the budget process (i.e. budget reconciliation legislation) and nominations to executive branch positions and judicial vacancies also only require a simple majority. However, changes not related to the budget, such as related to climate, immigration, minimum wages and labour regulations could be difficult to legislate if the filibuster remains in place (as it means legislation will need 60 votes to pass the Senate compared with the 51  effective votes Democrats currently hold). Similarly, the introduction of a public health insurance option may face resistance. A bi-partisan approach would be essential for all these policies.

The President has already  started to act through Executive Orders. He has announced that he will reinstate environmental regulations. Furthermore, new measures including new appliance and building efficiency standards and changes to make federal government procurement more climate-friendly may be introduced via this pathway. Even so, it is possible that Executive Orders will face challenges in the courts.

What does this mean for the economy?

Overall, the stated policies of the incoming administration would – if implemented — likely boost economic growth in the short-term and make growth more inclusive and less carbon intensive in the medium-term. A well-timed fiscal stimulus would help avoid the recovery losing momentum in early 2021; instead of expanding by about 3½ percent (y-o-y) next year, as projected by the OECD, GDP growth could be notably stronger if much of the proposed stimulus is approved. The immigration and health care policies of the new administration are likely to increase potential labour resources, supporting growth and public finances. While stricter environmental standards may inhibit firm growth, this is typically not the case for more productive firms. Furthermore, such standards have the capacity to drive innovation in environmentally friendly technologies.

Further Reading

OECD information on the United States

OECD Economic Survey of the United States

OECD Economic Outlook, Country Note USA, December 2020

OECD Washington Center

President Biden’s Inaugural Address

President Biden’s American Rescue Plan


Financial inclusion: challenges in OECD countries

By Fozan Fareed, Patrick Lenain, Enes Sunel and Douglas Sutherland, OECD Economics Department

Access to financial services is taken for granted by most people. Amenities such as bank accounts, credit cards, cash dispensers, consumer credit and mortgage loans – all essential to our daily lives – are widely available in OECD countries. When individuals face financial hardship, having access to savings set aside in a bank, or obtaining a consumer credit, is particularly useful. Also, digital payments have proved essential during the COVID-19 pandemic to observe safe distancing rules.

However, not everybody enjoys this kind of financial access. Worldwide, about 1.7 billion people did not have access to basic formal financial services in 2017. In OECD countries, many vulnerable people have insufficient knowledge to go beyond rudimentary transactions or are unable to accumulate savings. Not having access to money management can be a serious problem. People facing emergencies, like a large healthcare bill, may not be able to come up with the funds and remain untreated for their illness. Being unable to make online payments and contactless transactions will be a growing problem in the post-pandemic world. Governments often use electronic payments to make rapid social transfers during recessions (Duenwald et al., 2020), such as the US$1,200 payment sent to all U.S. citizens during the first wave of COVID-19, but may be unable to reach some people. The literature finds that financial inclusion matters for access to employment and income generation (Bruhn and Love, 2014), entrepreneurship creation (Fareed et al., 2017) and women empowerment (Karlan et al. 2017; Pitt et al. 2006). This blogpost highlights several insights from our recent research on three countries: Costa Rica [1] (Sunel, 2020), Mexico (Fareed et al, 2017) and the United States (Azzopardi et al. 2019).

Costa Rica: almost one third of adults without financial access

Despite progress made during the past decade, more than 30% of Costa Ricans aged over 15 do not have an account with a financial institution. Insurance penetration is also very limited and stagnant. This low level of financial access is partly explained by the high cost of banking services, which act like a tax on financial transactions. The lack of competition between banks has impaired the reduction of banking costs and intermediation margins seen in other countries, and Fintech have not been allowed to operate fully to provide low-cost solutions to (especially underbanked) consumers.

To get a sense of regional disparities, we built an index summarising the prevalence, at the level of counties, of financial access points, credit operations, bank accounts and financial transactions (Figure 1). Access to financial services is typically low in counties where the population is not dense, but some highly-populated counties, such as Alajuelita and Desamparados in the province of San José and San Rafael and San Pablo in the province of Heredia, also display very low financial inclusion scores. For micro-entrepreneurs, this makes business operations very challenging, especially for women entrepreneurs. Priority groups such as Indigenous people also suffer more than others from financial exclusion. In response, the authorities have launched a National Financial Education Strategy to boost financial literacy of vulnerable populations and linked conditional cash transfer programme beneficiary accounts to debit card accounts to increase financial account ownership.

Figure 1: Financial inclusion disparities in Costa Rica

Source: Banco Central de Costa Rica; Instituto Nacional de Estadística y Censos; and Superintendencia General de Entidades Financieras.

Mexico: over half of Mexicans without a formal bank account

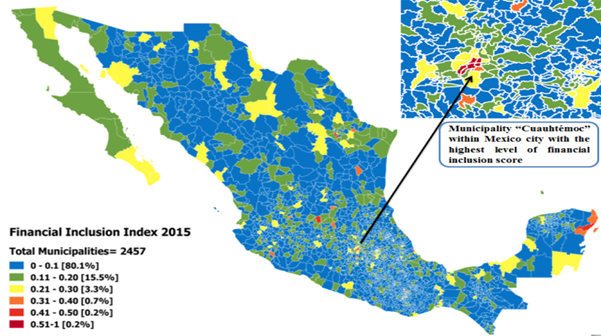
Financial inclusion is even lower in Mexico: more than half of Mexicans aged 15 and over do not have a formal bank account. The penetration of credit, insurance and mobile banking also remains low as compared to regional peers. About 7 million people (6% of the country’s population) live more than 4 miles from the nearest financial access point such as a bank or an ATM according to the financial regulator CNBV. Outside large urban areas, access to financial services is limited and there are prominent regional disparities as highlighted by our financial inclusion index (Figure 2). This is a particular problem for women, who lack access to the banking system and therefore face challenges to launch an entrepreneurship project.

Lack of trust in banks, financial literacy and product design are significant barriers for the many unbanked in Mexico. High commissions and interest rates and poor financial infrastructure are highlighted as some of the main reasons that impede financial inclusion. Addressing these challenges would enable Mexicans, especially women entrepreneurs, to gain access to formal financial services and therefore benefit from new economic opportunities. The authorities have launched a number of actions to address these challenges, for instance the National Financial Inclusion Strategy (NFIS) provides a roadmap to accelerate access to financial services for the currently unbanked segment of the population.

Figure 2: Financial inclusion disparities in Mexico

Source: Author’s Calculations based on CNBV’s data at the municipality level.
Note: Financial inclusion index ranges from 0 (low) to 1 (high). See Fareed et al. (2017) for details.

United States: 28% of Americans are financially vulnerable

Although financial inclusion is high in the United States, financial vulnerability remains a severe problem for many people, especially low-income households, racial groups, and remote locations. Instead of using an arbitrary definition of financial vulnerability or a single indicator, such as indebtedness, we apply a hierarchical ascending clustering (HAC) and K-means clustering analysis to the Federal Reserve’s Survey of Consumer Finance. The analysis identifies clusters of households with high financial vulnerability: about 28% of the households in 2016 can be classified as financially vulnerable.

Our econometric estimates show that Black and African Americans and Hispanics are financially more vulnerable than non-Hispanic white Americans, after controlling for other characteristics. A higher education level of the household head also appears to be statistically significant and is negatively linked with financial vulnerability. On average, having a college degree decreases the probability of being financially vulnerable. Financial literacy is also an area of concern: only 57% of adults in the United States can be considered financially literate according to the Global Financial Literacy Survey. Moreover, an increase in the age of the household head decreases the chances of being financially vulnerable. Such large differences among clusters of households reflect on the social disparities that affect the U.S. population.

Conclusion

Financial inclusion disparities exacerbate existing wealth inequalities and make it extremely difficult for the financially vulnerable to catch up, threatening social cohesion. Our research on Costa Rica and Mexico shows that access to financial services remains a challenge for many people, while large groups of U.S. households can be characterized as financially vulnerable. Since our research was conducted, it is possible that the COVID-19 pandemic has worsened these difficulties: many households have lost their jobs and micro-entrepreneurs have been impacted by government shutdown orders, increasing their financial difficulties. Because low-income households are being hit the hardest, it is more important than ever to facilitate access to financial instruments and encourage money management skills. Our findings suggest that the focus needs to be on closing gender and racial gaps, improving financial literacy, using Fintech responsibly to reach out to financially excluded people, and conducting further research to understand why some households are more at risk than others.


[1] Costa Rica was invited to join the OECD as its 38th member in May 2020.

REFERENCES

Azzopardi, D., F. Fareed, P. Lenain and D. Sutherland (2019), “Assessing Household Financial Vulnerability: Empirical evidence from the U.S. using machine learning”. https://dx.doi.org/10.1787/75c63aa1-en

Bruhn, M. and I. Love (2014). “The Real Impact of Improved Access to Finance: Evidence from Mexico”. Journal of Finance, 69 (3): 1347-1376.

Fareed, F., M. Gabriel, P. Lenain and Julien Reynaud (2017), “Financial Inclusion and Women Entrepreneurship : Evidence from Mexico”, OECD Economics Department Working Papers, No. 1411, OECD Publishing, Paris, https://dx.doi.org/10.1787/2fbd0f35-en.

Karlan, D., Savonitto, B., Thuysbaert, B., and Udry, C. (2017). “Impact of savings groups on the lives of the poor”. Proceedings of the National Academy of Sciences, 114(12), 3079-3084.

Mathai, K., Duenwald, C., Guscina, A., Bukhari, H., Chaudry, A., El-Said, M., Fareed, F., Gerling, K., et al. (2020), “Social Spending for Inclusive Growth in the Middle East and Central Asia” IMF Departmental Papers. No. 20/12.

Pitt, M. M., Khandker, S. R., and Cartwright, J. (2006). “Empowering women with micro finance: Evidence from Bangladesh”. Economic Development and Cultural Change, 54(4), 791-831.

Sunel, E. (2020), “Boosting access to credit and ensuring financial inclusion for all in Costa Rica”, OECD Economics Department Working Papers, No. 1623, OECD Publishing, Paris, https://doi.org/10.1787/86037778-en.


Why are some U.S. cities successful, while others are not? Past lessons for the post COVID-19 era

By Fozan Fareed, Patrick Lenain and Douglas Sutherland1

The COVID-19 pandemic has triggered severe recessions around the world. Beyond this short-term impact, long-lasting changes are also likely to happen. After past shocks, such as the global financial crisis, some industries have remained depressed for a long time, while others got back on their feet and returned to growth quickly, as shown by the evidence from the United States. Similarly, past shocks have hit large cities: some have been quick to recover, but others have struggled for many years, with severe social consequences. Drawing lessons from past shocks is useful as cities plan their own recovery from the pandemic — see also OECD (2020a).

Our research investigated why some cities have adapted to shocks, while others have struggled (Azzopardi et al., forthcoming). We built a dataset covering the 372 metropolitan areas and took advantage of the new Job-to-Job flow statistics compiled by the U.S. Census Bureau, which tracks all job moves. We used a machine-learning algorithm2 to classify the metropolitan areas in statistically distinct clusters. Preliminary results were included in the 2020 OECD Economic Survey of the United States.

Four categories of cities were identified: booming areas (67), prosperous mega metropolitan areas (99), resilient areas (149), and distressed metropolitan areas (57). This classification was obtained by focusing on indicators such as the job-to-job mobility rate, unemployment rate, income growth, population increase and GDP growth rate. The results show that prosperous cities are predominantly located in the West and the South of the United States (Figure 1). The main features of their success have revolved around embracing digital technologies, adopting local regulations friendly to job mobility and business creation, avoiding strict rules on land-use and housing market, and improving the wellbeing of the city’s population3. These results highlight that cities adopting well-targeted policies can accelerate the return to growth after a shock.

  • Booming metropolitan areas: These 67 metropolitan areas, home to about 7% of urban population, have enjoyed very fast growth of GDP per capita. They have often found success thanks to fast-growing industries, notably technology clusters – Midland, Austin, and Colorado Springs are examples. Other cities have found prosperity by becoming retirement destinations – most obviously cities in Florida (The Villages, Pensacola area, Panama City). They have become magnets for people looking for good jobs, high quality of life and comparatively low cost of living. For example, in 2017, about 305,000 workers were attracted by cities in Texas, many having decided to leave California and Louisiana. About 260,000 workers left states such as Georgia and New York and moved to Florida.
  • Prosperous mega metropolitan areas: This cluster is the largest one: it includes 99 metropolitan areas and about three quarters of the U.S. urban population resides here. These are very large cities, with an average population size of 2 million, which can take advantage of agglomeration externalities. This category includes some of the largest U.S. metropolitan areas such as New York, Los Angeles, Chicago, Dallas, Houston, Washington DC and Miami. They have stayed buoyant in the face of shocks and have benefited from low unemployment rates, average job mobility rate, and a high income per capita as compared to other clusters. However, rising inequality is a challenge here, and their future will depend on improving housing affordability and transportation.
  • Resilient metropolitan areas: 149 metropolitan areas are part of this cluster and account for about 11% of the urban population. This cluster is mainly composed of relatively smaller areas such as Lewiston, ID-WA, Great Falls, MT, Columbus, IN and Kokomo, IN. Neither booming nor in distress, these areas are generally classified by relatively low job mobility. However, they have a comparatively higher income per capita growth rate, and a number of these areas seem to be on an upward trajectory. The average population size of this group is the lowest among all clusters.
  • Distressed metropolitan areas: Home to 6% of the total urban population, these 57 metropolitan areas are characterized by a low job mobility rate, high unemployment rate, and low GDP and income per capita growth rates. This group includes many trailing cities and old industrial areas. They can be found in North Dakota (Bismarck), Illinois (Bloomington, Champaign-Urbana) and Southern California (El Centro). Metropolitan areas in central California are also in this cluster. Many of these distressed cities are located in states that are characterized by strict rules on occupational licensing, which has been found in recent OECD work as hindering labour mobility (Hermansen, 2019) and productivity growth (Bambalaite, Nicoletti and Rueden, 2020). In 2017, more than one-quarter million job-to-job moves went out of California to other states. The highest number of these jobs went to Texas (about 33,000) followed by Arizona (about 25,000) and Washington (about 24,000). Another major reason behind these moves seems to be the high cost of living and the high housing prices in some of these metropolitan areas.

Diverging trends between cities create social challenges because new jobs are being created in places far away from the places where old jobs are lost. Moving from job to job is essential for workers to avoid spells of joblessness, remain productive and benefit from higher earnings (Haltiwanger et al., 2018; Hermansen, 2019). However, the U.S. population has become less mobile: the share of the population moving each year has fallen from around 20% in the 1970s to under 10% more recently, with moves across state and metropolitan boundaries or moves to look for work also having been reduced.

Therefore, in order to address the economic and social challenges that the ongoing COVID-19 pandemic has brought to the fore, cities need to act now to avoid long periods of economic downturn. With drastic changes happening in the urban ecosystem, it has become more important than ever to focus on housing and land zoning rules, and other restrictions to mobility, notably occupational licensing. With a major reallocation coming up4, cities that address these regulatory barriers would be in a better position to benefit from new opportunities and attract businesses and talents looking for a new home.

References:

Azzopardi, D., F. Fareed, P. Lenain, D. Sutherland (forthcoming), “Why are some U.S. cities successful, while others are not – New evidence from machine learning”, OECD Economics Department Working Paper.

Bambalaite, I., G. Nicoletti and C. von Rueden (2020), “Occupational entry regulations and their effects on productivity in services: Firm-level evidence”, OECD Economics Department Working Papers, No. 1605, OECD Publishing, Paris.

Barrero, J. M., Bloom, N., and Davis, S. J. (2020). “Covid-19 is also a reallocation shock”. National Bureau of Economic Research Working Paper, No. w27137.

Haltiwanger, J., Hyatt, H., and McEntarfer, E. (2018). “Who moves up the job ladder?”. Journal of Labor Economics, 36(S1), 301-336.

Hermansen, M. (2019). “Occupational licensing and job mobility in the United States”. OECD Economics Department Working Papers, No. 1585, OECD Publishing, Paris.

OCDE (2020a), “Cities Policy Responses”, COVID-19 notes on policy responses.

OECD (2020b). “OECD Economic Surveys: United States 2020


The US COVID-19 recession – Will this time be different?

By D. Azzopardi, M. Hermansen, P. Lenain and D. Sutherland, OECD Economics Department

As COVID-19 hit the United States, non-essential businesses had to shut down and large numbers of workers lost their jobs. The unemployment rate went from a low point of 3.5% in early 2020 to a post-war record high of 14.7% in just two months. With the easing of confinement and the reopening of businesses, many workers were recalled and the unemployment rate fell back to 11.1% in June 2020. After this initial rapid improvement, however, further declines are likely to be slower. The OECD projects that unemployment will still be in the range of 8-10% at the end of 2021, depending on how fast the coronavirus epidemics is controlled, leaving millions of workers without a job (OECD, 2020a).

Business cycle regularities

A striking regularity of business cycles is that unemployment always rises much faster than it falls. The US economy has a remarkable capacity to create jobs after recessions, bringing unemployment back down to a low range of 3-5%. However, this takes time. Many workers lose their link to a previous employer during recessions and need to go through a time-consuming process of job search, retraining, relocation, and temporary contracts before securing stable employment (Gregory et al., 2020). As a consequence, after a recession, the unemployment rate typically declines at the slow average pace of about 0.55 percentage point per year (Hall and Kudlyak, 2020). After the 1981-82 recession, unemployment did not reach 5% until 1989. After the 2008 financial crisis, it took 10 years for the economy to return to full employment (Figure 1). If this historical regularity still applies, the United States may not return to full employment until the early 2030s. Adopting policy reforms to hasten the return to work would mitigate the impact on job seekers in terms of earning losses and well-being (Davis et al., 2011).

A large reallocation shock has hit workers providing in-person services

The COVID-19 crisis is not a typical recession. Instead of coming from the accumulation of imbalances (inflation in early 1980s, credit bubble in 2008), it results from government lockdown orders to protect the population from the pandemic. Once businesses reopen, some workers are quickly reemployed. Judging from the experience of New Orleans after Hurricane Katrina, unemployment can decrease fast as sectors such as retail trade, education and social services restart their activity (Figure 1). However, the COVID-19 pandemic is likely to have a longer-lasting impact: sectors such as air transport, leisure, entertainment, accommodation and food services may remain depressed for a long time if distancing and customer anxiety continue to prevail. In June 2020, despite progress in reopening, 10 million jobs had still been lost in shutdown sectors, and the unemployment rate was still close to 30 percent in the leisure and hospitality industry (Figure 2).

The coronavirus crisis has been characterized as a “reallocation shock” (Barrero et al, 2020) because many workers providing in-person services will have to find work in other parts of the economy. Past sector-specific shocks show that such a reallocation can be difficult. After the China shock of early-2000s (Autor, 2016), which hit the manufacturing industry hard in the Midwest, it took 15 years to return to earlier levels of employment in this region.

The new Job-to-Job dataset of the Census Bureau shows that many manufacturing workers were able to move to other industries or to other parts of the country after the China shock, but low skilled and seniors faced greater difficulties (Azzopardi et al, 2020). The same dataset suggests many construction workers struggled to return to work after the 2008 burst of the housing bubble. This is worrying because the sectors presently locked down employ a large share of workers who will have difficulties moving to new industries, and these jobs are often entry points for workers joining or re-joining the labour force. If previous patterns once again emerge, the sluggish reallocation of workers may prevent the United States from returning quickly to full employment.

Lessons from the past also suggest that a set of regulatory easing measures and support to dismissed workers could help. Regulations introduced in past decades at the state level – especially mandatory occupational licenses, non-compete contracts, and housing regulations ¬– hinder the fluidity of the worker-job matching process and slow down the reallocation of workers across industries (Hermansen, 2019). Easing these restrictions, for instance by eliminating these requirements when not clearly justified or through interstate reciprocity agreements, would quicken the return to full employment. Similarly, a reform of unemployment benefits from passive support to active policies favouring labour-market reintegration, reskilling and geographic mobility — would help the return to work of job seekers and avoid long spells of unemployment and their scarring effects. These policy options are detailed in the new OECD Economic Survey of the United States (OECD, 2020b).

References

Autor, D., D. Dorn and G. Hanson (2016), “The China Shock: Learning from Labor-Market Adjustment to Large Changes in Trade”, Annual Review of Economics,

Azzopardi, D. et al. (2020), ”Why has labour mobility declined in the United States? Insights from a new dataset”, Technical Background Paper, forthcoming.

Barrero, J. M., N. Bloom and S.J. Davis (2020), “COVID-19 Is Also a Reallocation Shock”, Brookings Papers on Economic Activity, Summer 2020.

Davis, Steven J. and Till Von Wachter (2011), “Recessions and the Costs of Job Loss”, Brookings Papers on Economic Activity, Fall.

Gregory, Victoria, Guido Menzio and David G. Wiczer (2020), “Pandemic Recession: L or V-Shaped?”, NBER Working Paper No. 27105

Hall, Robert E. and Marianna Kudlyak (2020), Why Has the US Economy Recovered So Consistently from Every Recession in the Past 70 Years?, NBER Working Paper No. 27234 May.

Hermansen, Mikkel, 2019. “Occupational Licensing and Job Mobility in the United States,” OECD Economics Department Working Paper No. 1585.

OECD (2020a), OECD (2020), OECD Economic Outlook, Volume 2020 Issue 1: Preliminary version, No. 107, OECD Publishing, Paris,

OECD (2020b), Economic Survey of the United States, OECD Publishing, Paris


Occupational licensing in the United States: too much of a good thing?

By Mikkel Hermansen, Economics Department

More than one fifth of all American workers now need an occupational licence to go to work (Figure 1). This type of regulation sets requirements – education, exams, work experience etc. – to practice a profession and use a protected title. Most OECD countries license doctors, dentists and lawyers, which is typically justified by the need to protect safety and ensure quality of services.

But licensing has spread to more and more occupations across the United States, including security guards, home inspectors, interior designers and even florists in some States. Here the benefits of licensing are much less clear, while costs are likely to be sizeable in terms of lower job mobility, reduced competition and ultimately weaker productivity growth (von Rueden et al., 2020).

In a new working paper, I identify several statistical associations (Hermansen, 2019): all measures of job hire and job separations are negatively associated with higher coverage of occupational licensing as well as with stricter requirements of the regulation (Table 1). The analysis is based on administrative data from State unemployment insurance and thus covers almost all job transitions and regulated occupations in the United States.

Has licensing then contributed to the secular decline in mobility? A simple simulation suggests that the results are indeed economically important (Figure 2). Consider the following experiment: suppose licensing coverage had declined during the 2000s to be 5 percentage points lower than the observed 22% in 2018 (Panel A). Taking the results at face value, this could have lifted the job hire rate by 0.6 percentage point – a sizeable boost amounting to a quarter of the decline observed since 2000 (Panel B).

References

Hermansen, M. (2019), “Occupational Licensing and Job Mobility in
the United States”, OECD Economics
Department Working Papers
, No. 1585, OECD Publishing, Paris, https://doi.org/10.1787/4cc19056-en

von Rueden, C., G. Nicoletti, I. Bambalaite (2020), “Occupational
Entry Regulations and their Effects on Productivity in Services: Measurement
and Firm-Level Evidence”, OECD Productivity
Working Papers
, forthcoming.


Opioid addiction costs many lives and harms livelihoods

US-Economic-Survey-2018by Douglas Sutherland, Senior Economist, US Desk, Economics Department.

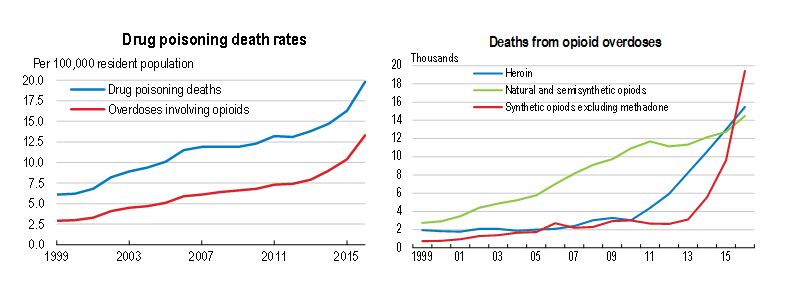
Case and Deaton (2017) highlighted increasing midlife mortality due to suicides and drug and alcohol abuse since the late 1990s contributing to relatively modest gains in life expectancy. In the past decade, overdose deaths have surged, particularly as (illicit) synthetic opioids have become more available. Opioid-related deaths touch urban and rural communities alike and are spreading to affect all demographic groups.

US4.JPGOpioids are far more commonly prescribed in the United States than elsewhere in the OECD. Between 1999 and 2014, opioid prescriptions in the United States quadrupled. This was compounded by relatively liberal policies on the number of opioids being prescribed, the long duration of treatment and aggressive marketing. Ultimately millions of individuals were exposed to addictive substances, either the intended patient or through unused drugs being taken by family members or others.
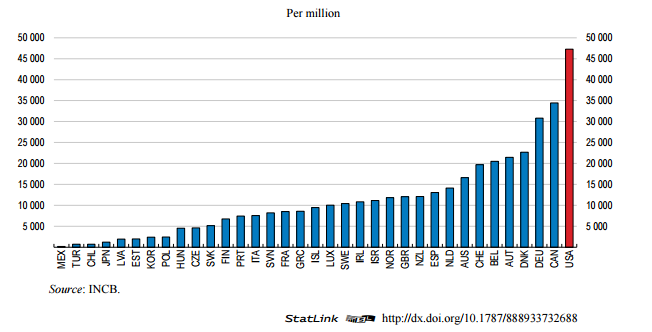
Opioid prescriptions are substantial in the United States

opiod usa blog

The consequences of the opioid epidemic are felt through deaths, the impact on livelihoods and by breaking up homes and communities. Opioid use appears to be connected to labour market conditions with prescription rates typically higher where labour force participation is lower. Krueger (2017) found that around one-fifth of the non-participating prime age males were regularly taking opioid painkillers. While causality is difficult to establish opioid addiction ultimately impairs participation. This contributes to costs to the economy of lost wages and productivity, as well as fiscal costs from foregone revenue and spending on emergency care and the treatment of addiction. Estimates suggest an annual cost of around $80 billion, but if the loss of life is also taken into account then the cost of the crisis in 2015 could be over $500 billion (CEA, 2018).

US6.JPG

Such losses of lives and enormous impact on society justify taking action. To address the immediate challenge, making drugs that can reverse the effects of overdoses more widely available can reduce avoidable deaths. Efforts to tighten access to opioids will reduce the inflow of patients developing opioid dependence. For those already suffering from addiction, medically-assisted treatments are proven options, but may require relaxing administrative barriers in order to expand their reach. These efforts will need to be complemented by re-integrating former addicts into employment and housing to prevent relapse. Research on the causes and effects of widespread addiction should also be encouraged.

References:

Case, A. and A. Deaton (2017), “Mortality and Morbidity in the 21st Century”, Brookings Papers on Economic Activity,

CEA (2017), The Underestimated Cost of the Opioid Crisis, The Council of Economic Advisers, Washington, D.C.,

Krueger, A. (2017), “Where Have All the Workers Gone? An Inquiry into the Decline of the U.S. Labor Force Participation Rate”, Brookings Papers on Economic Activity

OECD (2018), Economic Surveys: United States, OECD Publishing, Paris.