Estonia’s new car tax and registration fee: Are they changing consumer demand?
Category: Estonia,Tax,Uncategorized
written by oecdecoscope | September 16, 2025
By Zuzana Smidova and Vaiva Šeckute, OECD
At the beginning of the year, Estonia introduced a vehicle registration fee and an annual car tax linked to the vehicle’s greenhouse gas (GHG) emissions. Until then, it was one of the few European countries without motor vehicle taxes.
OECD countries increasingly use vehicle taxation to encourage drivers to switch to cleaner cars and reduce emissions, as well as to raise revenue, by linking these taxes to emissions. Although motor fuels are already taxed, consumers tend to undervalue the long-term savings from choosing more efficient vehicles, so registration fees can help change purchasing patterns.
Estonia’s car fleet is one of the oldest in the EU and has some of the largest engines (Figure 1). Transport emissions account for around one fifth of Estonia’s total greenhouse gas emissions. Achieving the target of a 25% decrease by 2035 compared to the 2005 level is proving challenging with emissions remaining stable in recent years.
In 2023, the average CO2 emissions per kilometre from new passenger cars were among the highest in the EU (Figure 2). This partly reflects reliance on purchases of second-hand cars from western Europe and the absence of an emissions-based motor vehicle tax.
Data from the first eight months of the year show that, since the tax was introduced, purchasing has moved more rapidly than before towards cars emitting less emissions (Figure 3). The overall number of passenger car registrations dropped as many consumers who had planned to buy a car did their purchases last year in anticipation of the tax. Looking at the breakdown by vehicle type, there has been a shift towards cleaner vehicles. The data shows that the registrations of electric vehicles increased, while registrations of hybrid cars declined less than petrol and diesel cars compared to the same period of last year. As a result, the share of electric vehicles rose from about 5% last year to 10% and the share of hybrid vehicles grew from some 25% to almost 40%. Encouragingly, based on these first estimates, average emissions from newly registered cars also fell by 10% (ERR, 2025).
Introducing the registration fee and annual tax are a significant achievement and the link to emissions and engine size seem to be bearing fruits. Nevertheless, some of its features could be improved further. The annual tax decreases with vehicle age. While this aims to make it more affordable for those on low incomes who tend to have old cars, it undermines the incentives to switch to more efficient cars. Instead, a targeted car scrappage scheme for older vehicles financed by the revenues from the motor tax could be considered.
Decreasing emissions from transport will require strong incentives on multiple fronts – increasing availability of public transport, introducing stricter minimum emission standards and moving towards distance-based charging, which can allow for higher charges where alternatives for cleaner modes of transport exist (OECD, 2024; van Dender, 2019).
By Bertrand Pluyaud and Adolfo Rodríguez-Vargas, OECD Economics Department
Before the COVID-19 pandemic, the Spanish economy experienced a period of sustained and more balanced economic growth, less dependent on the construction sector, and with a healthier financial system. The pandemic and Russia’s war of aggression against Ukraine were successive shocks that required strong government support to protect businesses and households, as noted in the 2023 Economic Survey of Spain. Output has recovered to its pre-pandemic level, and growth has held up well since the second half of 2022 and it is expected to remain solid in 2024.
The recovery from the pandemic has been steady following the large fall of GDP in 2020
Gross Domestic Product, Volume, base 2019Q4 = 100
Spain has also introduced several major reforms to address longstanding labour market issues, promote business growth and innovation, ensure pensions’ sustainability, and boost vocational education. However, structural weaknesses remain that weigh down Spain’s growth potential. The 2023 Economic Survey discusses policy options to tackle these issues in four areas.
Addressing fiscal challenges
Government action was decisive for the recovery, but it was costly. Public debt, which was already high before the pandemic, has increased by 13 percent points of GDP since 2019. Sustained fiscal consolidation is required to keep debt on a downward path and to make room for ageing-related spending and growth-enhancing items, like education and green transition. This consolidation should rely on both mobilising additional revenues and on enhancing spending efficiency.
Increasing the relatively low tax intake should encompass gradually broadening the value added tax base and raising environment-related taxes, but also reducing tax avoidance and enhancing tax collection. Spending reviews should continue to be used to define growth-enhancing spending priorities, and evaluation of public policies should become the norm.
Public debt remains high
Public debt, Maastricht definition, % of GDP
Source: Eurostat.
Raising productivity
Low investment in R&D, inefficient public spending on education and training, and an insufficient stock of ICT capital have dragged down productivity growth, which in the last decade has averaged 0.6% per year compared to 0.9% for the OECD. The share of innovative companies is also comparatively low. All this weighs on potential growth, which with rapid population ageing is expected to weaken even more.
Promoting collaboration and knowledge transfer between businesses and universities, fostering entrepreneurship, reducing regulatory barriers, and improving regulation can increase innovation and business growth. Continuing with an effective implementation of the investment and reforms under the national Recovery, Transformation and Resilience Plan should remain a priority, as it can help overcome structural deficiencies and boost productivity.
Promoting opportunities for all people across Spain
Despite recent improvements, income inequalities remain significant. Poverty is high compared to the OECD, and Spain has the highest child poverty rate in Western Europe, at 22%. This makes it urgent ensuring that public assistance is sufficient and reaches those who need it more. The survey recommends improving the targeting of social benefits, particularly towards poor families with children, boosting the take-up of the minimum income guarantee, and reducing administrative burdens for users.
Young people in Spain face a challenging transition to an independent, productive, and happy adult life. The risk of poverty among them is particularly high, although it has fallen. That is why the special topic of this survey is how can Spain increase opportunities for its young.
Educational and labour market outcomes have improved, but many young people still leave the education system with low education levels or skills, and youth labour-market integration remains difficult. The share of temporary contracts has decreased after the 2021 labour market reform, but it is still high. The survey recommends training teachers to identify and assist students at risk and maintaining support for students to enrol in vocational education, including by fostering the participation of SMEs to offer places. Furthermore, to ease school-to-work transitions it encourages greater employer involvement in the design of university curricula, and improving access to financing for young entrepreneurs.
Housing is a pressing concern for many people in Spain, especially the young. To increase housing supply, the survey recommends expanding the very low stock of social rental housing and relaxing stringent rent controls.
Young people face high poverty risks
Risk of poverty or social exclusion, %
Note: OECD Europe includes European OECD countries and excludes Türkiye. Source: INE.
Addressing environmental challenges
Spain has made progress in the fight against climate change, as environmental protection expenditure has increased and renewable energies are becoming more prevalent in the energy mix. To keep reducing its dependence on fossil fuels, Spain should accelerate the shift towards greener transportation, improve storage and grid interconnections, and continue promoting renewable energies.
A more environment-friendly tax regime is also needed, as environmental tax revenue as a share of GDP is low compared to most OECD European countries. The base for environment-related taxation can be broadened, including by phasing out exemptions and gradually increasing the tax rate on emissions, while compensating partially and temporarily the most vulnerable.
Persistent drought in some regions has lowered water availability, and intense agriculture production has affected water quality. These problems could be addressed through more efficient irrigation, reuse and recycling of waters, and a more sensible use of fertilizers.
Improving water availability and quality is urgent
Groundwater stations with poor quality standards, %
Note: Groundwater stations failing to meet the drinking water standard under the EU Nitrates Directive Source: European Environment Agency (EEA).
Government action helped Spain to overcome two major successive shocks. Evidence-based public policies can also help to solve Spain’s longstanding structural weaknesses to increase growth and raise wellbeing for all people across Spain.
Peru has made significant strides over the past two decades in reducing poverty and improving living standards, outperforming many Latin American peer countries as highlighted in the 2023 Economic Survey of Peru. The basis for this progress was the country’s robust macroeconomic framework and ambitious structural reforms implemented in 1990s. These reforms have catalysed macroeconomic stability, high economic growth, low inflation and low public debt.
The COVID-19 pandemic, however, exposed remaining challenges. Peru experienced one of the most severe economic contractions and excess mortality rates of any country. The economy bounced back in 2021, thanks to its fiscal buffers. The recovery was short-lived and a series of shocks, including Russia’s war of aggression in Ukraine, social unrest and extreme weather events led to inflationary pressures and economic slowdown. The economy is projected to gradually recover with inflation returning to the target range by early 2024. However, Peru faces long-standing structural issues like a large informal sector, infrastructure gaps, and a weak rule of law. These not only magnify the impact of adverse shocks and socio-economic inequalities but also hold up Peru on its path towards better standards of living.
As Peru embarks on its journey towards OECD accession, the process represents a transformative opportunity for the country to design and implement a comprehensive reform agenda to foster convergence to higher living standards for all Peruvians. The 2023 Peru Economic Survey highlights four key priority areas of reforms:
Fostering Long-Term Growth
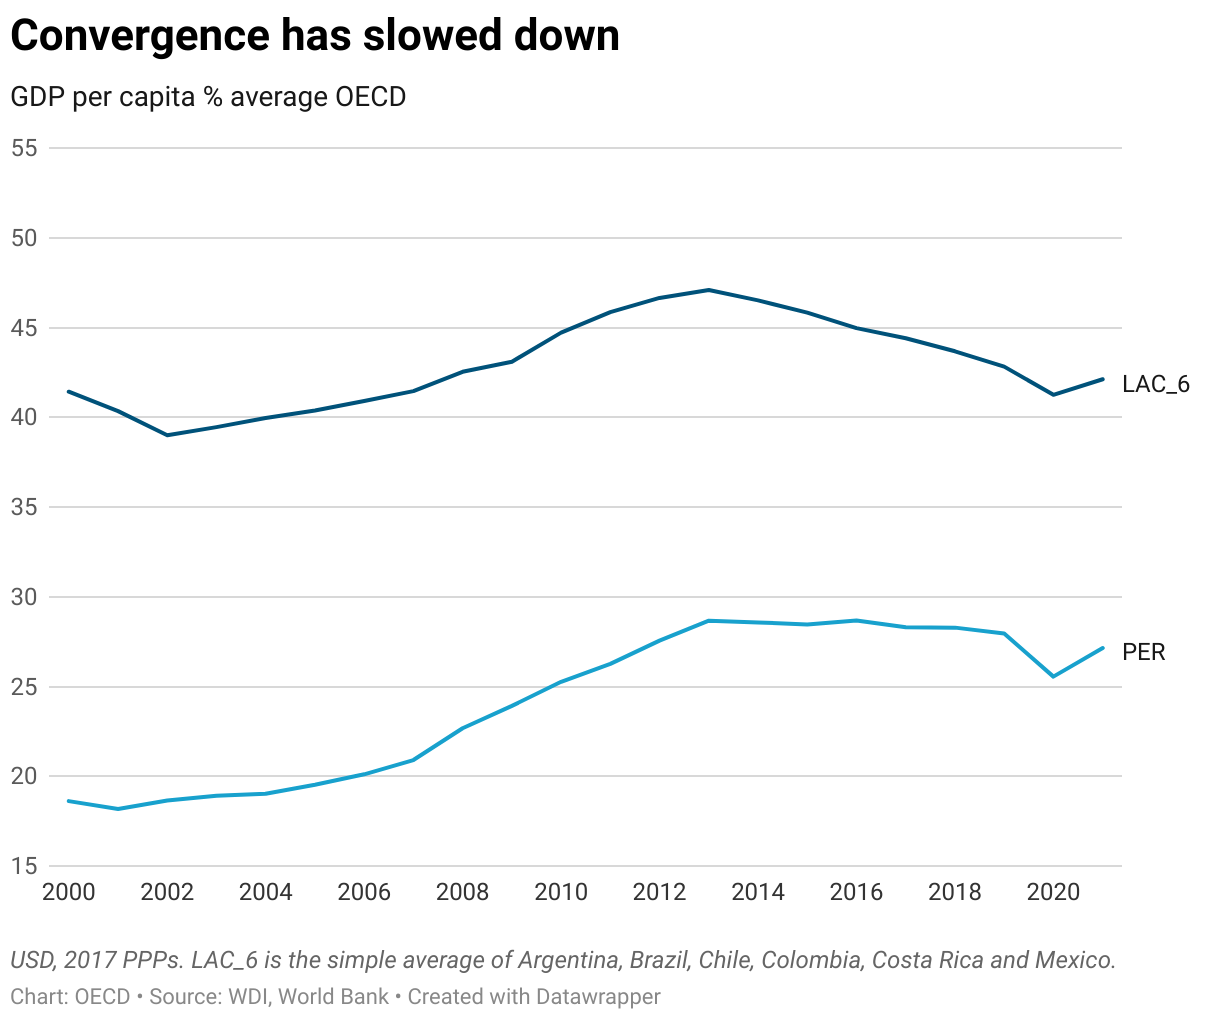
Income convergence to more advanced countries stalled in 2014 with the end of the commodity price boom, making it of utmost importance to boost productivity and investment. While commodities, particularly minerals, have fuelled past growth, there is a need to expand the economy’s productive base. High concentration of market power in a few major business groups reduces market dynamism. This calls for strengthening competition enforcement and simplifying regulations to boost productivity. Additionally, better public spending efficiency would help close infrastructure gaps and deliver essential services while boosting potential growth. This entails enhancing local government capabilities, improving infrastructure planning, and modernising the civil service to enhance overall state capacity. Strengthening the rule of law by fighting corruption and improving judicial independence and efficiency is equally important, as it not only encourages investment but also restores trust in institutions.
Tackling Informality
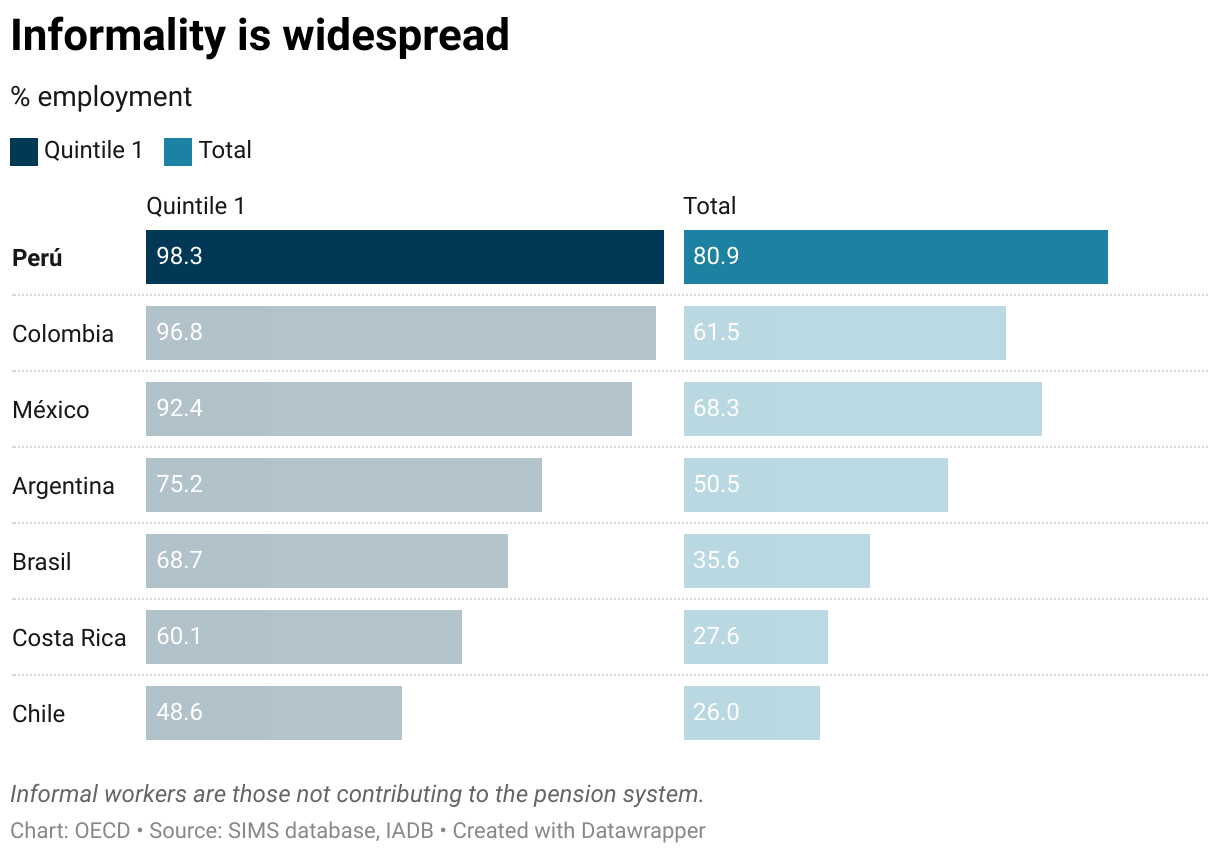
The challenge of informality looms large in Peru, with around 80% of workers in informal jobs, without social and labour protection, and on the margin of the formal tax and benefit system. Though there is no silver bullet solution as the roots of informality are multi-dimensional, fostering formality through a comprehensive reform package is essential for reducing poverty and inequality, boosting productivity, and improving tax collection. Ensuring universal access to basic social benefits – health, pensions, and social assistance – for both formal and informal sector workers alike, could remove some distortions that incentivise informality. This requires increased social spending funded by general taxation instead of by social contributions that make formal job creation expensive incentivising informal job creation. Providing universal access to pensions and health services financed by general taxation offers the possibility of reducing social contributions for low-income workers, promoting formal employment, and boosting productivity. Improving access to high-quality education tackles another root cause of informality, low labour productivity. Closing the gap in learning outcomes, especially among disadvantaged students, requires improving teachers’ training and addressing school infrastructure gaps.
Strengthening Public Finances
Peru’s current tax revenues, at 17% of GDP, lag both OECD and regional peers. A key challenge for Peru is sustaining fiscal responsibility while addressing social and infrastructure needs. Addressing this gap requires a multifaceted approach: improving spending efficiency while strengthening tax administration, reducing tax expenditures, modernizing property registries, and streamlining corporate tax schemes.
Confronting Climate Change
Climate change poses another significant challenge for Peru. The country is highly vulnerable to extreme weather events and is committed to achieving carbon neutrality by 2050. To achieve this goal, the country must combat deforestation—a major contributor to greenhouse gas emissions—and accelerate the use of renewable energy sources implementing stricter regulations and consistent price signals to reduce reliance on fossil fuels, tapping the enormous potential that the country has in this area.
As Peru navigates these multifaceted challenges, its process of accession to the OECD can offer a framework for long-term reforms that address existing vulnerabilities and allow the convergence to higher living standards. This roadmap, grounded in evidence and best practices, should build on the successes of the past, such as the robust macroeconomic setup that fuelled Peru’s economic growth. Realising this transformation demands political consensus, evidence-backed policies, and collaborative efforts.
Perú ha logrado significativos avances en las últimas dos décadas hasta 2019 en la reducción de la pobreza y la mejora de los niveles de vida, superando a muchos países de América Latina, como se destaca en el Estudio Económico de la OCDE de Perú 2023. La base de este progreso fue un sólido marco macroeconómico y ambiciosas reformas estructurales implementadas en la década de 1990. Estas reformas han logrado darle al país estabilidad macroeconómica, alto crecimiento económico, baja inflación y una de las menores ratios de deuda pública- PIB en la región.
Sin embargo, la pandemia de COVID-19 puso de manifiesto los desafíos estructurales pendientes. Perú experimentó una de las contracciones económicas y tasas de mortalidad más altas de todos los países. La economía se recuperó en 2021, gracias a los existentes amortiguadores fiscales. Pero la recuperación fue transitoria y una serie de shocks, como la guerra de agresión de Rusia en Ucrania, conflictos sociales y el fenómeno del Niño, provocaron presiones inflacionistas y una ralentización económica. Se prevé que la economía se recupere gradualmente y que la inflación vuelva al rango objetivo a principios de 2024. Sin embargo, Perú se enfrenta a problemas estructurales de larga data, como una alta proporción de empleos informales, amplias brechas en infraestructuras básicas y un débil Estado de Derecho. Estos problemas no sólo magnifican el impacto de shocks adversos y las desigualdades socioeconómicas, sino que también frenan a Perú en su camino hacia mejores niveles de vida.
A medida que el Perú se embarca en su viaje hacia la adhesión a la OCDE, el proceso representa una oportunidad transformadora para que el país diseñe e implemente una agenda integral de reformas para fomentar la convergencia hacia mejores niveles de vida para todos los peruanos. El Estudio Económico del Perú 2023 destaca cuatro áreas prioritarias de reformas:
Fomentar el crecimiento de largo plazo
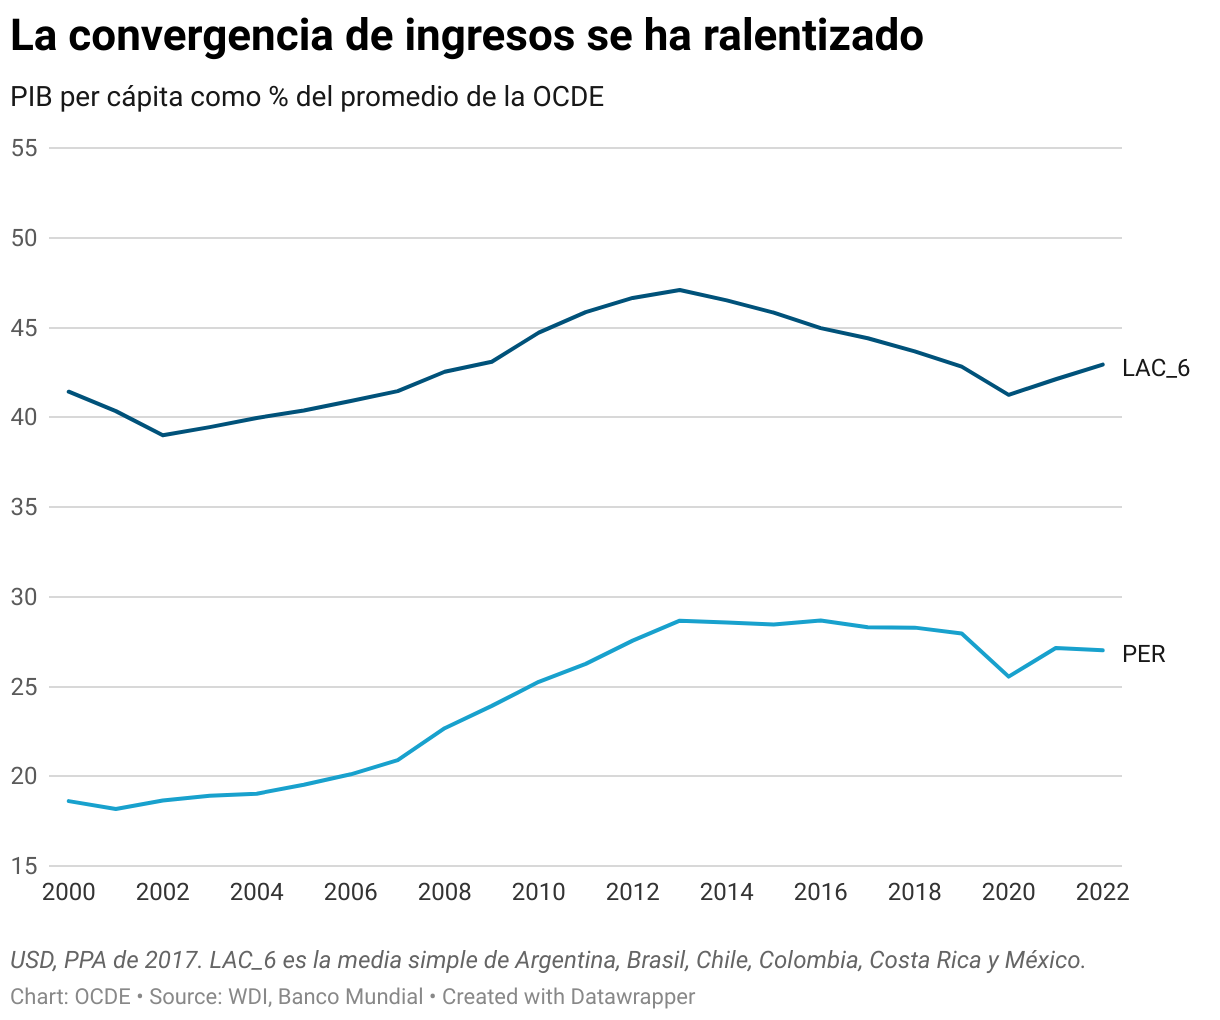
La convergencia de ingresos hacia los países más avanzados se estancó en 2014 con el fin del auge de los precios de las materias primas, por lo que es de suma importancia impulsar la productividad y la inversión. Aunque las materias primas, en particular los minerales, han impulsado el crecimiento en el pasado, es necesario ampliar la base productiva de la economía. La elevada concentración del poder de mercado en unos pocos grandes grupos empresariales reduce el dinamismo del mercado. Esto exige reforzar la aplicación de las leyes de competencia y simplificar las regulaciones y licencias para impulsar la productividad. Además, una mayor eficiencia del gasto público ayudaría a cerrar las brechas en infraestructuras y a prestar servicios públicos esenciales, impulsando al mismo tiempo el crecimiento potencial. Ello implica reforzar las capacidades de los gobiernos subnacionales, mejorar la planificación de las infraestructuras y modernizar el servicio civil para aumentar la capacidad de implementación del Estado. El fortalecimiento del Estado de Derecho mediante la lucha contra la corrupción y la mejora de la independencia y la eficiencia del sistema judicial es igualmente importante, ya que no sólo fomenta la inversión, sino que también puede restablecer la confianza en las instituciones.
Luchar contra la informalidad
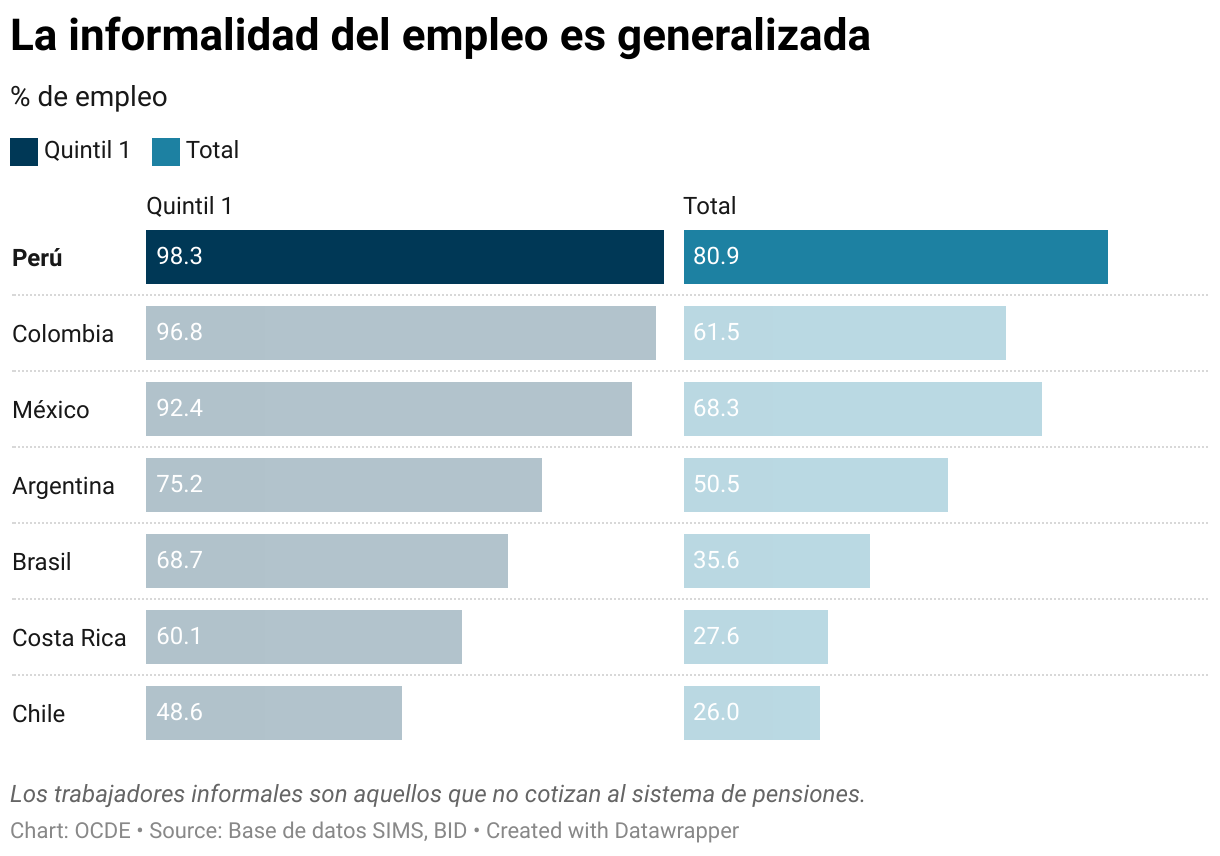
La informalidad representa un gran desafío para Perú, con cerca del 80% de los trabajadores en empleos informales, sin protección social o laboral, y al margen del sistema formal de impuestos y transferencias. Aunque no existe una solución milagrosa, ya que las raíces de la informalidad son multidimensionales, fomentar la formalidad a través de un paquete integral de reformas es esencial para reducir la pobreza y las desigualdades, impulsar la productividad y mejorar la recaudación tributaria. Garantizar un acceso universal a unos servicios básicos de protección social – en salud, pensiones y asistencia social – tanto para los trabajadores formales como informales, podría eliminar algunas distorsiones que incentivan la informalidad. Para ello es necesario aumentar el gasto social financiado con impuestos generales en lugar de con contribuciones sociales que encarecen la creación de empleo formal incentivando así la creación de empleo informal. Proporcionar un acceso universal a las pensiones y a los servicios de salud financiados por impuestos generales ofrece la posibilidad de reducir las contribuciones sociales de los trabajadores de bajos ingresos, promoviendo el empleo formal e impulsando la productividad. Mejorar el acceso a una educación de alta calidad aborda otra de las causas fundamentales de la informalidad, la baja productividad laboral. Cerrar la brecha en los resultados de aprendizaje, especialmente entre los estudiantes desfavorecidos, requiere mejorar la formación de los maestros y abordar las deficiencias de las infraestructuras escolares.
Fortalecer las finanzas públicas
Los ingresos tributarios del Perú, del 17% del PIB, son inferiores a los de sus pares de la OCDE y de la región. Un reto clave para Perú es mantener la responsabilidad fiscal al tiempo que se abordan las necesidades sociales y de infraestructura. Enfrentar este desafío requiere un enfoque multidimensional: mejorar la eficiencia del gasto público al tiempo que se refuerza la administración tributaria, se reducen los gastos tributarios, se moderniza el catastro y se racionalizan y simplifican los regímenes del impuesto a la renta de sociedades.
Afrontar el cambio climático
El cambio climático plantea otro desafío importante para Perú. El país es muy vulnerable a los fenómenos meteorológicos extremos y se ha comprometido a alcanzar la neutralidad de carbono para 2050. Para lograr este objetivo, el país debe combatir la deforestación -un importante contribuyente a las emisiones de gases de efecto invernadero- y acelerar el uso de fuentes de energía renovables aplicando regulaciones más estrictas y señales de precios coherentes para reducir la dependencia de los combustibles fósiles, aprovechando el enorme potencial que el país tiene en energías renovables.
Mientras Perú navega por estos desafíos multidimensionales, el proceso de adhesión a la OCDE puede ofrecer un marco para reformas que aborden las vulnerabilidades existentes y permitan la convergencia hacia niveles de vida más altos para todos los peruanos. Esta hoja de ruta, basada en evidencia y buenas prácticas, debería aprovechar lo que ha funcionado bien, como el sólido marco macroeconómica que ha impulsado el crecimiento económico de Perú. Llevar a cabo esta transformación exige consenso político, políticas basadas en evidencia y esfuerzos de todos los peruanos.
by Flurim Aliu (CEP)1, Robert Grundke (OECD), Christian von Haldenwang (IDOS)2
Since the 1960s, Germany has been among the first countries to publish regular reports on tax expenditures. Today, however, its tax expenditure reporting is incomplete and lacks consistency. Reforms are needed to increase transparency related to tax expenditures and enable a better prioritization of the use of public resources.
Introduction
As argued in the 2023 OECD Economic Survey of Germany, addressing the large accumulated investment backlog and investment needs related to the green and digital transitions will require a large amount of public resources. At the same time, rapid population ageing increases public spending pressures in pension, health and long-term-care systems and exacerbates labour shortages. Lowering labour taxes to improve incentives to raise labour supply, particularly for low-skilled workers and second earners, could further reduce fiscal space. To tackle these challenges while safeguarding fiscal sustainability, it is crucial to increase public sector spending efficiency and better prioritise spending.
To this end, transparency on spending items is key. As in many other countries, the use of public resources to grant beneficial tax treatments (or tax expenditures) is less well reported and scrutinized in Germany than direct spending. Tax expenditures are defined as deviations from a benchmark tax system that typically benefit specific sectors, groups of individuals or activities. Policymakers use them to pursue different objectives, such as attracting investment, promoting employment or fighting poverty.
Like other EU countries, Germany publishes regular and comprehensive reports on tax expenditures. Its official tax expenditures figures are remarkably stable over the years, averaging 0.9 per cent of GDP since 2014, according to the Global Tax Expenditures Database (Redonda et al. 2023). Although significant differences in benchmark tax systems exist between countries influencing estimates of tax expenditures, these figures are considerably lower than those of Germany’s neighbors (such as the UK: 7.5 per cent of GDP or the Czech Republic: 10.5 per cent) or many other OECD member countries (e.g. US: 7.4 per cent; Australia: 8.4 per cent).
However, this does not necessarily mean that Germany has used tax expenditures more prudently than other countries. Germany’s tax expenditure reporting is incomplete and lacks consistency, and its official figures do not provide the full picture. The main reason for this is that Germany does not apply a well-defined tax benchmark, and as a result does not have a transparent list of tax expenditures. This limits tax policy reform discussions. Neither the political authorities – the German Bundestag in particular – nor the general public are currently in a position to fully assess the extent to which tax expenditures are used in the country, or to lead a well-informed debate on their effectiveness for public policy purposes.
The current state of tax expenditure reporting in Germany
Since 1967, the German government, under the responsibility of the Federal Ministry of Finance (BMF) has issued a “Subsidy Report” every two years, providing information on direct subsidies as well as tax expenditures. However, these reports have considerable limitations.
Apart from information on subsidies granted as transfers, the Subsidy Report provides information on 1.) provisions officially acknowledged as “tax expenditures” as well as 2.) provisions “resembling” subsidies, such as for instance income tax exemptions on donations to political parties, religious or philanthropic organizations, listed in Annex 3 of the report. While information on the former is summarized in provision “sheets” with detailed descriptions of each provision, the revenue forgone and the latest evaluations (if applicable), information on the latter is incomplete and consists of only one summary table with the revenue forgone by provision (where available). No further information on these measures is given in the report, and they are not subject to regular evaluations.
In addition, many provisions are not included, as highlighted in a report by the German Federal Environment Agency (UBA). Of the 35 tax provisions identified by UBA as “environmentally harmful”, 21 do not figure at all in the BMF report. For another 8 provisions the BMF reports revenue forgone figures that are either substantially lower than those estimated by UBA or altogether missing for that year (Figure 1). UBA and BMF figures match almost exactly only for five provisions, and for one provision the BMF reports higher revenue forgone figures than UBA. Different benchmark definitions, assumptions and estimation methods explain these differences.
Figure 1. Provisions with different revenue forgone estimates, BMF Subsidy Report and UBA report (2018, Euro million)
Source: BMF (2019), 27. Subventionsbericht des Bundes, Bundesministerium der Finanzen (BMF). Burger, A. and W. Bretschneider (2021), Umweltschaedliche Subventionen in Deutschland, Umweltbundesamt (UBA).
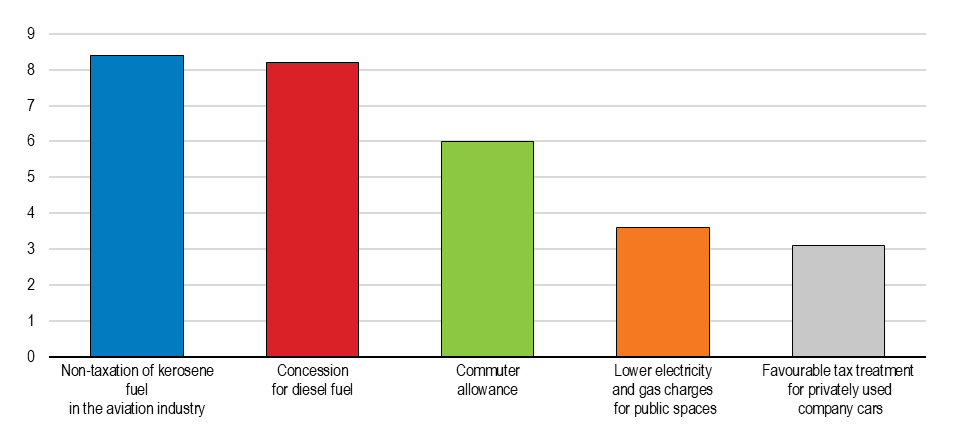
As a result, estimates for total revenue forgone due to tax expenditures are substantially different. For the above-mentioned 35 provisions alone, UBA reports revenue forgone of 68.3 billion euros, while the BMF Subsidy Report only accounts for 5.7 billion euros related to these provisions. While the BMF estimates for revenue forgone are lower for about half of those provisions that are included in both reports, most of the difference comes from the provisions that are not included in the BMF Subsidy Report. Energy tax exemptions for kerosene and agricultural diesel, for example, account for more than 8 billion euros each according to the UBA report.
Figure 2. Large provisions not included in the BMF Subsidy Report but reported by UBA (2018, in Billion. €)
Source: Burger, A. and W. Bretschneider (2021), Umweltschaedliche Subventionen in Deutschland, Umweltbundesamt (UBA).
Other provisions are not reported at all by any governmental agency. Prominent examples are the following tax expenditures for real estate investments, which have been estimated by the German ifo institute to amount to a total of EUR 11 billion per year (Fuest, Hey and Spengel, 2021). Capital gains from selling real estate are fully exempted from personal income tax, if the property has been held for more than 10 years, leading to revenue losses of around EUR 6 billion per year. Moreover, profits of real estate companies are fully exempted from the Gewerbesteuer, which is a municipal-level corporate income tax with an average rate of 15%, entailing a revenue loss of around EUR 5 billion.
Coverage of provisions is not the only issue present in the Subsidy Report. While most of the countries around the world that report on tax expenditures do so annually, the BMF only publishes its Subsidy Report every other year. This is problematic because it detaches discussions of tax expenditures from other budget discussions. Only revenue forgone from the 20 largest tax expenditures (as per the BMF Subsidy Report) is included in the annual budget plan, providing an incomplete picture of the federal government’s total tax expenditures to the Bundestag.
Germany is also lagging its peers when it comes to progress on estimating the revenue forgone of its tax expenditures (or those “resembling” tax expenditures). Since the 1990s, the Subsidy Report has provided revenue forgone figures for just about half of the listed provisions. For comparison, this share is around 70% in Canada and around 80% in France. The revenue forgone figures that are reported in every iteration also present some inconsistencies over the years. For example, tax expenditure for aviation fuel included in the Subsidy Report shows relatively constant revenue forgone figures over time, despite large oscillations of reported travel intensity and kerosene prices.
Reasons for incomplete and inconsistent reporting
Several factors contribute to the current state of tax expenditure reporting in Germany. To start, the Subsidy Report was not meant to be comprehensive. Based on the 1967 Act to Promote Economic Stability and Growth, it only covers those tax expenditures that aim at supporting enterprises or sectors of the economy, helping them to adjust to new conditions or promoting productivity and growth. Beyond that, what is typically left out of the report falls into three broad categories:
Tax expenditures under different labels: The Subsidy Report considers a provision to be a subsidy (or tax expenditure) only if the respective tax law explicitly designates it as such. For example, lower energy tax rates for diesel as opposed to gasoline are not considered a tax expenditure, even though neither the law nor scientific evidence provide justification for these rate differentials. Similarly, the flat-rate taxation of the use of company cars for private purposes is considered a tax expenditure by the UBA (to the extent that it does not fully capture the average income gain obtained by car users), but is considered a tax simplification measure by the BMF.
Tax expenditures from international agreements: In some cases, tax expenditures are not reported because they are based on international commitments rather than national policy decisions. This is the case for energy tax and VAT exemptions on aviation fuels for international flights, or VAT exemptions on exports. This exclusion from reporting is in line with the practice in many countries, as for example reduced withholding tax rates in tax treaties are typically included within the tax benchmark.
Expenditures from governmental fees: Exemptions from or reductions of certain government fees result in revenue forgone for the government but are not considered as tax expenditures. While in general fees are not taxes, some fees such as royalties for the extraction of sub-soil assets resemble taxes and are treated as tax revenue in some countries such as Chile and Norway. In Germany, waivers of royalties and other fees for the coal industry result in 287 million euros of revenue forgone in 2018.
Germany is not the only country that classifies certain provisions as tax expenditures and others as part of its normal (or benchmark) tax system. This is a common practice in all reporting countries and makes comparisons of tax expenditures across countries complicated (OECD 2020). However, an additional problem in Germany is the lack of a well-defined tax benchmark system, complicating the identification of tax expenditures and estimations of revenue foregone (Thoene, 2012; Thoene 2019). The criteria applied to decide whether or not a specific provision is considered a tax expenditure and included in the BMF subsidy report or whether it is part of the benchmark tax system are not straightforward. Lower VAT rates for food are part of Germany’s benchmark system and not reported, while lower VAT rates for cultural activities are defined as a tax expenditure. Grandfathering clauses (whereby older regulations are treated in one way and younger regulations in another) add another layer of complexity to the issue. Another example is the commuter’s tax allowance, which is considered a tax expenditure by the UBA, but part of the benchmark tax system (income-related expenses) by the BMF.
It should be noted that the Subsidy Report is a Federal Government document, meaning that it has to be approved unanimously by the cabinet of ministers. This helps to explain why changing the current state of official reporting has proven to be so difficult. In contrast, reports from bodies such as the UBA may have more leeway in defining what constitutes a subsidy or tax expenditure. The Federal Audit Office has repeatedly called for a comprehensive reform of tax expenditure reporting and evaluation in Germany, most recently in a report to the Budget Commission of the German Bundestag in May 2022.
It is time to improve tax expenditure reporting
As a first, necessary step towards a comprehensive spending review, which is one key recommendation of the 2023 OECD Economic Survey of Germany, Germany should bring its tax expenditure reporting up to date. Following the example of many other OECD member countries, tax expenditures should be reported annually and as part of the budget plan. Moreover, existing annual spending reviews could be expanded to include the evaluation of (specific) tax expenditures, which would generate more and better information regarding the impact of those measures.
This should go hand in hand with the establishment of a well-defined tax benchmark system, which would allow a more transparent definition of what constitutes a tax expenditure. All tax expenditures should be subject to regular impact evaluations. Moreover, extending the scope of reporting to also include related measures that are not considered tax expenditures would further raise transparency and follow best practices of countries such as Canada and the UK. A more comprehensive reporting of tax expenditures is key to increase transparency on the use of public resources and enable the parliament to better prioritize public spending.
Footnotes
Flurim Aliu (CEP) * Council on Economic Policies
Christian von Haldenwang (IDOS) *German Institute of Development and Sustainability
References
BMF (2019), 27. Subventionsbericht des Bundes, Bundesministerium der Finanzen (BMF).
Bundesrechnungshof (2022), Steuervergünstigungen nachhaltig reformieren, Bericht nach § 88 Absatz 2 BHO an den Rechnungsprüfungsausschuss des Haushaltsausschusses des Deutschen Bundestages.
Burger, A. and W. Bretschneider (2021), Umweltschaedliche Subventionen in Deutschland, Umweltbundesamt (UBA).
Fuest, C., J. Hey and C. Spengel (2021), “Vorschläge für eine Reform der Immobilienbesteuerung”, Ifo Schnelldienst, Vol. 74/12.
IMF and OECD (2020), Chile: Technical Assistance Report—Assessment of Tax Expenditures and Corrective Taxes, IMF Country Report No. 2020/305.
Thoene, Michael (2012), 18 billion at one blow: Evaluating Germany’s twenty biggest tax expenditures, FiFo Discussion Paper, No. 12-4.
Thoene, Michael (2019), Evaluierung von Steuervergünstigungen, FiFo‐Berichte Nr. 28‐0, Finanzwissenschaftliches Forschungsinstitut an der Universität zu Köln.
Mehr Transparenz bei Steuervergünstigungen in Deutschland
Autoren: Flurim Aliu (CEP)1, Robert Grundke (OECD), Christian von Haldenwang (IDOS)2
Deutschland begann bereits in den 1960er Jahren, regelmäßige Berichte über Steuervergünstigungen vorzulegen, und war damit einer der Vorreiter weltweit. Mittlerweile ist Deutschlands Berichterstattung über Steuervergünstigungen aber zu lückenhaft und inkohärent. Sie muss reformiert werden, damit Steuervergünstigungen transparenter werden und der Einsatz öffentlicher Mittel besser priorisiert werden kann.
Einleitung
Wie im OECD-Wirtschaftsbericht Deutschland 2023 (OECD, 2023) erörtert, sind erhebliche öffentliche Mittel notwendig, um den Investitionsstau in Deutschland abzubauen und den Investitionsbedarf für die ökologische und digitale Transformation zu decken. Gleichzeitig erfordert eine rapide alternde Bevölkerung höhere öffentliche Ausgaben für die Renten-, Gesundheits- und Pflegesysteme und verschärft den Arbeitskräftemangel. Wenn zur Steigerung des Arbeitsangebots zudem die Besteuerung von Erwerbseinkommen, insbesondere für Geringqualifizierte und Zweitverdienende, gesenkt wird, könnten sich die fiskalischen Spielräume weiter verringern. Um diese Herausforderungen zu meistern, ohne die Tragfähigkeit der öffentlichen Finanzen zu gefährden, muss die Ausgabeneffizienz des öffentlichen Sektors erhöht und die Ausgabenpriorisierung verbessert werden.
Voraussetzung hierfür ist eine transparente Erfassung der staatlichen Ausgaben. In Deutschland wird, wie auch in vielen anderen Ländern, der Verzicht auf öffentliche Einnahmen infolge von Steuervergünstigungen nicht so gut dokumentiert und kontrolliert wie die direkten Ausgaben. Unter Steuervergünstigungen werden Abweichungen von der Regelbesteuerung – auch als Referenz- oder Benchmark-System bezeichnet – verstanden. Sie begünstigen üblicherweise bestimmte Sektoren, Personengruppen oder Aktivitäten und werden von den Politikverantwortlichen für verschiedenste Zwecke genutzt, wie z. B. Investitions- und Beschäftigungsförderung oder Armutsbekämpfung.
Ebenso wie andere EU-Länder legt Deutschland in regelmäßigen Abständen Berichte über die vom Bund gewährten Subventionen und Steuervergünstigungen vor. Den offiziellen Zahlen zufolge ist der Umfang der Steuervergünstigungen in Deutschland über die Jahre erstaunlich konstant und beläuft sich laut Global Tax Expenditures Database (Redonda et al., 2023) seit 2014 im Durchschnitt auf 0,9 % des BIP. Zwar bestehen zwischen den Steuer-Benchmarks verschiedener Länder erhebliche Unterschiede, die sich auf die Schätzungen der Steuervergünstigungen auswirken, diesen Zahlen zufolge ist jedoch der Umfang der Steuervergünstigungen in Deutschland deutlich niedriger als in seinen Nachbarländern (z.B. Vereinigtes Königreich: 7,5 % des BIP, Tschechische Republik: 10,5 %) oder in vielen anderen OECD-Staaten (z. B. Vereinigte Staaten: 7,4 % des BIP, Australien: 8,4 %).
Das bedeutet aber nicht zwangsläufig, dass Deutschland bei der Nutzung von Steuervergünstigungen zurückhaltender ist als andere Länder. Vielmehr ist die Berichterstattung in Deutschland lückenhaft und inkonsistent. Die offiziellen Zahlen bieten keinen vollständigen Überblick über die tatsächlichen Steuervergünstigungen. Hauptgrund dafür ist, dass in Deutschland keine klar definierte Steuer-Benchmark angewendet wird und folglich keine transparente Übersicht über die Steuervergünstigungen zur Verfügung steht. Dadurch wird die Debatte über steuerpolitische Reformen erschwert. Weder die politischen Entscheidungsorgane – allen voran der Deutsche Bundestag – noch die Öffentlichkeit sind gegenwärtig in der Lage, den genauen Umfang der in Deutschland gewährten Steuervergünstigungen zu beurteilen oder eine fundierte Debatte über deren Zweckmäßigkeit für das Erreichen der öffentlichen Politikziele zu führen.
Gegenwärtiger Stand der Berichterstattung über Steuervergünstigungen in Deutschland
Seit 1967 veröffentlicht die Bundesregierung unter Federführung des Bundesministeriums der Finanzen (BMF) alle zwei Jahre einen Subventionsbericht, der Angaben zu direkten Finanzhilfen und Steuervergünstigungen enthält. Diese Berichte weisen jedoch erhebliche Schwächen auf.
Neben Informationen über Subventionen in Form von Finanzhilfen enthalten die Berichte Angaben zu 1. steuerlichen Sonderregelungen, die nach offizieller Lesart als Steuervergünstigungen gelten, sowie 2. anderen steuerlichen Sonderregelungen, die „subventionsähnliche Tatbestände“ darstellen, wie z. B. Einkommensteuerbefreiungen für Spenden an politische Parteien, Religionsgemeinschaften oder gemeinnützige Organisationen. Diese anderen steuerlichen Sonderregelungen sind in Anlage 3 des Berichts aufgeführt. Die Angaben zu ersteren werden in Datenblättern mit detaillierten Beschreibungen der entsprechenden Maßnahme, der dadurch entstehenden Steuermindereinnahmen sowie gegebenenfalls der neuesten Evaluierungsergebnisse präsentiert. Letztere hingegen werden nur unvollständig dokumentiert, nämlich in Form einer einzigen Übersichtstabelle, die – sofern verfügbar – Angaben zu den von den einzelnen Maßnahmen verursachten Steuermindereinnahmen enthält. Darüber hinaus finden sich im Subventionsbericht keine weiteren Informationen zu diesen Maßnahmen. Sie sind auch nicht Gegenstand regelmäßiger Evaluierungen.
Zudem lässt der Subventionsbericht viele Sonderregelungen außer Acht, wie eine Studie des Umweltbundesamtes (UBA) (Burger und Bretschneider, 2021) feststellt. So finden 21 der 35 in der UBA-Studie aufgeführten umweltschädlichen Steuerregelungen keinerlei Erwähnung im Subventionsbericht des BMF. Bei acht weiteren Regelungen weist der BMF-Bericht deutlich geringere Mindereinnahmen aus als die UBA-Studie oder er enthält für das betreffende Jahr überhaupt keine Angaben (Abb. 1). Lediglich bei fünf Maßnahmen stimmen die Zahlen des UBA und des BMF nahezu überein. Bei einer Maßnahme kalkuliert das BMF mit höheren Einnahmeausfällen als das UBA. Diese Abweichungen sind auf unterschiedliche Benchmark-Definitionen, Annahmen und Schätzmethoden zurückzuführen.
Abbildung 1. Regelungen, bei denen die geschätzten Mindereinnahmen im BMF-Subventionsbericht und in der UBA-Studie voneinander abweichen (2018, Mio. EUR)
Quelle: BMF (Hrsg.) (2019), 27. Subventionsbericht des Bundes, Bundesministerium der Finanzen, Berlin, https://www.bundesfinanzministerium.de/Content/DE/Standardartikel/Themen/Oeffentliche_Finanzen/Subventionspolitik/2020-03-01-Subventionsbericht.pdf. Burger, A. und W. Bretschneider (2021), Umweltschädliche Subventionen in Deutschland – Aktualisierte Ausgabe 2021, Texte, Nr. 143, Umweltbundesamt, Dessau-Roßlau, https://www.umweltbundesamt.de/sites/default/files/medien/479/publikationen/texte_143-2021_umweltschaedliche_subventionen.pdf.
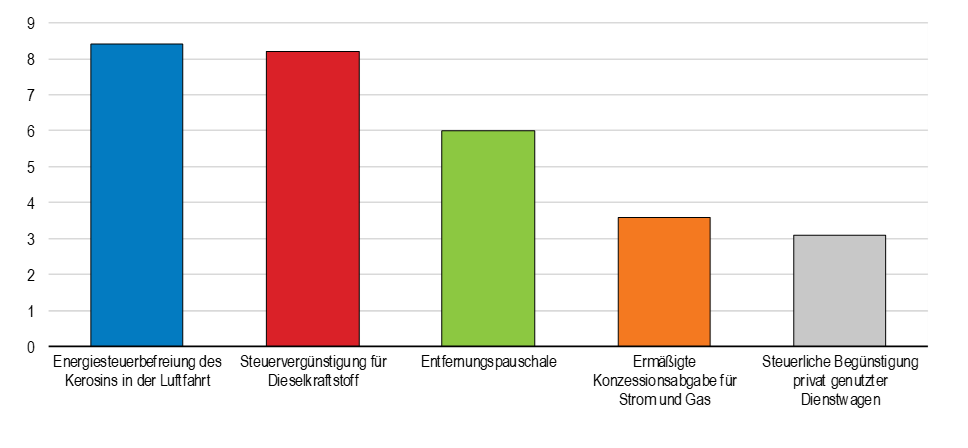
Daher fallen die Schätzungen des BMF und des UBA für den Gesamtumfang der durch Steuervergünstigungen verursachten Mindereinnahmen sehr unterschiedlich aus. Allein für die oben genannten 35 Maßnahmen veranschlagt das UBA Mindereinnahmen von 68,3 Mrd. EUR. Im BMF-Subventionsbericht hingegen werden die Einnahmeausfälle durch diese Instrumente nur auf 5,7 Mrd. EUR beziffert. Das BMF geht bei etwa der Hälfte der in beiden Berichten aufgeführten Maßnahmen von geringeren Steuereinbußen aus als das UBA. Der Großteil der Differenz zwischen den BMF- und UBA-Schätzungen der Mindereinnahmen ist jedoch auf Regelungen zurückzuführen, die im BMF-Subventionsbericht nicht berücksichtigt sind. Die Energiesteuerbefreiung von Kerosin beispielsweise schlägt laut UBA-Studie mit mehr als 8 Mrd. EUR zu Buche.
Abbildung 2. Wichtige Regelungen, die im BMF-Subventionsbericht fehlen, aber in der UBA-Studie erfasst sind (2018, in Mrd. EUR)
Daneben gibt es weitere steuerliche Sonderregelungen, die von keiner staatlichen Stelle erfasst werden. Prominente Beispiele sind zwei Arten von Steuervergünstigungen für Immobilien, die sich laut Schätzungen des ifo Instituts auf insgesamt 11 Mrd. EUR pro Jahr summieren (Fuest, Hey und Spengel, 2021). So sind Gewinne aus dem Verkauf von Immobilien komplett von der Einkommensteuer befreit, wenn die Immobilie mindestens zehn Jahre gehalten wurde; dies führt zu Einnahmeeinbußen von rd. 6 Mrd. EUR pro Jahr. Zudem sind die Gewinne von Immobilienunternehmen vollständig von der Gewerbesteuer befreit. Der Verzicht auf diese auf Gemeindeebene erhobene Steuer auf Unternehmensgewinne mit einem durchschnittlichen Satz von 15 % verursacht Einnahmeausfälle von rd. 5 Mrd. EUR.
Die mangelnde Vollständigkeit der berücksichtigten Regelungen ist nicht das einzige Problem des Subventionsberichts. Die meisten Länder mit einer entsprechenden Berichterstattung legen ihre Berichte jährlich vor. Der Subventionsbericht des BMF hingegen erscheint lediglich im Zweijahrestakt. Dies ist insofern problematisch, als Debatten über Steuervergünstigungen dadurch von anderen haushaltsbezogenen Debatten entkoppelt werden. Im jährlichen Haushaltsplan werden nur die Einnahmeausfälle durch die 20 größten Steuervergünstigungen gemäß BMF-Subventionsbericht berücksichtigt. Dem Bundestag wird dadurch nur ein unvollständiges Bild der insgesamt von der Bundesregierung gewährten Steuervergünstigungen vermittelt.
Zudem verzeichnet Deutschland weniger Fortschritte als andere Staaten bei der Schätzung der Einnahmeausfälle durch Steuervergünstigungen (bzw. „subventionsähnliche“ steuerliche Sonderregelungen). Seit den 1990er Jahren enthält der Subventionsbericht nur für etwa die Hälfte der aufgeführten Sonderregelungen Angaben zu den Mindereinnahmen. Zum Vergleich: In Kanada liegt dieser Anteil bei rd. 70 %, in Frankreich bei ungefähr 80 %. Ferner sind bei den in jeder Ausgabe des Subventionsberichts angegebenen Mindereinnahmen z. T. Inkonsistenzen in den Zeitreihen festzustellen. Die Mindereinnahmen aufgrund der Steuerbegünstigung von Kerosin beispielsweise sind laut Subventionsbericht im Zeitverlauf weitgehend konstant – trotz erheblicher Schwankungen beim Flugaufkommen und bei den Kerosinpreisen.
Gründe für die lückenhafte und inkohärente Berichterstattung
Der gegenwärtige Zustand der Berichterstattung über Steuervergünstigungen in Deutschland ist auf mehrere Faktoren zurückzuführen. Erstens ist der Subventionsbericht gar nicht für eine umfassende Darstellung aller Steuervergünstigungen konzipiert. Er konzentriert sich gemäß seinem gesetzlichen Auftrag laut Stabilitäts- und Wachstumsgesetz von 1967 auf Steuervergünstigungen, die private Betriebe oder Wirtschaftszweige begünstigen, um sie bei der Anpassung an neue Bedingungen zu unterstützen oder ihren Produktivitätsfortschritt und ihr Wachstum zu fördern. Die im Subventionsbericht nicht berücksichtigten Maßnahmen lassen sich im Wesentlichen in drei große Kategorien unterteilen:
Steuervergünstigungen unter anderem Namen: Der Subventionsbericht betrachtet eine Maßnahme nur dann als Subvention (oder Steuervergünstigung), wenn sie in der entsprechenden Steuergesetzgebung explizit als solche vorgesehen ist. So gelten beispielsweise die im Vergleich zu Benzin niedrigeren Energiesteuersätze für Diesel nicht als Steuervergünstigung, obwohl weder die Gesetzgebung noch wissenschaftliche Erkenntnisse eine Rechtfertigung für die unterschiedlichen Steuersätze liefern. Ähnlich verhält es sich mit der pauschalen Besteuerung privat genutzter Dienstwagen (dem sog. „Dienstwagenprivileg“): Diese Regelung wird vom UBA als Steuervergünstigung betrachtet, da der durchschnittliche geldwerte Vorteil der Dienstwagennutzer nicht in vollem Umfang der Besteuerung unterworfen wird, vom BMF dagegen als Maßnahme zur Steuervereinfachung.
Steuervergünstigungen aufgrund internationaler Übereinkommen: In einigen Fällen werden Steuervergünstigungen nicht ausgewiesen, weil sie nicht auf innerstaatlichen Politikentscheidungen, sondern auf internationalen Verpflichtungen beruhen. Dies trifft beispielsweise auf die Energie- und Mehrwertsteuerbefreiung für Kerosin im internationalen Luftverkehr oder auf Umsatzsteuerbefreiungen für Exporte zu. Die Nichtberücksichtigung solcher Steuervergünstigungen in der Berichterstattung deckt sich mit der gängigen Praxis vieler anderer Länder, da beispielsweise ermäßigte Quellensteuersätze aufgrund von bilateralen Steuerabkommen häufig als Bestandteil der steuerlichen Benchmark angesehen werden.
Vergünstigungen bei staatlichen Entgelten: Befreiungen von oder Ermäßigungen bei bestimmten staatlichen Entgelten verursachen zwar Einnahmeausfälle für den Staat, werden aber nicht als Steuervergünstigungen betrachtet. Obwohl es sich bei Entgelten im Allgemeinen nicht um Steuern handelt, haben einige Entgelte wie z. B. Lizenzgebühren für den Abbau von Bodenschätzen („Royalties“) steuerähnlichen Charakter und werden in einigen Ländern, etwa in Chile und Norwegen, als Steuereinnahmen behandelt. In Deutschland entstanden 2018 durch den Verzicht auf die Erhebung von Förderabgaben und anderen Entgelten von der Kohleindustrie Mindereinnahmen von 287 Mio. EUR.
Deutschland ist nicht das einzige Land, das bestimmte steuerliche Regelungen als Steuervergünstigungen und andere als Teil des regulären Steuersystems (d. h. der steuerlichen Benchmark) betrachtet. Diese Praxis ist in allen Ländern verbreitet, die über Steuervergünstigungen berichten, und erschwert den länderübergreifenden Vergleich von Steuervergünstigungen (IWF und OECD, 2020). In Deutschland besteht jedoch ein zusätzliches Problem darin, dass es keine klar definierte Steuer-Benchmark gibt. Dadurch ist es schwieriger, Steuervergünstigungen zu identifizieren und Mindereinnahmen zu schätzen (Thöne, 2012; 2019). Die Entscheidungskriterien dafür, ob eine bestimmte Regelung als Steuervergünstigung betrachtet und ausgewiesen wird oder ob sie Bestandteil der steuerlichen Benchmark ist, sind nicht immer eindeutig. So wird etwa der ermäßigte Umsatzsteuersatz für Nahrungsmittel als Teil der Regelbesteuerung angesehen und nicht im Subventionsbericht erfasst, während der ermäßigte Umsatzsteuersatz für kulturelle Leistungen als Steuervergünstigung gilt. Weiter verkompliziert wird die Lage durch Bestandsschutzklauseln, die eine abweichende Anwendung von älteren und neueren Regelungen bewirken. Ein anderes Beispiel ist die Entfernungspauschale, die vom UBA als Steuervergünstigung, vom BMF dagegen als Teil des Benchmark-Steuersystems (einkommensbezogene Aufwendung) betrachtet wird.
Ferner ist zu bedenken, dass es sich beim Subventionsbericht um einen Bericht der Bundesregierung handelt, der einstimmig vom Kabinett verabschiedet werden muss. Dies erklärt z. T., warum sich Veränderungen an der gegenwärtigen Form der offiziellen Berichterstattung so schwierig gestalten. In Studien von nachgeordneten Behörden wie dem UBA dürften größere Entscheidungsspielräume bestehen, wenn es darum geht, was als Subvention oder Steuervergünstigung zu betrachten ist. Der Bundesrechnungshof hat wiederholt eine umfassende Reform der Berichterstattung und Evaluierung von Steuervergünstigungen in Deutschland gefordert, zuletzt in einem Bericht an den Haushaltsausschuss des Deutschen Bundestags im Mai 2022 (Bundesrechnungshof, 2022).
Es ist an der Zeit, die Berichterstattung über Steuervergünstigungen zu verbessern
Als ersten notwendigen Schritt hin zu umfassenden Spending Reviews – eine der zentralen Empfehlungen im OECD-Wirtschaftsbericht Deutschland 2023 (OECD, 2023) – sollte Deutschland seine Berichterstattung über Steuervergünstigungen auf den neuesten Stand bringen. Dabei sollte Deutschland dem Vorbild vieler anderer OECD-Länder folgen und seine Steuervergünstigungen jährlich und im Rahmen des Haushaltsplans ausweisen. Außerdem könnten die bestehenden jährlichen Spending Reviews um Evaluierungen von (bestimmten) Steuervergünstigungen erweitert werden, um mehr und bessere Informationen über die Wirksamkeit dieser Maßnahmen zu erhalten.
Dies sollte mit der Festlegung eines klar definierten Benchmark-Steuersystems einhergehen. Dadurch ließe sich eindeutiger abgrenzen, welche Maßnahmen Steuervergünstigungen darstellen. Die Wirksamkeit aller Steuervergünstigungen sollte regelmäßig evaluiert werden. Außerdem würde eine Ausweitung der Berichterstattung auf verwandte Maßnahmen, die nicht als Steuervergünstigungen gelten, die Transparenz weiter verbessern und internationalen Best Practices aus Ländern wie Kanada und dem Vereinigten Königreich folgen. Eine umfassendere Berichterstattung über Steuervergünstigungen ist entscheidend, um mehr Transparenz über den Einsatz öffentlicher Mittel zu erhalten und dem Bundestag eine bessere Priorisierung der öffentlichen Ausgaben zu ermöglichen.
Redonda, A., C. von Haldenwang und F. Aliu, (2023). „Global Tax Expenditures Database (GTED)“, Datensatz-Version 1.1.5, https://doi.org/10.5281/zenodo.782579.
Labour-saving innovation alone is unlikely to reduce overall labour demand. To lift supply, childcare, immigration, and adult training need an overhaul.
By Daniela Glocker and Nicolas Gonne, OECD Economics Department
The Netherlands has a very strong labour market. The employment rate is one of the highest in the OECD, while unemployment is low. Workers are paid well on average and experience significantly less job strain than in many other OECD countries. This contributes to making the Netherlands a country with a high reported life satisfaction.
But the Dutch labour market is also very tight. Job openings are plenty and available workers are scarce (Figure 1). Pervasive labour shortages across occupations and regions prevent businesses from operating at their desired production level. Shortages are reported in many OECD countries, reflecting the unprecedented speed of the post-pandemic recovery. However, labour market tightness is structural in the Netherlands: the number of people available for work, either unemployed or inactive, has declined steadily in recent years.
Figure 1. Dutch labour market tightness predates the pandemic
Labour market tightness vacancies per 100 unemployed
Note: OECD (resp. EA17) average based on 23 (resp. 17) countries for which data are available. Source: OECD Labour Market Statistics (database); Eurostat Job Vacancy Statistics.
Lifting labour supply to tackle tightness is urgent in the Netherlands: not only do enduring shortages generate wage inflation, but they also hold back the green and digital transitions, weighing on potential growth. In complement to raising productivity, the latest Economic Survey of the Netherlands identifies areas for policy reform that together have the potential to increase labour supply.
Strengthening incentives to work full time
More than a third of employees work fewer than 30 hours per week in the Netherlands, by far the highest incidence of part-time work in the OECD, with a particularly unequal distribution between genders. The system of taxes and benefits implicitly promotes the “one-and-a-half earner model” (Figure 2, Left), whereby one partner (often a man) works full-time and the second earner (often a woman) works relatively few hours. Expensive or unavailable childcare weighs on incentives to work more (Figure 2, Right), as looking after a child is the main reason for part-time employment in the Netherlands.
Figure 2. Stronger incentives on moving to full-time employment and more affordable childcare would increase labour supply
Note: LHS refers to second earners with two children. (more details). Source: OECD Benefits, Taxes and Wages (database); OECD Social and Welfare Statistics (database).
Reducing work disincentives arising from childcare, school hours, and leave arrangements is a necessary complement to the steady reduction in the effective tax rate on moving to full-time employment. The planned reform to make childcare free for all working parents is expected to worsen staff shortages in childcare facilities, raising doubts about feasibility. Phasing in the reform gradually, monitoring access and evaluating the repeal of the link between hours worked and the amount of the childcare support would help.
Realising the potential of migration
While labour market participation overall is high, the gap between the native-born and the foreign-born is the largest in the OECD (Figure 3), especially for migrants from outside of the European Union. Most highly educated foreign-born work in jobs that require a lower level of formal education than what they hold or are not in employment. Moreover, the immigration system is not responsive to labour market needs, and no migration scheme exists for medium-skill workers, despite their importance for the green transition.
Figure 3. Better migrant integration could attenuate labour shortages in some occupations
Source: OECD Migration Statistics (database).
Streamlining and accelerating the processes of recognition and validation of qualifications acquired abroad for shortage skills would improve employment outcomes for underemployed groups and partially address labour shortages. Repealing labour market tests, whereby employers are required to search for applicants from the Netherlands or other EU countries before turning to non-EU migrants, would increase supply for the middle-skill segment of the labour market and for occupations related to the low-carbon transition.
Promoting a culture of lifelong learning
Training needs are important in the Netherlands, given the massive number of new jobs that will be necessary for the low-carbon transition and the continued digitalisation of the economy. Yet, the country only allocates a relatively little share of active labour market policy spending to training (Figure 3). In a first approximation, a threefold increase in public spending on training is necessary to achieve the required reskilling and upskilling. Moreover, concerns have surfaced regarding the quality and relevance of some trainings subsidised under the recently discontinued individual learning scheme STAP.
Figure 4. Higher spending on quality public training would promote growth in expanding industries
Source: OECD Statistics on Labour Market Programmes (database).
Major scaling-up and stronger incentives for co-financing by employers are needed to deliver on the stated objective of promoting a new culture of lifelong learning. Focusing expenditure on adult learning related to occupations where shortages are the most pressing would reduce the overall fiscal cost and better channel labour towards the tightest segments of the labour market. More emphasis should be placed on ensuring that providers maintain training quality, including renewing providers’ accreditation regularly, assessing the outcomes of education activities, and ensuring that the ensuing information is transparent and publicly available.
References
Borowiecki M., J. Pareliussen and D. Glocker (2021), “Chasing the frontier: Digitalisation for stronger productivity in the Netherlands”, OECD Economics Department Working Papers, No. 1680, OECD Publishing, Paris, https://doi.org/10.1787/e800ee1d-en
Abendschein M., O. Causa, N. Luu, E. Soldani and C. Soriolo (2022), “The post-COVID-19 rise in labour shortages”, OECD Economics Department Working Papers, No. 1721, OECD Publishing, Paris, https://doi.org/10.1787/e60c2d1c-en.
Gonne N. (2023), “Lifting labour supply to tackle tightness in the Netherlands”, OECD Economics Department Working Papers, OECD Publishing, Paris, forthcoming.
Corporate taxation can support business investment, but details of the tax system matter
Business investment has been weak in OECD countries since the global financial crisis (GFC). What can be done to boost it?
One potential lever is to modify corporate taxation to reduce the cost of capital, which is usually considered as a key investment determinant (Feld and Heckemeyer, 2011[3]; Vartia, 2008[4]; Schwellnus and Arnold, 2008[5]). However, as can be seen in the figure below, while the cost of capital has steadily fallen, reflecting the secular decline in global interest rates and cuts in statutory corporate tax rates (STR), business investment rates have not increased and real investment has barely caught up with its pre-GFC trend. These observations suggest that either the sensitivity of firms’ investment to the cost of capital has declined, or the desired level of investment for a given cost of capital has fallen because of other factors. In turn, they raise questions about whether and which changes to corporate tax systems can stimulate business investment.
Note: Panel A: Investment intensity is computed as the ratio of gross fixed capital formation over gross value‑added in business sectors (Sectors B through N according to the ISIC Rev.4 classification, excluding Real Estate). Panel B: The cost of capital corresponds to the rate of return on a marginal investment required for an investor to break even after tax. It is computed based on the formula from Hanappi (2018[4]), the fiscal parameters from Spengel et al. (2020[5]), long-term sovereign interest rates and changes in the GDP deflator as a proxy for inflation. Trends and changes in the cost of capital, but not levels, are robust to replacing sovereign bond yields with a stable premium for corporations. In both panels, the shaded area corresponds to the interquartile range across OECD countries. Source: Hanappi, Millot and Turban (2023), “How does corporate taxation affect business investment? Evidence from aggregate and firm-level data”, OECD Economics Department Working Papers, No. 1765, OECD Publishing, Paris.
Aggregate trends hide heterogeneity in investment responses to taxation. Indeed recent analysis has shown that the sensitivity of firm investment to corporate taxation tends to be heterogeneous across different types of firms (Federici and Parisi, 2015[6]; Zwick and Mahon, 2017[7]; Fuest, Peichl and Siegloch, 2018[8]; Kopp et al., 2019[9]; Millot et al., 2020[10]). As such, a more nuanced assessment of the implications of corporate taxation on investment and growth is needed.
Our new paper (Hanappi, Millot and Turban, 2023) aims to fill this need.We bring together country-industry and firm-level data on investment, as well as detailed data on the cost of capital and its tax component, to analyse how the tax sensitivity of investment has evolved over time and how it differs across firm and investment characteristics. Finally, we also disentangle key parameters of the corporate tax system to analyse the potential impacts of different tax designs.
The tax sensitivity of investment has weakened since the GFC and varies across firms and tax parameters
Our estimations at the industry and the firm level confirm previous findings that business investment tends to respond negatively to increases in corporate taxation as measured by forward-looking effective tax rates (ETRs) (see Hanappi (2018[4]) for details on the methodology to construct those ETRs). However, the analysis shows that the tax sensitivity of investment fell after the GFC, suggesting that lower ETRs increase investment less now than they did in the past.
We also find that firms that are large, are part of multinational groups, have a large proportion of intangibles in their total fixed assets, or are highly profitable, have all become less sensitive to taxation compared to other firms after the GFC. The fact that these firms have become less sensitive could largely explain the aggregate trends, as investment tends to be highly concentrated among a small number of big firms, usually belonging to multinational groups.
Finally, our paper highlights significant heterogeneity in investment responses to different corporate taxation parameters. Increases in effective taxation delivered through non-profit taxes (i.e. business taxes levied on bases other than corporate income, such as real estate or corporate wealth) have a stronger negative impact on business investment than corporate income taxes (CIT). As for the CIT, “equivalent” changes (i.e., those resulting in the same effective marginal tax rate) in the STR and in capital allowances are associated with different investment responses, depending on the initial level of STR and allowances.
What are the implications for corporate tax policy?
Corporate taxation can support business investment, but the bang for the buck may have fallen, and details of the tax system matter. The results from the empirical analysis call for a more nuanced and granular approach to corporate tax policy. Beyond headline statutory tax rates, a variety of measures can be considered to support investment effectively, accounting for heterogeneity in tax sensitivity.
Potential policy options include:
Eliminating or reducing non-profit taxes on domestic and international businesses, which are likely to generate larger adverse effects on investment than taxes on profits.
Limiting cuts in the headline corporate income STR; which can be relatively costly compared with other corporate tax policies, as they lower the effective tax rates for all firms regardless of their tax sensitivity.
Considering the use of targeted CIT instruments to support specific investments, provided that a coherent policy rationale and a strong institutional framework exist. Differences in effective tax rates across assets and firms can be justified when there are positive externalities. However, decisions to implement targeted measures should also account for the costs of the induced distortions, potentially increased compliance costs and administrative burdens for taxpayers and tax authorities.
Making use of more generous capital allowances to reduce ETRs where they are expected to induce strong investment responses. Higher STRs, combined with more generous capital allowances, are likely to be less distortive as the CIT would be largely levied on economic rents. Moreover, such policies would likely be less affected by the Global Minimum Tax under the Global Anti-Base Erosion (GloBE) Rules due to the exclusion of a fraction of the value of assets and payroll from the base of the minimum tax.
Read more on the new paper: How does corporate taxation affect business investment? Evidence from aggregate and firm-level data in the direct link here.
References
Federici, D. and V. Parisi (2015), “Do corporate taxes reduce investments? Evidence from Italian firm-level panel data”, Cogent Economics & Finance, Vol. 3, https://doi.org/10.1080/23322039.2015.1012435.
Fuest, C., A. Peichl and S. Siegloch (2018), “Do Higher Corporate Taxes Reduce Wages? Micro Evidence from Germany”, American Economic Review, Vol. 108/2, pp. 393-418, https://doi.org/10.1257/aer.20130570.
[8]
Hanappi, T. (2018), “Corporate Effective Tax Rates: Model Description and Results from 36 OECD and Non-OECD Countries”, OECD Taxation Working Papers, No. 38, OECD Publishing, Paris, https://doi.org/10.1787/a07f9958-en.
Millot, V. et al. (2020), “Corporate taxation and investment of multinational firms: Evidence from firm-level data”, OECD Taxation Working Papers, No. 51, OECD Publishing, Paris, https://doi.org/10.1787/9c6f9f2e-en.
[10]
Schwellnus, C. and J. Arnold (2008), “Do Corporate Taxes Reduce Productivity and Investment at the Firm Level?: Cross-Country Evidence from the Amadeus Dataset”, OECD Economics Department Working Papers, No. 641, OECD Publishing, Paris, https://dx.doi.org/10.1787/236246774048.
Vartia, L. (2008), “How do Taxes Affect Investment and Productivity?: An Industry-Level Analysis of OECD Countries”, OECD Economics Department Working Papers, No. 656, OECD Publishing, Paris, https://dx.doi.org/10.1787/230022721067.
[2]
Zwick, E. and J. Mahon (2017), “Tax policy and heterogeneous investment behavior”, American Economic Review, Vol. 107/1, pp. 217-248, https://doi.org/10.1257/aer.20140855.
[7]
Property taxes in Central and Eastern Europe and Baltic countries: why and how to increase them?
Category: Tax
written by oecdecoscope | September 16, 2025
By Hansjoerg Blöchliger and Mame Fatou Diagne, OECD Economics Department
Taxes on immovable property or real estate taxes are underutilised across Central and Eastern European (CEE) countries and the Baltics, but reform in this area faces steep challenges. Recent health and energy crises have put public finances under strain in many countries, and long-term challenges such as rapid population ageing require them to look for fiscal policy reform. Strengthening real estate taxation can contribute to maintaining fiscal sustainability, as recommended in several recent OECD Economic Surveys for CEE and Baltic countries (see references below).
Property tax revenues: a trickle in Central and Eastern Europe
Revenues from taxes on immovable property are low in most CEE countries. While Poland collects more property tax revenues (slightly above 1% of GDP) than the average OECD country, other CEE countries collect considerably less (Figure 1). Most countries in the region have failed to benefit from the steep rise in property values over the past ten years or so, relying instead heavily on labour taxes, which are more harmful to growth, or consumption taxes, which tend to be regressive. Some other countries in the OECD also collect little property tax revenue, but they either implement wealth taxes including on immovable property (e.g. Switzerland), or they tax the imputed rent of the main residence as part of the income tax (e.g. Denmark, Greece, or the Netherlands).
Figure 1. Revenues from immovable property taxation are low in CEE countries and the Baltics
Revenue from recurrent taxes on immovable property, % of GDP, 2020 or latest available year
Source: OECD Revenue Statistics database.
Immovable property taxes can help raise revenue with lower losses to economic growth than alternative taxes. In the Czech Republic or Estonia for example, a rise in immovable property taxation to reach the OECD average and a concomitant reduction of labour taxes could help lift potential GDP per capita growth by up to 0.7% (Oguzhan, Cournède and Fournier, 2017). Immovable property taxes can help cushion housing boom-and-bust cycles and can be designed to reduce inequality. They can also help fund local governments and contain urban sprawl. The risk of tax competition eating up tax revenues is low because property taxes are capitalised in property prices: the lower the tax, the higher property prices and vice versa, largely sterilising relocation effects, as is the case in the USA.
Local governments could be the main beneficiaries of more buoyant tax revenues, strengthening their capacity to spend on local infrastructure. More own-source revenues would also reduce pressure on central governments or EU programmes to fund local investment. Local governments should exploit the new tax room granted to them. In Hungary, currently a quarter of municipalities only levies a property tax. In Latvia, some municipalities set very low tax rates in a bid to attract high-income earners.
Design failures and data limitations reduce the potential of the property tax, however. Most CEE countries hardly update property (or cadastral) values. Moreover, owner-occupied housing is often fully or partly exempt, further cutting revenues. Unlike most OECD countries, Poland, the Czech Republic and the Slovak Republic apply area-based rather than value-based indicators to assess the value of land and buildings, thereby underestimating property values especially in urban areas and making the property tax regressive. A land tax as in Estonia would be the most effective property tax because it encourages housing construction and discourages land hoarding. Yet revenues from the Estonian land tax remain very low as land values are outdated and tax rates low. In Lithuania, property taxation is sometimes seen as a “luxury tax”, with minimum thresholds so high that few properties are taxed.
Property tax reform is challenging
Navigating property tax reform through the political process is difficult. A saying goes that the property tax is loved by economists and hated by everybody else. Homeowners dislike property tax reform, especially in a context of rising house prices and, therefore, rising tax bills. Property taxes are also unpopular as they are salient and raise issues of fairness, including in comparison to the taxation of other forms of wealth, such as financial assets.
While in many countries in the OECD housing wealth is concentrated among high-income, high-wealth and older households, it is more broadly distributed in CEE countries. Homeownership rates are very high, exceeding 90% in Slovakia, Lithuania, and Hungary (Figure 2), considerably higher than in most Western European countries or the United States. Incomes of many property owners are low, limiting their capacity to pay higher property taxes. Furthermore, house price rises in CEE countries have exceeded the OECD average over the past decade, especially in the Baltics. Adequate valuation could hence mean a steep rise in the tax bill for almost everyone, especially as houses and apartments were often acquired very cheaply during the privatisations in the 1990s.
Figure 2. Homeownership is high in Central and Eastern Europe
Share of owner-occupied housing, % of total housing, 2020 or latest available year
Source: OECD Affordable Housing database.
Making property tax reform happen
To buoy property tax revenues, CEE countries should tax all immovable property including owner-occupied residential property, as recommended in various OECD Economic Surveys. Local governments should be encouraged to make use of their taxing power, including through reforms to intergovernmental fiscal relations that would raise incentives to collect their own resources. Increasing property tax revenues would also require strengthening information systems to update land and property values regularly. Such upgrades should be supported at the central or regional level of government. Digitalisation of cadastral information could help to keep abreast with developments on property markets.
Some design options could help address political deadlocks and garner support for property tax reform. The most important is a gradual phasing-in, to help avoid an abrupt hike in tax bills that would hurt homeowners. Tax deferrals – i.e. tax is paid only when a house is sold or bequeathed, as is done in Canada, Denmark, Ireland or the United States – can reduce pressure on liquidity-constrained households, although deferrals could raise issues of intergenerational fairness. Furthermore, progressive taxation, either directly by setting progressive tax rates or indirectly by granting tax allowances, can protect low-income households and thereby bolster acceptability of increased property taxation. Lastly, comprehensive reform packages, such as lowering more harmful taxes (for example transaction taxes); improving local public services; or funding social housing programmes, may also foster much-needed political support.
Comprehensive property tax reform can be successful: In 2017, Denmark adopted a major property tax reform, which entailed a reassessment of properties’ fair market values, while tax rates were lowered. Tax payments can be deferred until a house is sold, alleviating liquidity constraints. Ireland designed property tax reform in a similar way in 2013, fostering political support especially by allowing households to defer tax payments.
Blöchliger, H. (2015): “Reforming the Tax on Immovable Property”, OECD Economics Department Working Paper 1205.
Cournède, B., J. Fournier, and P. Hoeller (2018), “Public finance structure and inclusive growth”, OECD Economic Policy Papers, No. 25.
OECD (2022), Housing Taxation in OECD Countries.
OECD (2020), Raising Local Public Investment in Lithuania.
Oguzhan A., B. Cournède and J-M. Fournier (2017): “The effect of the tax mix on inequality and growth”, OECD Economics Department Working Paper 1447.
The Mirrlees Review (2011), Tax by Design, Institute of Fiscal Studies.
Tax challenges from digitalisation: A global two-pillar solution could increase tax revenues and support economic activity
Category: Digitalisation,Tax,Uncategorized
written by oecdecoscope | September 16, 2025
ByDavid Bradbury, Tibor Hanappi, Pierce O’Reilly, Ana Cinta González Cabral (OECD Centre for Tax Policy and Administration), Åsa Johansson, Stéphane Sorbe, Valentine Millot, Sébastien Turban (OECD Economics Department)
The international corporate tax system faces growing challenges. While the OECD/G20 Base Erosion and Profit Shifting (BEPS) project represented an unprecedented multilateral effort to tackle profit shifting, many questions over the allocation of taxing rights remain unresolved. Digitalisation and globalisation have highlighted certain vulnerabilities in the existing framework, which allocates taxing rights principally on the basis of physical presence. In addition to this, some BEPS issues remain. In this context, an increasing number of jurisdictions are taking uncoordinated and unilateral actions (e.g. digital services taxes), contributing to an increase in tax and trade disputes and growing tax uncertainty.
The COVID-19 crisis is exacerbating these tensions by accelerating the digitalisation of the economy and increasing pressures on public finances. The fact that many firms have benefitted from direct or indirect government support during the crisis is also likely to intensify public dissatisfaction with tax avoidance by multinational enterprises (MNEs).
Towards a global two-pillar solution
Against this backdrop, the OECD/G20 Inclusive Framework on BEPS (Inclusive Framework), which brings together 137 member jurisdictions, is discussing proposals for a consensus-based reform of the international tax rules to address the tax challenges arising from the digitalisation of the economy. The proposals fall under two pillars, which are described in the Pillar One and Pillar Two Blueprint reports released last week (OECD, 2020a; OECD, 2020b). In their latest communiqué, G20 Finance Ministers confirmed that they remain committed to further progress on both pillars and urged the Inclusive Framework to address the remaining issues with a view to reaching a global and consensus-based solution by mid-2021 (G20, 2020).
Pillar One seeks to adapt the international corporate tax system to the digital age through significant changes to the rules applicable to business profits to ensure that the allocation of taxing rights on business profits is no longer exclusively determined by reference to physical presence.
Pillar Two aims to address remaining BEPS challenges and is designed to ensure that large internationally operating businesses pay a minimum level of tax regardless of where they are headquartered or the jurisdictions they operate in.
This blog post summarises the main findings of the Economic Impact Assessment of the proposals carried out by the OECD Secretariat (OECD, 2020c). This is an ‘ex ante’ assessment, which relies on a number of illustrative assumptions on proposal design and parameters, without prejudice to the final decisions of the Inclusive Framework.
The proposals would increase global tax revenues
Pillar One and Pillar Two could increase global corporate income tax (CIT) revenues by about USD 50-80 billion per year. Taking into account the combined effect of these reforms and the US GILTI regime, the total effect could represent USD 60-100 billion per year or up to around 4% of global CIT revenues.
Pillar One would involve a significant change to the way taxing rights are allocated among jurisdictions, as taxing rights on about USD 100 billion of profit could be reallocated to market jurisdictions. This would lead to a modest increase in global tax revenues. On average, low, middle and high income economies would all benefit from revenue gains, while ‘investment hubs’ would tend to lose tax revenues.
Pillar Two would yield a significant increase in CIT revenues and significantly reduce the incentives for MNEs to shift profits to low-tax jurisdictions, which would generate revenue gains in addition to the direct gains resulting from the implementation of the new rules.
The combined revenue gains from the two pillars are estimated to be broadly similar – as a share of current CIT revenues – across low, middle and high income jurisdictions (Figure 1).
A consensus-based solution would support investment and economic growth
A consensus-based multilateral solution involving Pillar One and Pillar Two would lead to a more favourable environment for investment and growth than would likely be the case in absence of an agreement by the Inclusive Framework:
The two pillars would lead to a relatively small increase in the average (post-tax) investment costs of MNEs (Hanappi and González Cabral, 2020). The ensuing negative effect on global investment is estimated to be very small, as the proposals would mostly affect highly profitable MNEs whose investment is less sensitive to taxes (Millot et al., 2020). Overall, the negative effect on global GDP stemming from the expected increase in tax revenues associated with the proposals is estimated to be less than 0.1% in the long term.
In contrast, the absence of a consensus-based solution would likely lead to a proliferation of uncoordinated and unilateral tax measures (e.g. digital services taxes) and an increase in damaging tax and trade disputes. This would undermine tax certainty and investment and also result in additional compliance and administration costs. The magnitude of the negative consequences would depend on the extent, design and scope of these unilateral measures, and the scale of any ensuing trade retaliation. In the “worst-case” scenario, these disputes could reduce global GDP by more than 1% (Figure 2).
The COVID-19 crisis has increased the need for reform
The full impact of the COVID-19 crisis remains highly uncertain at this stage, but a few likely implications for the impact assessment of Pillar One and Pillar Two already stand out:
The COVID-19 crisis is likely to reduce the expected revenue gains from the proposals at least in the short run as the crisis weighs on the profitability of many MNEs, even though some digital-intensive MNEs have managed to sustain or enhance their profitability since the beginning of the crisis.
The crisis has accelerated the digitalisation of the economy, increasing the need to address the tax challenges arising from digitalisation.
Hanappi, T. and A. González Cabral (2020), “The impact of the pillar one and pillar two proposals on MNE’s investment costs : An analysis using forward-looking effective tax rates”, OECD Taxation Working Papers, No. 50, OECD Publishing, Paris, https://dx.doi.org/10.1787/b0876dcf-en.
Millot, V. et al. (2020), “Corporate Taxation and Investment of Multinational Firms: Evidence from Firm-Level Data”, OECD Taxation Working Papers, No. 51, OECD Publishing, Paris, https://dx.doi.org/10.1787/9c6f9f2e-en.
OECD (2020a), Tax Challenges Arising from Digitalisation – Report on Pillar One Blueprint: Inclusive Framework on BEPS, OECD/G20 Base Erosion and Profit Shifting Project, OECD Publishing, Paris, https://dx.doi.org/10.1787/beba0634-en.
OECD (2020b), Tax Challenges Arising from Digitalisation – Report on Pillar Two Blueprint: Inclusive Framework on BEPS, OECD/G20 Base Erosion and Profit Shifting Project, OECD Publishing, Paris, https://dx.doi.org/10.1787/abb4c3d1-en.
OECD (2020c), Tax Challenges Arising from Digitalisation – Economic Impact Assessment: Inclusive Framework on BEPS, OECD/G20 Base Erosion and Profit Shifting Project, OECD Publishing, Paris, https://dx.doi.org/10.1787/0e3cc2d4-en.