A policy framework for reviving productivity growth

By Christophe André, Peter Gal and Álvaro Pereira

It is well known that productivity ultimately drives living standards. In the long run, all that matters is productivity. However, productivity growth has been on a declining trend across the OECD for decades (Fernald, Inklaar and Ruzic, 2024; Goldin et al, 2024). Labour productivity – measured by GDP per hours worked or per employee – has been slowing from nearly 2% annual growth to around 0.8% per year over the last decade. This slowdown was driven by lower trend multi-factor productivity growth and, since the global financial crisis, weaker capital accumulation (Figure 1). In a new paper (André and Gal, 2024), we provide an update on the existing macro- and firm-level evidence and on the role of public policies.[1]  

Figure 1. MFP and capital accumulation have both contributed to the slowdown in trend per capita potential growth

Decomposition of OECD potential GDP per capita growth (annual change, in %)

Note: All variables are smoothed except capital stock per worker. For more details, see the source.
Source: André and Gal (2024) based on the OECD Economic Outlook 113 Database.

The long-term declining productivity growth trend since the 1970’s was interrupted by a roughly decade-long rebound starting in the mid-90s, associated with the diffusion of information and telecommunication technologies (ICTs) in the United States and other countries. Looking at the micro level, firms at the technological frontier have continued to perform more strongly than other firms since the 2000s (Andrews, Criscuolo and Gal, 2016), but the rate of frontier growth also seems to have slowed in the past decade or so. High uncertainty, financial disturbances, low investment, and weak business dynamism may have all played a role in slowing OECD productivity growth to historical lows.

As OECD economies face structural headwinds, including ageing, diminishing gains from education and high debt levels, a productivity revival appears more necessary than ever. But can it be achieved? A debate has been going on for over a decade on the ability of new technologies to boost productivity, with sceptics such as Gordon (2016) considering that recent inventions are unlikely to foster the same kind of growth as did electricity and the internal combustion engine, against those who believe that digital technologies can boost productivity, provided the right complementary investments are in place (e.g., Brynjolfsson, Rock and Syverson, 2021; Mokyr, 2013). In particular, recent OECD research shows that Artificial Intelligence will provide a significant boost to productivity (e.g. Filippucci et al., 2024; Filippucci, Gal and Schief, 2024).

Indeed, productivity is not only about technology. OECD research has shown that the broader economic environment is key for promoting innovation, diffusion and turning it into productivity benefits (OECD, 2015). Our paper builds on that framework by exploring how incentives and capabilities affect firms at the technology frontier and below, as well as the reallocation of resources across the economy (Table 1).

Table 1. The scope of policies to raise productivity through shaping incentives and capabilities: A stylised framework
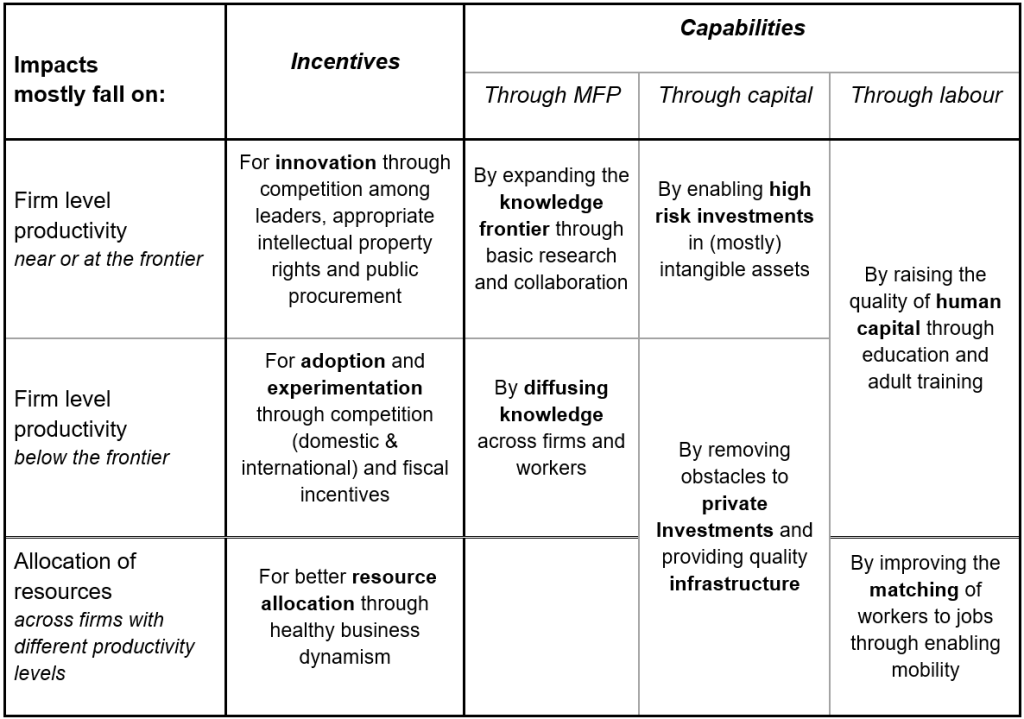
Note: MFP stands for multifactor productivity. See more details in the source.
Sources: André and Gal (2024), building on and extending OECD (2015).

Competition is key among incentives: it encourages firms at the technological frontier to innovate and other companies to adopt modern technologies and business practices. Therefore, the rising market concentration in the United States and to a lesser extent in Europe, along with rising markups and the long-term decline in business dynamism is worrying.[2] Moreover, the fragmentation of international trade, due to geopolitical tensions and other barriers, is eroding the productivity benefits from global competition, and also holds back knowledge spillovers across borders in value chains. Regulatory and trade policies should aim to revert or mitigate these tendencies.

Innovation can also be incentivised through intellectual property regimes provided they strike the right balance between protecting innovation and preserving market competition. Fiscal incentives and public procurement also matter, and can be used in a directed way to serve other policy goals such as greening the economy.

The allocation of resources (such as labour and capital) across firms also plays a key role for aggregate productivity. Flexible labour markets, well designed active labour market policies, and better access to housing are essential for labour reallocation, but can be hampered by excessive use of non-compete and non-poaching clauses as well as burdensome licensing procedures. Efficient insolvency regimes can promote entrepreneurship, by lowering the cost of failure, and facilitate corporate restructuring and the reallocation of resources towards more productive uses.

Crucially, providing the right incentives needs to be complemented with measures to improve capabilities along various dimensions. First, promoting basic research is key to advance the knowledge frontier. Second, good quality infrastructure and other measures for domestic and international integration help creating innovation networks to diffuse knowledge. Third, attracting venture capital and measures addressing the difficulties of financing intangibles could allow start-ups to flourish. Finally, human capital can be developed through higher quality education systems, promoting and enabling lifelong learning, spreading good management practices and fostering a better use of skills through matching of workers to jobs.

In sum, while the impact of new technology on economic growth remains highly uncertain, governments should pull all the available policy levers to strengthen incentives and build capabilities to ensure their economic benefits are maximised and contribute to a revival of productivity growth, and hence boosting living standards.

References

Andre, C. and P. Gal (2024), “Reviving productivity growth: A review of policies”, OECD Economic Policy Papers, No. 1822, https://www.oecd.org/en/publications/reviving-productivity-growth_61244acd-en.html.

Andrews, D., C. Criscuolo and P. Gal (2016), “The Best versus the Rest: The Global Productivity Slowdown, Divergence across Firms and the Role of Public Policy”, OECD Productivity Working Papers, No. 5., https://www.oecd.org/en/publications/the-best-versus-the-rest_63629cc9-en.html.

Brynjolfsson, E., D. Rock and C. Syverson (2021), “The Productivity J-Curve: How Intangibles Complement General Purpose Technologies”, American Economic Journal: Macroeconomics, Vol. 13/1, pp. 333-372, https://doi.org/10.1257/mac.20180386.

Fernald, J., Inklaar, R. and Ruzic, D. (2024), The Productivity Slowdown in Advanced Economies: Common Shocks or Common Trends?. Review of Income and Wealth. https://doi.org/10.1111/roiw.12690.

Filippucci, F., et al. (2024), “The impact of Artificial Intelligence on productivity, distribution and growth: Key mechanisms, initial evidence and policy challenges”, OECD Artificial Intelligence Papers, No. 15, OECD Publishing, Paris, https://www.oecd.org/en/publications/the-impact-of-artificial-intelligence-on-productivity-distribution-and-growth_8d900037-en.html.

Filippucci, F., P. Gal and M. Schief (2024), “Miracle or Myth: Assessing the macroeconomic productivity gains from Artificial Intelligence”, OECD, forthcoming.

Goldin, I., P. Koutroumpis, F. Lafond, and J. Winkler (2024), “Why Is Productivity Slowing Down?” Journal of Economic Literature, 62 (1): 196-268, https://doi.org/10.1257/jel.20221543.Mokyr, J. (2013), Is technological progress a thing of the past?, https://cepr.org/voxeu/columns/technological-progress-thing-past.

Gordon, R. (2016), “Perspectives on “The Rise and Fall of American Growth””, American Economic Review, Vol. 106/5, pp. 72-76, https://doi.org/10.1257/aer.p20161126.

OECD (2015), The Future of Productivity, OECD Publishing, Paris, https://www.oecd.org/en/publications/the-future-of-productivity_9789264248533-en.html.

OECD/APO (2022), Identifying the Main Drivers of Productivity Growth: A Literature Review, OECD Publishing, Paris, https://www.oecd.org/en/publications/2022/11/identifying-the-main-drivers-of-productivity-growth_4268ebf8.html.


[1] For a recent complementary overview of the literature on the structural drivers of productivity with a stronger focus on measurement, see OECD/APO, 2022.

[2] Even though a resurgence in US business creations since the COVID-19 pandemic offers a glimmer of hope.



Unlocking Colombia’s Potential: The Imperative of Boosting Investment

Cover photo for the Economic Survey of Colombia 2024

by Paula Garda and Michael Koelle, OECD Economics Department

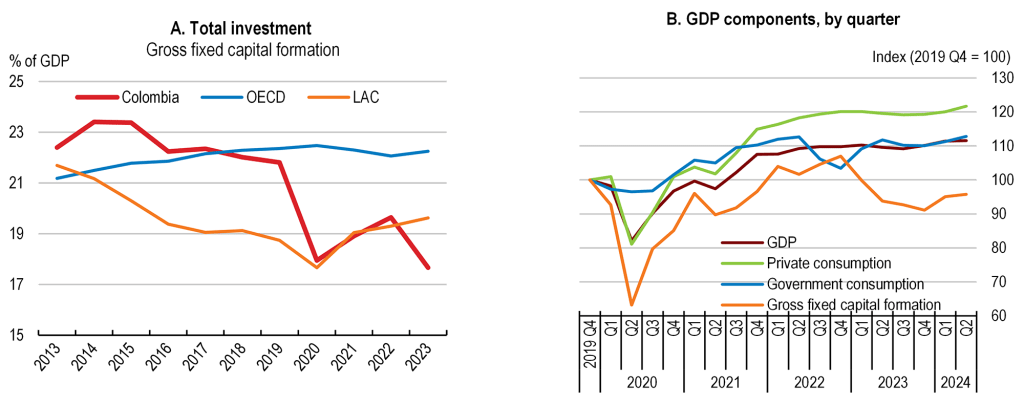
Investment fuels the engine of economic prosperity. It drives productivity, fosters innovation, and generates formal job opportunities, all of which are essential for improving living standards. In Colombia, the total investment rate has dropped since the end of the commodity boom from 23% in 2015 to 18% in 2023, now ranking among the lowest among OECD countries (Figure, panel A), according to the 2024 Colombia Economic Survey. This low investment rate hinders Colombia’s potential growth, estimated at below 3%, and is particularly troubling as the country faces urgent needs in infrastructure, education, innovation, peacebuilding efforts, social development, and transitioning to a green economy.

The weakness in investment is also a slowing down Colombia’s current GDP growth rate (Figure, panel B). Colombia experienced one of the strongest recoveries among OECD countries from the COVID-19 pandemic, but its consumption-led growth decelerated sharply in 2023 due to tight macroeconomic policies, slowing global growth, and rising borrowing costs. Although economic activity including investment began recovering in 2024, the investment rate remains low. Several factors contribute to the investment weakness, including high credit costs, low business confidence, and uncertainty.

Figure. Weak investment is dragging down growth

Figures A and B for the economic Survey of Colombia
Source: OECD calculations based on the OECD Economic Outlook (database).

The government has an ambitious reform agenda to raise living standards and social justice through economic diversification, an energy transition, and fostering regional convergence, but all this requires higher investment. Improving infrastructure, innovation, education, public services and formal job opportunities are needed not only to reduce entrenched inequalities, especially in remote and marginalized regions, but also to boost long-term growth. Colombia’s natural resources and biodiversity offer unique opportunities to attract green investments. Given Colombia’s limited fiscal space, attracting private investment is crucial for stepping up investment.

To reverse the downward trend in investment, and achieve stronger, resilient, and inclusive growth, the 2024 Colombia OECD Economic Survey suggests policy action in several areas:

  1. Maintaining a strong macroeconomic framework. This includes continuing fiscal consolidation and complying with the fiscal rule to support public debt sustainability and foster a business-friendly environment. Monetary authorities should also maintain a prudent, data-based, easing cycle of monetary policy mindful of inflationary risks, to bring inflation to target, which will gradually reduce borrowing costs.
  2. Implementing a comprehensive tax reform: High corporate tax burden and the uncertainty generated by frequent piecemeal tax reforms have been a deterrent to private investment. Colombia needs a comprehensive and gradually implemented tax reform to create the fiscal space for social and productive investments. Lowering the corporate tax rate while expanding the base of personal income taxes, reducing unnecessary tax expenditures in corporate, personal and consumption taxes, and tackling tax evasion would enhance revenue collection while promoting a business-friendly environment. Raising spending efficiency is also crucial.
  3. Lowering barriers to private investment: The recent record-high Foreign Direct Investment (FDI) influx of USD 17 billion in 2023 is a positive sign, but more needs to be done to sustain this momentum, capitalise on nearshoring trends and encourage domestic investment. The government should accelerate the implementation of public-private partnerships, particularly the new generation of infrastructure projects, ensure access to affordable credit, particularly for SMEs, and foster a more stable and predictable policy environment. Expanding the coverage of the simplified tax and insolvency regimes and online one-stop shops to more micro and small firms would significantly reduce regulatory compliance costs. Additionally, increasing investment in science, technology, and innovation is crucial for diversifying the economy and attracting higher value-added investments.
  4. Strengthening subnational government fiscal and administrative capacities and improving intergovernmental coordination are necessary to ensure the successful implementation of public investment projects and regional convergence.
  5. Reducing informality: High business and labour informality leads to low savings rates and inefficient capital allocation which have been major barriers to investment in Colombia. The government should implement a comprehensive agenda of reforms to reduce informality by lowering the costs formal firm creation, enhancing skills, strengthening the enforcement of labour and tax laws, and lowering social security contributions for lower-income workers. This, in turn, will enhance social protection coverage, improve tax collection, and boost inclusive growth. Improving education outcomes at all levels and aligning them with labour market needs would support creating formal job opportunities and attracting investment.

Boosting investment is not just a short-term priority for Colombia—it is fundamental for achieving sustainable economic growth and social development, unlock the country’s potential and laying the foundation for a more prosperous and equitable future.

References

OECD (2024). OECD Economic Survey of Colombia, OECD Publishing, Paris.  


Productivity and inequality – a nexus for policymakers to tackle

By Emilia Soldani

Over recent decades many advanced and emerging economies witnessed a slowdown in productivity growth, with weaker technology diffusion and a decline in business dynamism  (Andre and Gal, 2024, forthcoming).  This was accompanied by persistent and pervasive inequalities in economic outcomes and opportunities. A new report by the OECD Economics Department (link) explains why the two challenges should be considered and tackled together (Soldani et al., 2024).

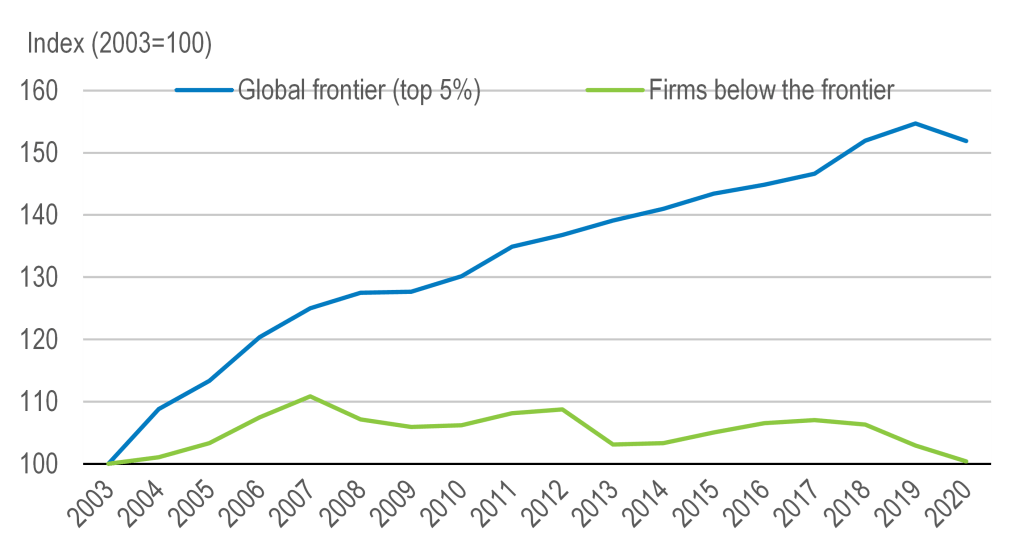
The slowdown in productivity growth  (Figure 1), which at first affected advanced economies and more recently also emerging G20 economies, is associated with increasing gaps between firms at the global productivity frontier and laggard firms across and within countries, even within the same industry (Criscuolo et al., 2021; Andrews, Criscuolo and Gal, 2016).

Figure 1. The slowdown in productivity growth and catch-up

Panel A. Labour productivity average yearly growth rate, %

Panel B – The divergence in productivity dynamics across firms

Notes: In panel A, Real GDP refers to the PPP population-weighted average. Advanced economies include Australia, Canada, Germany, France, UK, Italy, Japan, Korea and the US, and emerging-market economies include Brazil, Indonesia, Türkiye and South Africa. In Panel B, the index (2003 = 100) is approximated by changes in logs. The “Global frontier” is defined as the average productivity of the top 5% firms in the global productivity distribution within each detailed industry (2-digit, NACE Rev.2). “Firms below the frontier” is the average productivity of all other firms within the industry. The chart shows the mean three-year moving average across industries, covering 24 OECD countries. Labour productivity is defined as value added per employee. More details are given in the source paper.
Source: For Panel A, OECD Economics Department Working Paper number 1819. For Panel B, Andre and Gal  (2024, forthcoming) based on the updated calculations described in Andrews, Criscuolo and Gal (2016) using the Orbis firm-level financial account database (2022 vintage).

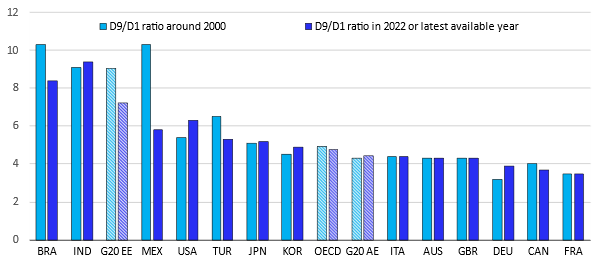
Meanwhile, while income inequality has decreased across countries (Lakner and Milanovic, 2015), it remains generally high within countries, especially in emerging economies. Across G20 economies with available data, the income ratio between the richest and poorest 10% of the population is still about significantly larger for emerging economies than advanced ones (Figure 2).

Figure 2. The income gap between the top and bottom deciles of the population remains high in emerging G20 economies

Note: The D9/D1 ratio is defined on household equivalised disposable income and refers to the total population. Note that the comparison of data over time is subject to methodological limitations  (OECD, n.d.[58]). Data around 2000 refers to 2006 for Brazil and Korea; 2004 for India and Türkiye; and 2000 for the other countries. Latest data available refers to 2011 for India; 2018 for Japan; 2020 for Australia and Germany; 2021 for Italy, the UK, Canada, France, Japan, and Türkiye; 2022 for the USA, Mexico, Korea and Brazil.
Source: OECD Income Distribution Database, data extracted in July 2024.

The situation deteriorated further because of the COVID-19 pandemic (Mahler, Yonzan and Lakner, 2022; OECD, 2024), which also highlighted the extent of inequalities in other dimensions: access to quality education, health care, savings and social protection. Such inequality of opportunities negatively affect the allocation of talents and social mobility, potentially further dragging down productivity growth.

The OECD report (link) summarises the empirical evidence and lessons on the policy levers available to accelerate productivity growth and make it more inclusive, drawing from a vast array of OECD studies and academic research. The main conclusion is that productivity and inequality challenges should not be looked at in separation, due to many links between the two, in either direction. For example, higher productivity and economic growth can boost aggregate savings, investment, and the accumulation of human and physical capital, which affect economic wellbeing, poverty, social mobility, and inequality. At the same time, these factors also affect occupational choices, political demand for fiscal redistribution, and social and political conflict, all of which may affect economic growth (Barro, 2000).  Intertwined links amid ongoing structural changes such as the  decline in labour force due to demographics, environmental disruptions, and high levels of public and private debt, suggest the importance for policy levers to target both inequality reduction and productivity enhancement.  

Based on the review of extensive research outputs, three main spheres of action to support inclusive growth emerge:

  • The development of skills and the efficient matching of workers to firms can be supported by policies to improve access to quality education and upskilling at every age and to reduce labour market insecurity and informality.
  • Policies to curb market power in labour and product markets: these may lead to double dividends by improving job quality and workers wellbeing, while also boosting growth-enhancing business dynamism.
  • Enhancing the effectiveness, progressivity and equity of taxes and transfer systems. International cooperation, for instance in trade and taxation, should reinforce and support the efforts made at the national level.

The importance of business dynamism to boost productivity is best understood when noting that the productivity gap between laggard firms and those at the productivity frontier, which explains a considerable portion of the productivity growth slow-down, is higher in economic sectors characterised by stark barriers to business entry and dynamism and by higher market concentration (Calvino, Criscuolo and Verlhac, 2020). This suggests that policies supporting business dynamism may accelerate the diffusion of frontier technologies and management practices and promote aggregate productivity growth.

The need for policies to curb employers’ labour market power and reduce informality is apparent in light of the widespread decoupling between the growth of labour productivity and wages. Indeed, the growth of average and median wages over recent decades has been limited. Over the same period wage dispersion has increased as wages have grown relatively more at the top of the income distribution (Schwellnus, Kappeler and Pionnier, 2017), despite some signs of a partial reversal in wage inequality through 2022 and 2023. Here, too, policies to support education and upskilling may help reduce wage dispersion while also enhancing productivity growth (OECD, 2021; OECD, 2020), including by ensuring that the workforce has the right skill sets to face the ongoing transitions (OECD, 2022; Causa et al., 2022).

In the context of education policies, the latest OECD PISA scores highlight the need to improve inclusiveness and effectiveness. Average students’ performance starkly deteriorated between 2018 and 2022, and the gaps in scores along the socioeconomic dimension increased, with disadvantaged students falling further behind.

While the task may seem daunting, the stakes in reducing inequality and promoting inclusive growth exceed purely economic considerations: the combination of slow growth, persistent inequalities, especially in economic opportunities, may further erode social cohesion and the support for democratic institutions (Rodrik, 2017; Guriev and Papaioannou, 2022; Rodrik, 2021) and spark support for protectionist measures and hostile sentiments against international trade (Millot and Rawdanowicz, 2024; Criscuolo et al., 2022).

References

Andre, C. and P. Gal (2024, forthcoming), Reviving productivity growth: A review of policies.

Andrews, D., C. Criscuolo and P. Gal (2016), “The Best versus the Rest: The Global Productivity Slowdown, Divergence across Firms and the Role of Public Policy”, OECD Productivity Working Papers, No. 5, OECD Publishing, Paris, https://doi.org/10.1787/63629cc9-en.

Calvino, F., C. Criscuolo and R. Verlhac (2020), “Declining business dynamism: Structural and policy determinants”, OECD Science, Technology and Industry Policy Papers, No. 94, OECD Publishing, Paris, https://doi.org/10.1787/77b92072-en.

Causa, O. et al. (2022), “The post-COVID-19 rise in labour shortages”, OECD Economics Department Working Papers, No. 1721, OECD Publishing, Paris, https://doi.org/10.1787/e60c2d1c-en.

Criscuolo, C. et al. (2021), “The human side of productivity: Uncovering the role of skills and diversity for firm productivity”, OECD Productivity Working Papers, No. 29, OECD Publishing, Paris, https://doi.org/10.1787/5f391ba9-en.

Criscuolo, C. et al. (2022), “Are industrial policy instruments effective?: A review of the evidence in OECD countries”, OECD Science, Technology and Industry Policy Papers, No. 128, OECD Publishing, Paris, https://doi.org/10.1787/57b3dae2-en.

Guriev, S. and E. Papaioannou (2022), “The Political Economy of Populism”, Journal of Economic Literature, Vol. 60/3, pp. 753-832, https://doi.org/10.1257/jel.20201595.

Lakner, C. and B. Milanovic (2015), “Global Income Distribution: From the Fall of the Berlin Wall to the Great Recession”, The World Bank Economic Review, Vol. 30/2, pp. 203-232, https://doi.org/10.1093/wber/lhv039.

Mahler, D., N. Yonzan and C. Lakner (2022), The Impact of COVID-19 on Global Inequality and Poverty, The World Bank, https://doi.org/10.1596/1813-9450-10198.

Millot, V. and Ł. Rawdanowicz (2024), The return of industrial policies: Policy considerations in the current context, https://doi.org/10.1787/051ce36d-en.

OECD (2024), Annex A. Meeting of the Members of the Council on the 2030 Agenda for Sustainable Development – Background and draft Agenda, https://one.oecd.org/document/C(2024)9/REV1/en/pdf.

OECD (2022), OECD Employment Outlook 2022: Building Back More Inclusive Labour Markets, OECD Publishing, Paris, https://doi.org/10.1787/1bb305a6-en.

OECD (2021), The Role of Firms in Wage Inequality: Policy Lessons from a Large Scale Cross-Country Study, OECD Publishing, Paris, https://doi.org/10.1787/7d9b2208-en.

OECD (2020), Competition in Labour Markets, OECD, https://web-archive.oecd.org/2020-03-10/546723-competition-in-labour-markets-2020.pdf.

OECD (n.d.), OECD Income (IDD) and Wealth (WDD) Distribution Databases, https://www.oecd.org/social/income-distribution-database.htm.

Rodrik, D. (2021), “Why Does Globalization Fuel Populism? Economics, Culture, and the Rise of Right-Wing Populism”, Annual Review of Economics, Vol. 13/1, pp. 133-170, https://doi.org/10.1146/annurev-economics-070220-032416.

Rodrik, D. (2017), Populism and the Economics of Globalization, National Bureau of Economic Research, Cambridge, MA, https://doi.org/10.3386/w23559.

Schwellnus, C., A. Kappeler and P. Pionnier (2017), “Decoupling of wages from productivity: Macro-level facts”, OECD Economics Department Working Papers, No. 1373, OECD Publishing, Paris, https://doi.org/10.1787/d4764493-en.


Building on recent reform progress In Brazil

By Falilou Fall, Priscillia Fialho, and Jens Arnold, OECD Economic Department

Brazil’s economy has recovered strongly from the consecutive shocks of the last years says the latest OECD Economic Survey of Brazil. This year, buoyed by good weather and a record-high harvest, the economy is expected to grow at 3%, which is far above its long-term growth trend over the last decade. Unemployment is at its lowest level since 2015, while inflation has returned to the central bank’s target after having risen to almost 12% in mid-2022. Even if in the next years growth will fall short of the exceptional performance of 2023, the current OECD projections of 1.8% in 2024 and 2.0% in 2025 are strong in historical comparison, and are largely driven by expanding domestic demand.

The time has now come to re-focus on the pressing structural challenges that Brazil is facing. These include limited fiscal capacity that hampers necessary investments, weak productivity performance, and the need to end deforestation in the Amazon, after visible increases during 2018-2022.

Building fiscal space will help to focus on policy priorities

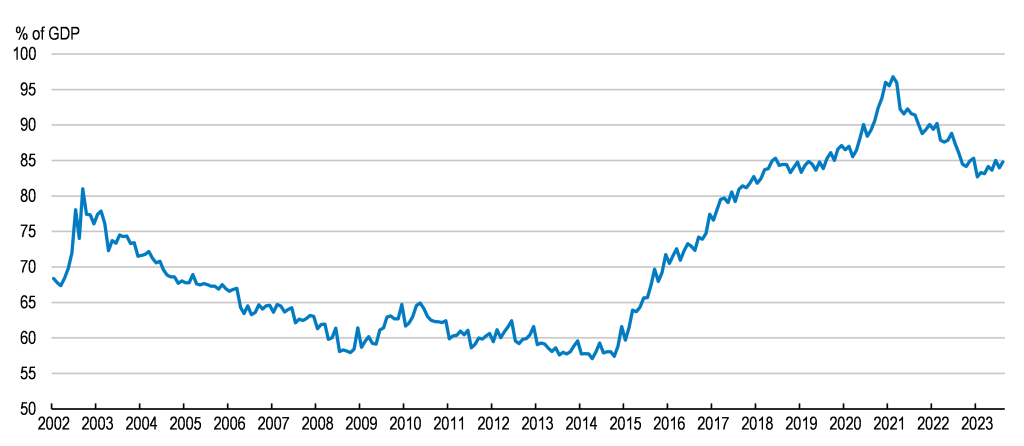
With gross public debt exceeding 80% of GDP (Figure 1), rebuilding fiscal buffers is important to ensure that the public sector can undertake the necessary investments in education, social protection and infrastructure in the future. This will require credible deficit targets that guide fiscal policy over the next years. A recently legislated new fiscal framework is expected to become an essential tool in this context, as it combines a clear path for fiscal outcomes with safeguards for public investment, which has all too often fallen victim to fiscal adjustments in the past.

Figure 1. Rebuilding fiscal space is important
Evolution of public debt

Source: CEIC; Central Bank of Brazil.

Making the most out of scarce fiscal space will also require more agile budgeting processes. These are currently characterised by widespread revenue earmarking and mandatory spending floors that commit 91% of the budget. This limits the government’s ability to address priority policy challenges.

Further important fiscal reforms are either ongoing or planned. A fundamental overhaul of Brazil’s notoriously complex system of consumption taxes has just been approved by Congress. Moving from a fragmented system of consumption taxes towards a unified value-added tax system will make tax compliance much easier for firms and reduce a number of tax-induced distortions that hold back growth. Beyond consumption taxes, there is scope to reform personal income taxes, including with a view towards making them more progressive.

Raising productivity and growth inclusiveness

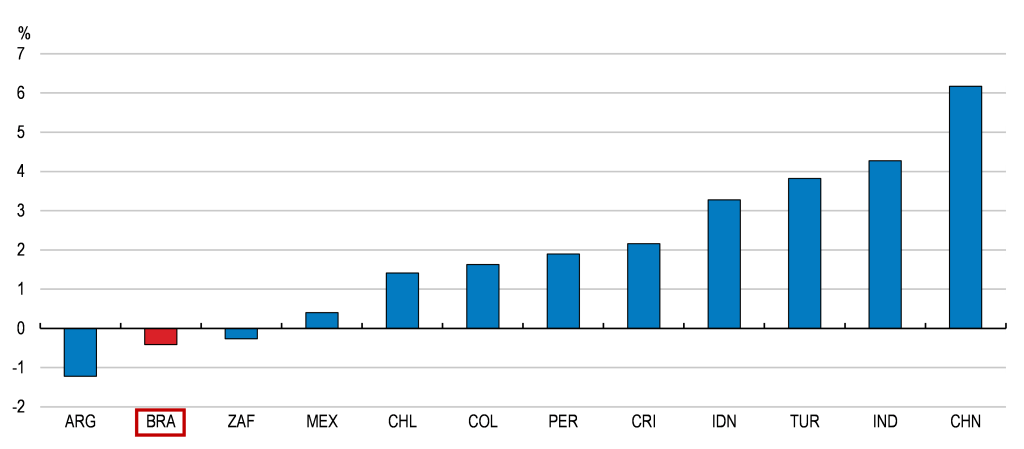
Productivity has been on a declining trend since 2010, and compared to other emerging market economies, Brazil’s per capita growth has been substantially weaker (Figure 2). This is particularly worrying in light of rapid population ageing. A young population has underpinned economic growth in the past, as more and more people were joining the labour force. Over the next 25 years, however, population ageing  is expected to reverse the entire growth dividend that Brazil has reaped from more favourable demographics since the turn of the millenium.

Figure 2. Weak productivity performance and infrastructure competitiveness are impeding stronger growth
Average annual GDP per capita growth, 2012-2021

Source: World Bank; and OECD calculations.

Years of insufficient infrastructure investment have given rise to logistics bottlenecks and high transportation costs, which are one factor behind Brazil’s weak productivity performance. But scarce resources are not the only challenge. Improvements in planning and project execution could substantially improve the performance of many infrastructure projects. As a result of challenges in project management, public infrastructure investment has delivered results that have often fallen short of expectations. 

Competition, another key driver of productivity growth, has been held back by complex regulations and administrative burdens, some of which shield incumbent firms from potential new market entrants. Recent regulatory reforms have led to improvements in this area, but market entry barriers in services sectors remain above the OECD average. Further regulatory reforms in professional services, including the abolition of exclusive rights for certain ancillary tasks, can stimulate competition in crucial markets. Manufactured goods remain subject to elevated trade barriers, with average import tariffs approximately eight times higher than in Mexico. Lowering these trade barriers can facilitate access to foreign markets and foster a deeper integration into global value chains.

Mobilising currently underutilised labour resources and improving education outcomes is equally essential for sustaining stronger long-term economic growth. Womens’ labour force participation and employment rates lag approximately 20 percentage points behind those of men. The pandemic has exacerbated educational disparities by leaving a stronger mark on children from disadvantaged backgrounds. Prioritising investments in the early years of schooling and expanding access to early childhood education, especially for children from disadvantaged backgrounds, have the potential to reduce gender inequality and equip children with better opportunities later in life.

Making growth more sustainable

Deforestation, the largest contributor to greenhouse gas emissions, has increased since 2018, but policy priorities have changed and early indicators now suggest a decline in 2023. Strengthening enforcement of the Forest Code, coupled with allocating more resources to enforcement agencies, will aid in tackling deforestation. Emissions from agriculture, the second-largest source of greenhouse gas emissions, primarily arise from livestock (Figure 3). Better regulations and stronger incentives for more sustainable production hold significant potential for reducing these emissions. Energy emissions are already fairly low given the significant share of hydroelectric energy sources, but also solar and wind energy, where Brazil’s still untapped potential could turn into a major competitive advantage in the future. The planned introduction of carbon pricing mechanisms will be a milestone in the transition towards a lower-carbon economy.

Figure 3. Deforestation and agriculture are the main sources of greenhouse gas emissions
Million tonnes of CO2 equivalent, 2021 or latest

Source: OECD environment database; Estimativas Anuais de Emissões de Gases de Efeito Estuda no Brasil (6ª Edição), Ministério da Ciência, Tecnologia e Inovação; and OECD calculations.

References

OECD (2023), OECD Economic Surveys: Brazil 2023, OECD Publishing, Paris, https://doi.org/10.1787/a2d6acac-en


Institutional shareholding, common ownership and productivity: a cross-country analysis

By Maria Bas1, Lilas Demmou, Guido Franco and Javier Garcia-Bernardo2

The increase in institutional ownership, accompanied by the shift towards passive portfolio management and the rise of common ownership, have transformed OECD countries financial markets in the last decades. These transformations have the potential to influence listed firms’ productivity, given the role of equity owners in allocating private savings across firms and influencing firms’ investment decisions.

Against this backdrop, and relying on a rich firm-level dataset covering financial and granular ownership information on firms across a wide range of countries and sectors, Bas et al. (2023) study the productivity consequences of these changes via two main channels: a “governance channel”, looking at the role of institutional owners’ business model (i.e., investment style, time horizon etc.); and a “common ownership” channel, analysing the productivity impact of simultaneous ownership of shares in competing firms (i.e. intra-industry) or potentially vertically integrated firms (i.e. inter-industry).

The governance channel

The business model of institutional owners has recently been the subject of debate in two main areas. First, institutional investors tend to have higher portfolio turnover rates than corporate owners, potentially inducing a focus on short-term outcomes, while long-term-oriented owners are more likely to support innovative and human capital-intensive projects that yield (productivity) benefits over time. Second, institutional investors increasingly rely on passive investment styles, characterized by reduced monitoring but also increased diversification, which can encourage support for R&D activities by attenuating idiosyncratic risks associated with innovation.

Our main findings suggest, overall, a positive relationship through the governance channel: firms displaying higher institutional ownership tend to have higher productivity levels and growth rates compared to their peers (Figure 1). Consistent with theory, there is some heterogeneity across different types of institutional investors depending on their time horizon and investment style. On the one hand, the positive correlation tends to vanish when institutional investors’ horizon shortens, highlighting the relevance of the provision of patient capital (Figure 1). On the other hand, the correlation appears larger the higher the shares of large, passive and diversified owners, confirming that a diversified portfolio may favour support to innovative investments despite potential lower monitoring.

Figure 1 Institutional ownership and productivity are positively related at the firm-level

Note: Interpreting results as if they were causal, the blue bars represent the average change in firms’ productivity following a 5 p.p. increase in institutional ownership. The orange whiskers indicate the 95% confidence intervals. Source: Bas, Demmou, Franco and Garcia-Bernardo (2023).

The common ownership channel

The consequences of common ownership for firms’ productivity may vary depending on whether it occurs within industries or across industries.

Intra-industry common ownership. Firms operating in the same industry and belonging to the same investor’s portfolio may, in the interest of their common shareholders, compete less intensively on product markets, for instance by colluding more easily, with detrimental consequences for productivity (competition channel). At the same time, intra-industry common ownership could benefit innovation and productivity when inter-firm coordination is explicit (e.g. joint ventures or strategic alliances) and firms find it easier to cooperate in their R&D efforts and share knowledge (cooperation channel). The estimates from the analysis linking intra-sector common ownership and productivity are not always significant (Figure 2, left panel). Still a negative relationship appears to prevail when they are, hinting that the competition channel may slightly outweigh the cooperation channel. The negative association is stronger in innovative sectors, further corroborating the potential existence of a competition channel given that these industries tend to be more concentrated.

Inter-industry common ownership. Common ownership along the value chain may lead to stronger business relationships among vertically integrated firms, (vertical integration / spillover channel), by attenuating hold-up problems when information asymmetries are high. Moreover, from a general equilibrium perspective, the attempt to increase profits through higher prices and lower competition is not immune to a backlash for common owners, as they risk ending up with lower profits in downstream industries due to higher inputs costs. The empirical investigation supports the existence of a positive relationship between inter-industry common ownership and firm-level productivity (Figure 2, right panel). The positive association is again stronger for firms producing in innovative sectors, potentially due to a more efficient network of vertical relationships and technological spillovers, which are particularly relevant in these sectors.

Figure 2 The productivity implications of common ownership depend on whether it occurs intra- or inter-industry

Note: Interpreting results as if they were causal, the blue bars represent the average change in firms’ productivity following an increase in inter (left panel) or intra (right panel) industry common ownership from 0 to the level observed at the 75th percentile of the distribution of the respective firm level common ownership measure. The orange whiskers indicate the 95% confidence intervals. Common ownership is measured as in Azar et al. (2018) and Azar et al. (2021). Source: Bas, Demmou, Franco and Garcia-Bernardo (2023).

References

Azar, J., M. C. Schmalz and I. Tecu, (2018), “Anticompetitive effects of common ownership”, The Journal of Finance, Vol. 73(4): 1513–1565. https://doi.org/10.1111/jofi.12698.

Azar, J., and X. Vives, (2021), “Revisiting the anticompetitive effects of common ownership”, IESE Business School Working Paper. https://dx.doi.org/10.2139/ssrn.3805047.

Bas, M., Demmou, L., Franco, G., Garcia-Bernardo, J. (2023), “Institutional shareholding, common ownership and productivity: A cross-country analysis”, OECD Economics Department Working Paper No 1767, https://doi.org/10.1787/d398e5b4-en.


Promoting stronger and more sustainable growth for all people across Spain

También disponible en español

By Bertrand Pluyaud and Adolfo Rodríguez-Vargas, OECD Economics Department

Before the COVID-19 pandemic, the Spanish economy experienced a period of sustained and more balanced economic growth, less dependent on the construction sector, and with a healthier financial system. The pandemic and Russia’s war of aggression against Ukraine were successive shocks that required strong government support to protect businesses and households, as noted in the 2023 Economic Survey of Spain. Output has recovered to its pre-pandemic level, and growth has held up well since the second half of 2022 and it is expected to remain solid in 2024.

The recovery from the pandemic has been steady following the large fall of GDP in 2020

Gross Domestic Product, Volume, base 2019Q4 = 100


Made with Flourish

Spain has also introduced several major reforms to address longstanding labour market issues, promote business growth and innovation, ensure pensions’ sustainability, and boost vocational education. However, structural weaknesses remain that weigh down Spain’s growth potential. The 2023 Economic Survey discusses policy options to tackle these issues in four areas.

Addressing fiscal challenges

Government action was decisive for the recovery, but it was costly. Public debt, which was already high before the pandemic, has increased by 13 percent points of GDP since 2019.  Sustained fiscal consolidation is required to keep debt on a downward path and to make room for ageing-related spending and growth-enhancing items, like education and green transition. This consolidation should rely on both mobilising additional revenues and on enhancing spending efficiency.

Increasing the relatively low tax intake should encompass gradually broadening the value added tax base and raising environment-related taxes, but also reducing tax avoidance and enhancing tax collection. Spending reviews should continue to be used to define growth-enhancing spending priorities, and evaluation of public policies should become the norm.

Public debt remains high

Public debt, Maastricht definition, % of GDP


Made with Flourish

Source: Eurostat.

Raising productivity

Low investment in R&D, inefficient public spending on education and training, and an insufficient stock of ICT capital have dragged down productivity growth, which in the last decade has averaged 0.6% per year compared to 0.9% for the OECD. The share of innovative companies is also comparatively low. All this weighs on potential growth, which with rapid population ageing is expected to weaken even more.

Promoting collaboration and knowledge transfer between businesses and universities, fostering entrepreneurship,  reducing regulatory barriers, and improving regulation can increase innovation and business growth. Continuing with an effective implementation of the investment and reforms under the national Recovery, Transformation and Resilience Plan should remain a priority, as it can help overcome structural deficiencies and boost productivity.

Promoting opportunities for all people across Spain

Despite recent improvements, income inequalities remain significant. Poverty is high compared to the OECD, and Spain has the highest child poverty rate in Western Europe, at 22%. This makes it urgent ensuring that public assistance is sufficient and reaches those who need it more. The survey recommends improving the targeting of social benefits, particularly towards poor families with children, boosting the take-up of the minimum income guarantee, and reducing administrative burdens for users.

Young people in Spain face a challenging transition to an independent, productive, and happy adult life. The risk of poverty among them is particularly high, although it has fallen. That is why the special topic of this survey is how can Spain increase opportunities for its young.

Educational and labour market outcomes have improved, but many young people still leave the education system with low education levels or skills, and youth labour-market integration remains difficult. The share of temporary contracts has decreased after the 2021 labour market reform, but it is still high. The survey recommends training teachers to identify and assist students at risk and maintaining support for students to enrol in vocational education, including by fostering the participation of SMEs to offer places. Furthermore, to ease school-to-work transitions it encourages greater employer involvement in the design of university curricula, and improving access to financing for young entrepreneurs.

Housing is a pressing concern for many people in Spain, especially the young. To increase housing supply, the survey recommends expanding the very low stock of social rental housing and relaxing stringent rent controls.

Young people face high poverty risks

Risk of poverty or social exclusion, %


Made with Flourish

Note: OECD Europe includes European OECD countries and excludes Türkiye.
Source: INE.

Addressing environmental challenges

Spain has made progress in the fight against climate change, as environmental protection expenditure has increased and renewable energies are becoming more prevalent in the energy mix. To keep reducing its dependence on fossil fuels, Spain should accelerate the shift towards greener transportation, improve storage and grid interconnections, and continue promoting renewable energies.

A more environment-friendly tax regime is also needed, as environmental tax revenue as a share of GDP is low compared to most OECD European countries. The base for environment-related taxation can be broadened, including by phasing out exemptions and gradually increasing the tax rate on emissions, while compensating partially and temporarily the most vulnerable.

Persistent drought in some regions has lowered water availability, and intense agriculture production has affected water quality. These problems could be addressed through more efficient irrigation, reuse and recycling of waters, and a more sensible use of fertilizers.

Improving water availability and quality is urgent

Groundwater stations with poor quality standards, %


Made with Flourish

Note: Groundwater stations failing to meet the drinking water standard under the EU Nitrates Directive
Source: European Environment Agency (EEA).

Government action helped Spain to overcome two major successive shocks. Evidence-based public policies can also help to solve Spain’s longstanding structural weaknesses to increase growth and raise wellbeing for all people across Spain.

References

OECD (2023), OECD Economic Surveys: Spain 2023, OECD Publishing, Paris,  https://doi.org/10.1787/5b50cc51-en  


Pathways to Prosperity: Key Reforms for a Thriving Peru

También disponible en español

By Paula Garda and Michael Koelle, OECD Economics Department

Peru has made significant strides over the past two decades in reducing poverty and improving living standards, outperforming many Latin American peer countries as highlighted in the 2023 Economic Survey of Peru.  The basis for this progress was the country’s robust macroeconomic framework and ambitious structural reforms implemented in 1990s. These reforms have catalysed macroeconomic stability, high economic growth, low inflation and low public debt.

The COVID-19 pandemic, however, exposed remaining challenges. Peru experienced one of the most severe economic contractions and excess mortality rates of any country. The economy bounced back in 2021, thanks to its fiscal buffers. The recovery was short-lived and a series of shocks, including Russia’s war of aggression in Ukraine, social unrest and extreme weather events led to inflationary pressures and economic slowdown. The economy is projected to gradually recover with inflation returning to the target range by early 2024. However, Peru faces long-standing structural issues like a large informal sector, infrastructure gaps, and a weak rule of law. These not only magnify the impact of adverse shocks and socio-economic inequalities but also hold up Peru on its path towards better standards of living.

As Peru embarks on its journey towards OECD accession, the process represents a transformative opportunity for the country to design and implement a comprehensive reform agenda to foster convergence to higher living standards for all Peruvians. The 2023 Peru Economic Survey highlights four key priority areas of reforms:

Fostering Long-Term Growth

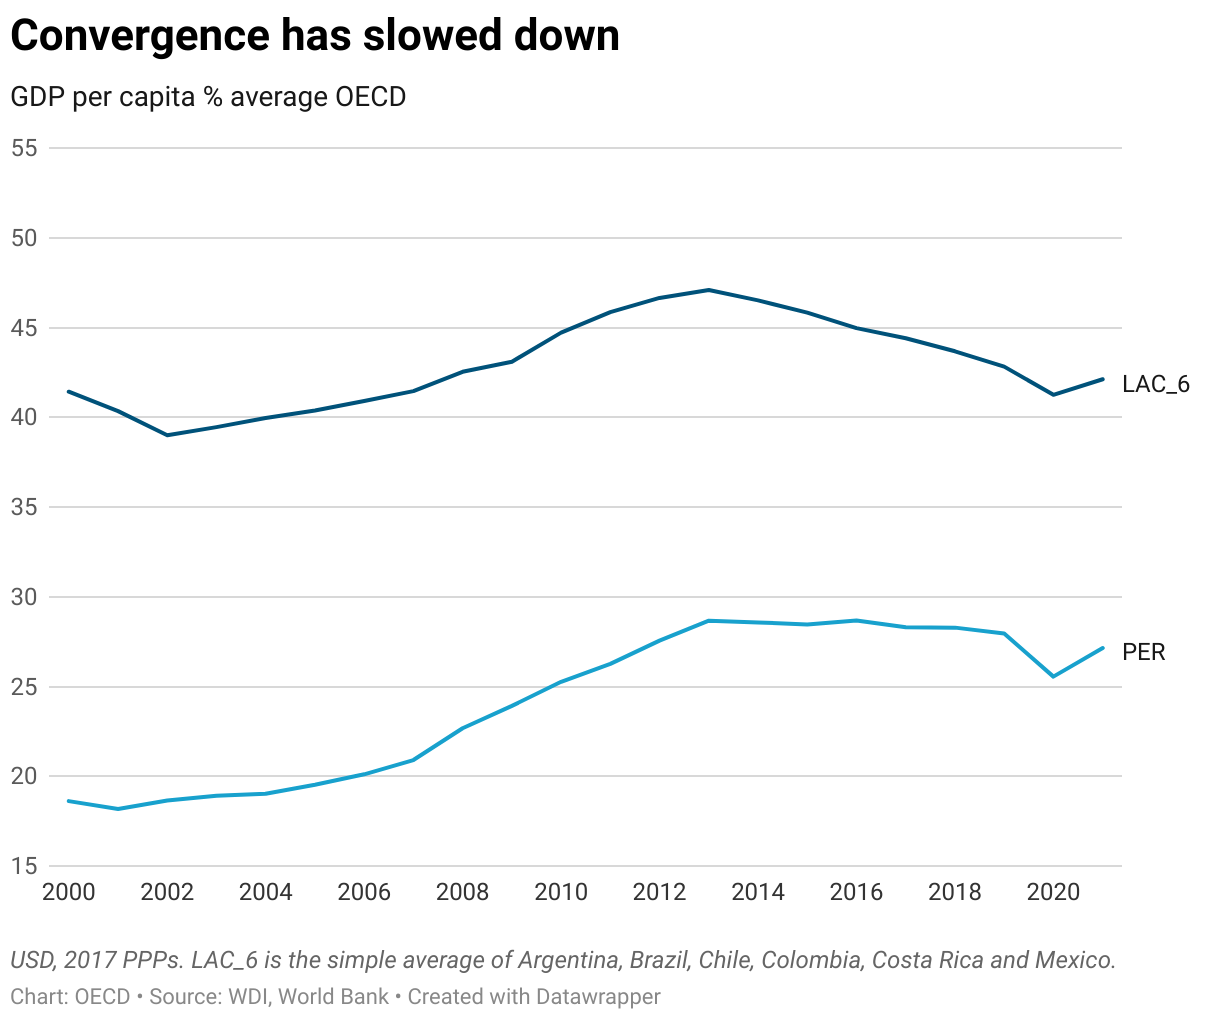
Income convergence to more advanced countries stalled in 2014 with the end of the commodity price boom, making it of utmost importance to boost productivity and investment. While commodities, particularly minerals, have fuelled past growth, there is a need to expand the economy’s productive base. High concentration of market power in a few major business groups reduces market dynamism. This calls for strengthening competition enforcement and simplifying regulations to boost productivity. Additionally, better public spending efficiency would help close infrastructure gaps and deliver essential services while boosting potential growth. This entails enhancing local government capabilities, improving infrastructure planning, and modernising the civil service to enhance overall state capacity. Strengthening the rule of law by fighting corruption and improving judicial independence and efficiency is equally important, as it not only encourages investment but also restores trust in institutions.

Tackling Informality

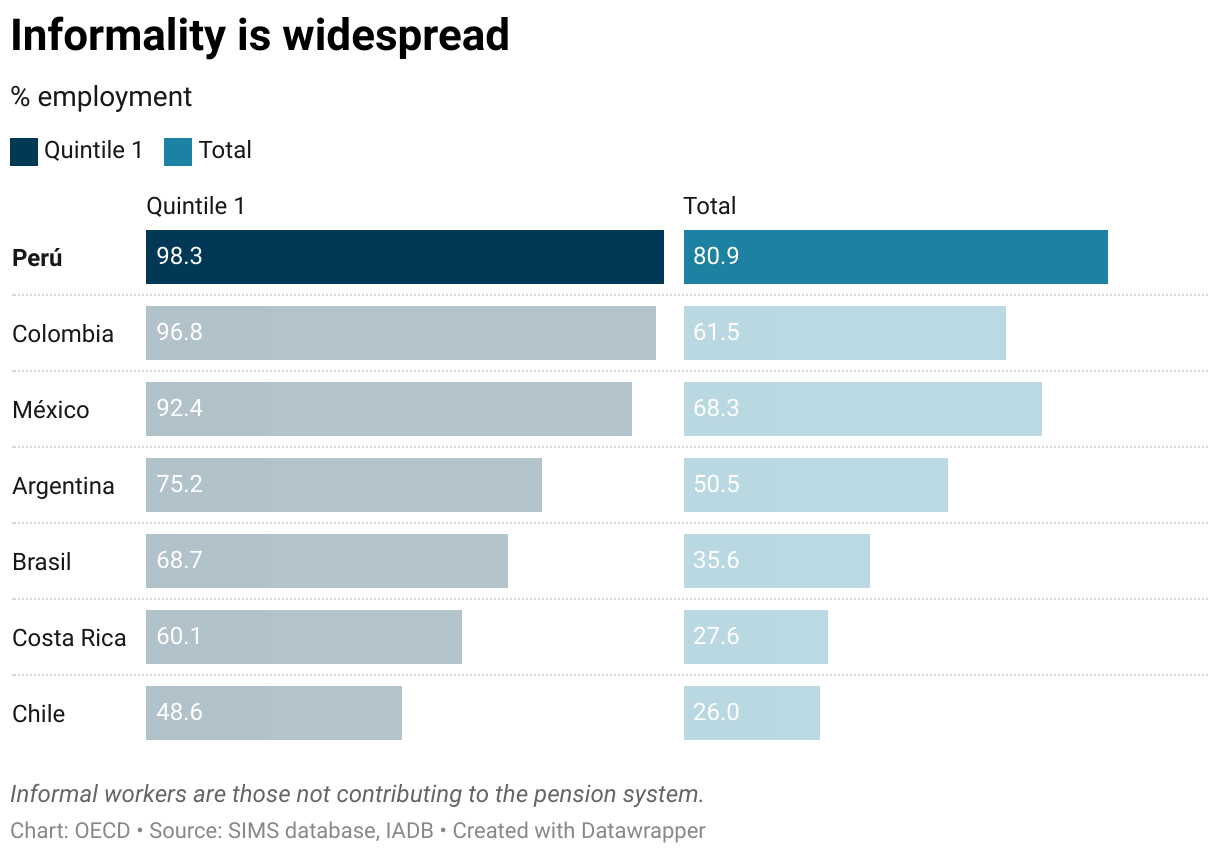
The challenge of informality looms large in Peru, with around 80% of workers in informal jobs, without social and labour protection, and on the margin of the formal tax and benefit system. Though there is no silver bullet solution as the roots of informality are multi-dimensional, fostering formality through a comprehensive reform package is essential for reducing poverty and inequality, boosting productivity, and improving tax collection. Ensuring universal access to basic social benefits – health, pensions, and social assistance – for both formal and informal sector workers alike, could remove some distortions that incentivise informality. This requires increased social spending funded by general taxation instead of by social contributions that make formal job creation expensive incentivising informal job creation. Providing universal access to pensions and health services financed by general taxation offers the possibility of reducing social contributions for low-income workers, promoting formal employment, and boosting productivity. Improving access to high-quality education tackles another root cause of informality, low labour productivity. Closing the gap in learning outcomes, especially among disadvantaged students, requires improving teachers’ training and addressing school infrastructure gaps.

Strengthening Public Finances

Peru’s current tax revenues, at 17% of GDP, lag both OECD and regional peers. A key challenge for Peru is sustaining fiscal responsibility while addressing social and infrastructure needs. Addressing this gap requires a multifaceted approach: improving spending efficiency while strengthening tax administration, reducing tax expenditures, modernizing property registries, and streamlining corporate tax schemes.

Confronting Climate Change

Climate change poses another significant challenge for Peru. The country is highly vulnerable to extreme weather events and is committed to achieving carbon neutrality by 2050. To achieve this goal, the country must combat deforestation—a major contributor to greenhouse gas emissions—and accelerate the use of renewable energy sources implementing stricter regulations and consistent price signals to reduce reliance on fossil fuels, tapping the enormous potential that the country has in this area.

As Peru navigates these multifaceted challenges, its process of accession to the OECD can offer a framework for long-term reforms that address existing vulnerabilities and allow the convergence to higher living standards. This roadmap, grounded in evidence and best practices, should build on the successes of the past, such as the robust macroeconomic setup that fuelled Peru’s economic growth. Realising this transformation demands political consensus, evidence-backed policies, and collaborative efforts.

References

OECD (2023), OECD Economic Surveys: Peru 2023, OECD Publishing, Paris, https://doi.org/10.1787/081e0906-en


Canada: five messages from the latest OECD Economic Survey

By Ben Conigrave and Philip Hemmings, OECD Economics Department

Canada’s economy has proved resilient to testing global conditions in the wake of Russia’s invasion of Ukraine. Amid a strong post-pandemic recovery in output and revenues, the federal government stepped up action to improve housing affordability and expand access to low-cost childcare. While Canada’s recent social policy progress is impressive, a major reform challenge remains – to lift tepid growth in productivity and average incomes while also eliminating net greenhouse gas emissions by 2050. Projected economic growth of 1.3% in 2023 and 1.5% in 2024, while avoiding recession, would not close gaps in living standards to better-performing economies. The latest Economic Survey of Canada sets out recommendations aimed at boosting Canada’s growth potential and driving down carbon emissions.

Inflation has fallen from peak levels but is still above target. The main drivers of last year’s surge in consumer prices have abated. Energy price falls and easing tensions in world supply chains have helped reduce headline inflation. Higher borrowing costs have also started to cool domestic demand after a series of large interest rate rises by the Bank of Canada. Still, underlying price pressures remain elevated. Labour market conditions are tight, with the jobless rate near record lows and workers demanding larger-than-usual wage increases. Policymakers face the tricky task of returning inflation to target without creating an economic downturn.

Figure 1. Inflation has passed its peak but remains high

Headline consumer prices, annual increase, %

Note: The Bank of Canada aims to keep inflation close to the 2% midpoint of a control range from 1 to 3% over the medium term.
Source: OECD (2022), Main Economic Indicators (database).

Living cost pressures have increased. High inflation has eroded real incomes and is weighing on consumer spending. Governments have stepped in to ease the cost of living. Some measures rightly target support to vulnerable households. For instance, the federal government has temporarily increased goods and services tax (GST) credit payments aimed at those on lower incomes. In contrast, provinces have in some cases introduced across-the-board subsidies to reduce utility bills or cut fuel taxes. Untargeted measures of this sort can be costly, fail to focus support on under-pressure households, and weaken incentives to save energy. A major federal-provincial initiative separately promises to improve access to cheap childcare. Properly implemented, the scheme should help lift employment, particularly among women, supporting higher living standards. At the same time, significant socio-economic gaps still separate Indigenous people and the rest of Canada’s population. Support for Indigenous self-determination needs to continue as part of efforts to close these gaps.

Budget repair has been faster than expected. Commodity export price rises contributed to revenue growth in a high-inflation environment just as pandemic support was ending. Deficits and debt burdens have shrunk despite the federal government extending living-cost relief and launching new programmes to improve the affordability of housing and childcare. But as multi-year spending commitments mount, and revenue tailwinds die down, governments will find it harder to sustain budget improvements. Better spending efficiency could reduce long-term fiscal challenges. Tax system reform will also be important, both for fiscal sustainability and unlocking higher potential output. Shifting the tax mix towards greater use of indirect taxes, and less use of distortive taxes on income, would reduce drags on Canada’s productive capacity. Windfall gains from high commodity prices in 2022 also serve as a fresh reminder of the need for provinces to make more use of stabilisation funds to mitigate boom and bust cycles in their budgets.

Figure 2. The public debt burden is decreasing

Public debt, % of GDP

Note: Data for 2022 are estimates. Gross debt includes general government liabilities in the form of currency and deposits; debt securities, loans; insurance, pensions and standardised guarantee schemes, and other accounts payable. Net debt subtracts financial assets from gross debt.
Source: OECD Economic Outlook 112 (database).

More policy focus is needed on productivity-enhancing reform. Population increase, underpinned by high levels of immigration, will continue to be an important driver of growth in Canada’s economy in the years ahead. But long-term improvement in living standards will require higher productivity. Lacklustre productivity growth since 2015 saw gaps in per capita GDP widen between Canada and better-performing economies, including the United States. Reversing this trend, which coincided with weak business investment after the 2014 oil price collapse, demands reform efforts equal to those behind recent social policy advances. Removing barriers to trade between provinces would improve the business environment. Regulations and technical standards impede flows of goods and services across Canada’s internal borders as well as the performance of regional labour markets. Separately, stringent foreign ownership limits in network sectors – including telecommunications – directly restrict foreign direct investment. The rules should be reviewed.

Figure 3. Canada’s investment performance can be improved

Real private non-residential investment

Source: OECD Economic Outlook database.

Strong incentives are needed to decarbonise production. Canada’s resource-intensive economy uses more energy and generates more greenhouse gas emissions per person than most other OECD countries. An ambitious federal government plan aims to change this. Deploying regulations, market-based tools and support for green investment, the government has committed to eliminate Canada’s net emissions by 2050. As well as energy saving in businesses and homes, achieving this goal will require replacement of fossil fuels with clean energy across the economy. For policymakers, the task will be to minimise drags on activity from sometimes overlapping mitigation tools. Higher carbon prices levied uniformly on a larger share of emissions will help ensure an efficient green transition. Canada’s federal and provincial governments must work together to strengthen incentives for low-cost mitigation across key sectors – including electricity, oil and gas, transport and buildings – and prepare communities for fast-changing climates.

Figure 4. Canada’s emission reduction challenge is large

GHG emissions

Note: The solid blue line shows historical GHG emissions. The dotted line shows the emissions reductions required to meet 2030 and 2050 targets along an indicative pathway. The green line shows emissions projections by Environment and Climate Change Canada.
Source: Calculations based on OECD (2022), Environment Statistics (database); Climate Action Tracker; and Environment and Climate Change Canada.

References:

OECD (2023), OECD Economic Surveys: Canada 2023, OECD Publishing, Paris. https://doi.org/10.1787/7eb16f83-en


Maintaining and reinforcing achievements in Costa Rica

By Alberto Gonzalez Pandiella and Alessandro Maravalle, OECD Economics Department

Costa Rica has made remarkable economic progress over the past two decades, such as achieving life expectancy at par with the OECD average. Thanks to a strong commitment to trade, it has succeeded in attracting foreign direct investment and in increasing the level of sophistication of its export basket. However, the challenges to safeguard these achievements and further improve living standards are substantial. Growth prospects were deteriorating before the pandemic and going forward population ageing will take an additional toll (Figure). Unemployment is high, at a two-digit rate since 2018, as well as informality, affecting nearly half of the labour force. The fiscal situation improved in 2021 and 2022, thanks to the 2018 fiscal reform, but with public debt at around 70% of GDP, public finances remain a critical vulnerability requiring sustained efforts to contain spending and boost public sector efficiency. Nearshoring trends, by which companies seek reducing supply chain disruption risks by locating closer to their final markets, are providing new investment opportunities. Costa Rica is a front runner in environmental protection and renewables generation, and the global transition to net zero greenhouse gas emissions can further increase the country’s competitiveness.

The latest OECD Economic Survey (OECD, 2023) argues that continuing and stepping up structural reform efforts would be the best way for Costa Rica to respond to these challenges and seize new opportunities. Reforms to boost productivity are particularly critical to uphold growth in GDP and living standards. Strengthening competition is especially a promising avenue to boost productivity. Weak competition tends to translate into relatively high prices of goods and services for consumers and firms. Valuable and bold steps have been recently taken to boost competition in key markets, such as rice or professional services. Steps are also being taken in cooperation with the private sector to reduce regulatory burden, by identifying regulations and procedures susceptible to be phased out, including also specific deadlines for their elimination. Providing the national competition authority with the budget granted by law is a pending challenge that would be particularly beneficial at the current juncture when measures to improve regulations and open up key sectors of the economy are being taken. Effective competition authorities, by promoting stronger economic growth, can also have a positive fiscal impact by supporting higher tax revenues.

Informality, at around 45% of total employment, remains high and is both a cause and a consequence of low productivity. A comprehensive strategy is required to reduce it, with actions needed in several policy areas, such as reducing non-wage labour costs, facilitating the creation of formal firms, including by reducing the bureaucratic and economic cost of establishing a formal firm, helping more Costa Rican to acquire the skills needed to access formal jobs, simplifying taxes and enhancing enforcement mechanisms. Experience in some OECD countries, such as Colombia, indicates that reducing non-wage costs, by cutting employer payroll charges, can help to reduce informality. Employer payroll charges in Costa Rica are high in comparison with the OECD average, indicating that there is ample room to move in this direction.

Virtually universal health care and primary education and one of the highest pension coverage in the region have led to remarkable social outcomes. However, Costa Rica faces substantial social challenges, such pas poverty remaining largely unchanged at around 20% over the last 25 years and increasing income inequality. There is room to improve social programmes targeting, as in some cases more than 40% of the beneficiaries are middle and high-income households. There is also room to reduce fragmentation, as 21 institutions are in charge of delivering more than 35 schemes. Better targeting and lower fragmentation would facilitate reinforcing social protection in key areas and reduce inequality.

Improving the quality and efficiency of education and training is also key to support growth and equity in Costa Rica. Even if spending on education is high in Costa Rica, where it amounts to more than 6.5% of GDP, one of the highest shares across OECD countries, educational outcomes remain poor and educational exclusion is still high, with too many Costa Ricans leaving school without an upper-secondary education. A more targeted support to students with learning gaps, improving teachers’ selection and training and expanding access to education to children below four years would help increase equity of opportunities and help more Costa Ricans access better paid formal jobs and firms fill easier their vacancies.

Figure. Without reforms the economy’s growth potential will fall as the demographic bonus fades

Contributions to potential growth, % pts

References:

OECD (2023), OECD Economic Surveys: Costa Rica 2023, OECD Publishing, Paris.


The United Kingdom: Stronger growth needs significant productivity improvements across regions

By Daniela Glocker, OECD Economics Department

On the heels of the COVID-19 pandemic, the UK economy is again facing major challenges. A combination of substantially higher energy prices, increasing global prices of tradable goods and services and heightened uncertainty is dampening the economic outlook. The September Interim Outlook foresees annual growth for the United Kingdom of 3.4% in 2022 before stagnating in 2023. Inflation is expected to peak at just over 10% towards the end of 2022, driven by supply shortages and high global energy prices. Private consumption, a main driver of the recovery in 2021, is expected to slow as rising costs of living erode households’ income.

In this complex context, the Economic Survey of the United Kingdom 2022 argues that productivity must be strengthened to support growth and increase the country’s fiscal space. Already before the pandemic, productivity growth was lower than in many other advanced economies and has almost stagnated since the Global Financial Crisis (Figure 1). Productivity growth has stalled on the back of skill mismatches, low innovation and knowledge diffusion, as well as low investment. Regional disparities in productivity, income, work, education and health are high across UK regions and are weighing on aggregate productivity.

Raising productivity and living standards in lagging regions is at the heart of the government’s “Levelling Up” agenda and will require significant investment. The government plans for large scale investments in infrastructure, skills and innovations through its “Plan for Growth”. Public investment has increased in recent years and will remain close to a significant 2.5% of GDP over the coming years, however, large investments will be needed to compensate for years of underinvestment and to address long-term challenges such as the net zero transition. The Survey therefore recommends the government to continue its ambitious public investment as planned, and implement the Levelling Up White Paper proposals such as infrastructure investments and targeted spending in poorer areas outside London and the South East. The government should ensure funding is well targeted, better streamlined, and with a special focus on improving productivity in lagging regions.

A substantial rise in business investment, including in physical capital, innovation or new processes that would make labour more productive, is needed. Business investment has been slow on the back of Brexit and pandemic related uncertainty, contributing to low productivity growth. A policy environment that reduces uncertainty and provides a transparent and credible longer-term strategy could support business confidence and investment.

Figure 1. Productivity growth has almost stagnated

Average annual productivity growth rates, in percent

Note: Labour productivity is measured as GDP per hour worked in constant prices, USD purchasing power parities.
Source: OECD (2021), productivity database.

Raising skills across the population is the key to support productivity growth. On-going efforts to up-skill and re-skill are already significant, but digitalisation, automation and the transition to net zero will add to quickly rising demand for skills in an already tight labour market. The Survey welcomes the government’s focus on lifelong learning programmes, but stresses that it should be ensured that training opportunities for adults are of high quality and respond to identified skills need. It is equally important to make use of already existing skills. Women in the United Kingdom are highly educated, but many women reduce their working hours after they have children to take over care work. Reducing the high cost for good quality childcare, in particular for under 2-year-olds, could incentivise more women to work full-time and would be one way to grow the economy and reduce the gender gap in earnings.

As the United Kingdom readies itself to tackle the challenges ahead, it is not the time to repeat the old ways. It is the time to set the foundation for a new future. A future that is better and that is more productive.

Reference

OECD (2022), OECD Economic Surveys: United Kingdom 2022, OECD Publishing, Paris, https://doi.org/10.1787/7c0f1268-en.