Wired for power: The energy behind the AI revolution

Artificial intelligence is fast becoming a defining driver of electricity demand in Europe. As AI deployment accelerates, the key constraint is shifting from computing power to the capacity of electricity grids to absorb large, continuous and localised loads. This blog examines how updating and modernising grid planning, connection rules and energy regulation are emerging as important enablers of AI’s future in the EU.

By Ruben Maximiano and Wouter Meester, OECD Economics Department.


AI’s energy reality

Dieser Blog ist auch auf Deutsch verfügbar: Strom – die treibende Kraft der KI-Revolution

AI is often discussed as though it operates independently of physical systems. In practice, AI depends on vast amounts of electricity. Its future will be determined not only by advances in algorithms and computing power, but also by kilowatt-hours – by the ability of electricity systems to deliver power reliably and at scale.

Training and running frontier models requires continuous and increasingly large volumes of power. According to the IEA, a typical AI-focused data centre already consumes as much electricity as 100 000 households, whilst the largest new facilities could require 20 times more, placing them on par with the consumption of small countries (IEA, 2025).

As a result, an important binding constraint on AI deployment is no longer generation alone. It is increasingly the capacity of electricity systems to absorb, transport and manage large, continuous and geographically concentrated loads without conflicting with other usages. As the recent OECD Diagnostic Tool for Reducing Regulatory Barriers to Solar, Wind and Pumped Hydro Storage in the EU report shows, tackling these also involve better regulations.

The importance of energy to AI roll-out is visible in corporate energy sourcing strategies. Big Tech companies now account for the majority of Corporate Power Purchase Agreements (PPAs) in Europe (see figure 1). Yet the scale and speed of AI deployment are already outpacing what traditional PPAs can guarantee. Hyperscalers are turning to direct investment in generation, including solar, wind and nuclear, to secure long-term supply.

Taken together, these developments point to the conclusion that the next frontier of AI policy is not only about how much electricity is produced, but also about how grids are planned, reinforced and that to a significant extent depends on how grid investment and grid connection rules are regulated.

To address such barriers systematically in the EU, the OECD report Diagnostic Tool for Reducing Regulatory Barriers to Solar, Wind and Pumped Hydro Storage in the EU, identifies the regulatory bottlenecks that slow deployment of renewables in the EU and constrain grid availability, with clear parallels for policymakers seeking to adapt energy rules to enable AI deployment. As this blog is based on this work it refers mainly to EU practices and energy mix.

Global AI and local grids

While global electricity demand from AI remains moderate (expected to reach 3% globally by 2030 and 4.5% in the EU)(IEA 2025, Ember 2025), its impact is highly concentrated. Data centres cluster in locations offering robust fibre connectivity, favourable cooling conditions, low electricity prices, and fast, reliable grid access. This concentration amplifies pressure on local grids and exposes the limits of existing planning and connection frameworks.

Ireland illustrates these risks. In 2023, data centres accounted for around 21% of electricity consumption in 2023 up from 5% in 2015. Much of this has been concentrated around Dublin, where data centres consume roughly half of electricity produced. The resulting strain on the network raised security-of-supply concerns and led to the Transmission System Operator stop accepting applications for new data centres in Dublin until 2028 (Ember, 2025, CRU, 2025). In response, the national regulator is introducing a number of regulatory changes, including requirements for new data centres to install dispatchable generation or storage facilities on site.

The countries with more abundant and affordable electricity and stronger grids have a comparative advantage for the location of data centres. For instance, the Nordic countries have become attractive AI destinations due to abundant energy, strong grids and low-carbon baseload (Ember 2025). More broadly, IEA analysis suggest that jurisdictions offering significantly faster grid-connection timelines could capture up to 20% more data-centre growth by 2030 (IEA, 2025).

How AI stresses electricity systems

These pressures materialise across three interconnected timescales. In the long term, large AI campuses require transmission and distribution networks with sufficient hosting capacity, yet grid expansion and permitting often take 5 to 10 years. This makes anticipatory planning and co-ordination between data-centre siting, grid investment and local generation essential. Just as important is grid optimisation: improving system efficiency through digitalisation and AI-based system management.

In the medium term, inefficient connection rules have become a binding constraint. Long queues, speculative applications and first-come, first-served rules delay viable projects and distort planning. In real time, AI workloads introduce rapid power swings – far faster than traditional industrial loads -challenging frequency stability and voltage control.

Addressing these pressures requires regulatory frameworks that enable not only physical grid reinforcement, but also optimisation through digitalisation, flexibility procurement and stability services, and that allow system operators to invest in software and operational solutions alongside traditional capital assets.

The Diagnostic Tool shows that key elements of the regulatory system that contribute to address these pressures, would include:

  • Anticipatory grid investment supported by clear cost-recovery rules.
  • Criteria-based connection queues to prioritise ready and system-beneficial projects.
  • Hosting-capacity maps to guide efficient siting.
  • Flexible access arrangements, including non-firm and hybrid connections.
  • Tariff and market design that value flexibility and stability services.

How countries are responding

Countries are increasingly adapting electricity regulation to manage the highly localised grid impacts of AI-driven demand. Governments are experimenting across different parts of the power system. In Europe, Italy is improving locational planning through detailed hosting-capacity maps; Portugal is reallocating unused capacity and simplifying storage licensing; the UK is reforming connection queues by prioritising projects that are “first ready, first connected”; the Netherlands is deploying congestion-management zones and prioritisation criteria; and Finland is integrating data centres into heat-recovery and clean-power strategies.

Despite this diversity, common policy lessons seem to emerge. Grid access can no longer be treated as a simple administrative queue and requires prioritisation based on readiness. Locational transparency is critical to guide efficient investment. Flexibility and digital optimisation must complement traditional grid reinforcement. Finally, grid planning and permitting need to become anticipatory rather than reactive. Countries applying these principles are better positioned to accommodate AI-scale demand while preserving reliability and affordability.

Powering the age of intelligence

AI is reshaping electricity demand at a scale that is now central to economic strategy. Ensuring reliable, affordable and low-carbon supply is becoming a prerequisite for attracting and sustaining digital investment. In the age of AI, competitiveness, autonomy and resilience will increasingly be determined not only by data and algorithms, but by the rules that govern the compute infrastructure and their electricity systems.

The OECD–EU Diagnostic Tool offers governments a practical roadmap to modernise regulatory frameworks and align them with the needs of an electricity-intensive digital economy.

*We will be launching the Diagnostic Tool today, 29th January. You may register here.

References

CRU, “Large Energy Users connection policy”, December 2025, https://cruie-live-96ca64acab2247eca8a850a7e54b-5b34f62.divio-media.com/documents/CRU2025236_Large_Energy_User_connection_policy_decision_paper.pdf

Ember, 2025, Grids for data centres: ambitious grid planning can win Europe’s AI race, https://ember-energy.org/app/uploads/2025/06/Grids-for-data-centres-in-Europe.pdf

IEA, 2025, Energy and AI, World Energy Outlook Special Report

OECD, 2025, OECD–EU Diagnostic Tool for Reducing Regulatory Barriers to Solar, Wind and Pumped Hydro Storage


Stablecoins on the rise: A risk for financial stability? 

By Caroline Roulet, OECD Economics Department.

Stablecoins are a type of crypto-asset designed to maintain a stable value by anchoring to a reference asset (often US Treasury bills). They offer convertibility on demand at par, and fee-free, immediate and pseudonymous transactions, making them an attractive means of payment, especially across borders. The market value of stablecoins has risen rapidly, with two issuers that mainly rely on USD-denominated collateral accounting for almost 90% of the global market capitalisation (Figure 1). Stablecoins are still only a small part of financial markets, but as they expand and become more intertwined with traditional finance they pose non-negligible risks to financial stability and important challenges for financial regulation and monetary policy.

As discussed in the latest OECD Economic Outlook the total value of payments using stablecoins surpassed that of major traditional digital payment providers in 2024-25 (Figure 2, Panel A). Currently, stablecoins are mainly used to settle trades in other crypto-assets, and now account for around 80% of all trades on crypto-asset platforms (ECB, 2025), although usage for other payments by corporates and households has begun to rise.

Though less risky than crypto-assets as a whole, some stablecoins have experienced significant price volatility, particularly those that are not fiat-collateralised (i.e. not fully backed by assets denominated in currency terms, such as US Treasury bills or bank deposits). Fiat-collateralised stablecoins have been much more stable, but still often deviate from par in secondary markets (Aldasoro et al, 2025). In contrast to the majority of bank deposits, stablecoins are typically uninsured. Variation in the value of their backing assets (and subsequent deviations of stablecoins’ market value from their original face value) can therefore prompt holders to request redemptions, with ensuing risks of liquidity shortages and fire sales of collateral.

The expansion of stablecoins raises financial stability risks. One concern is the potential effects on the pricing and operation of segments of critical funding markets, such as sovereign debt markets (Aldasoro et al., 2025), as stablecoin issuers are now major holders of US Treasury bills (Figure 2, Panel B). Investor inflows into stablecoins and asset sales to meet redemptions could thus affect short-term bond yields and hence monetary policy transmission. Stablecoin issuers’ generation of additional income through reverse repos (lending securities to traditional financial intermediaries who then pledge them as collateral) may also add to potential strains on repo market liquidity at times of stress.

Figure 2. Stablecoin transactions are expanding and holdings of US Treasury bills are sizeable

Note: In Panel A, Visa and Mastercard payments primarily reflect settlements for goods and services, while stablecoins have been primarily used so far to settle trades in other crypto-assets. Payments data (Gross Dollar Volume, GVD) for Mastercard in 2025 is available through Q3, with Q4 estimated using the average GDV from the first three quarters. Panel B reports holdings of US T-bills by selected domestic and foreign holders and major stablecoins issuers (Tether and USD Coin) as of 2025 Q3.
Source: Artemis Analytics; Tether and USD Coin transparency reports; US Federal Reserve; US Department of the Treasury; Visa and Mastercard annual reports; and OECD calculations.

The expansion of stablecoins may also pose risks to banks. Companies with crypto-related business models, including stablecoin issuers, also hold bank deposits (as required by regulation in some jurisdictions). This could prove an unstable deposit base if stablecoin issuers suddenly withdraw funds to meet liquidity needs (ECB 2025), potentially disrupting bank credit availability.

The growing adoption and use of stablecoins, alongside their ability to circulate freely across borders, poses economic policy challenges. In emerging-market economies, the use of foreign‑currency denominated stablecoins could raise exchange rate volatility at times of stress and enable foreign exchange regulations to be bypassed. This would make standard indicators of capital outflows harder to interpret. More broadly, usage of foreign currency denominated stablecoins could weaken the control of monetary conditions by domestic central banks (BIS, 2025; Rey, 2025). The potential use of stablecoins for illicit activities is a further concern, raising challenges for the enforcement of anti‑money laundering and financing of terrorism regulations.

Many countries have begun to develop tailored regulations relating to stablecoins, and crypto-assets more generally. Prominent recent examples include the GENIUS Act in the United States (Guiding and Establishing National Innovation for U.S. Stablecoins Act, enacted in July 2025) and the MiCA (Markets in Crypto-Assets) Regulation in the European Union, which became effective from December 2024. However, regulatory approaches differ across countries and significant gaps and inconsistencies remain (FSB, 2025). The limited oversight of cross-border transactions is a key challenge, potentially hampering responses to systemic risks and encouraging regulatory arbitrage. The rapid growth of the stablecoin market, and the impact stablecoin usage may have on other asset markets, highlights the need for enhanced international cooperation to ensure effective regulation, supervision, and oversight of stablecoins in all jurisdictions.

REFERENCES

ECB (2025), “Just another crypto boom? Mind the blind spots”, Financial Stability Review, May, European Central Bank.

Aldasoro, I., M. Aquilina, U. Lewrick, and S. Lim (2025), “Stablecoin growth – policy challenges and approaches,” BIS Bulletins 108, Bank for International Settlements.

BIS (2025), Annual Economic Report, Chapter 3 “The next-generation monetary and financial system”, June, Bank for International Settlements.

FSB (2025), Thematic Review on FSB Global Regulatory Framework for Crypto-asset Activities, Financial Stability Board, Geneva. Rey, H. (2025), “Stablecoins, tokens, and global dominance”, IMF Finance and Development magazine, September.

Rey, H. (2025), “Stablecoins, tokens, and global dominance”, IMF Finance and Development magazine, September.


Un sector público más digital para una América Latina más productiva

Jens Arnold, Aida Caldera, Priscilla Fialho, Paula Garda, Alberto González Pandiella, Michael Koelle, Alessandro Maravalle, Dimitris Mavridis, Claudia Ramírez y Adolfo Rodriguez-Vargas, Departamento de Economía, OCDE

La última edición de las Perspectivas Económicas de la OCDE ofrece un diagnóstico realista pero esperanzador sobre las economías latinoamericanas. Aunque el entorno global sigue siendo complejo, marcado por tensiones comerciales y geopolíticas, la región tiene oportunidades claras para fortalecer el crecimiento económico a través de las reformas estructurales. Una de las más prometedoras: la transformación digital del sector público para simplificar trámites, reducir costos y mejorar la eficiencia regulatoria.

América Latina muestra resiliencia pero con desafíos persistentes

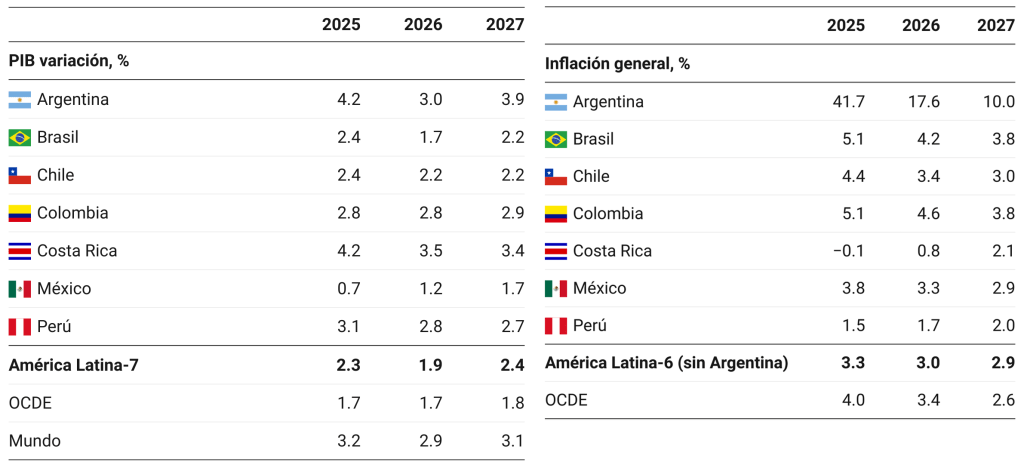
En línea con la evolución de la economía global, tras un crecimiento proyectado del 2.3% en 2025, se prevé una ligera desaceleración al 1.9% en 2026, antes de repuntar al 2.4% en 2027 en las  siete principales economías de la región. Factores como la consolidación fiscal en muchos países de la región, necesaria pero restrictiva, y una elevada incertidumbre política y económica seguirán afectando la demanda interna, la inversión y las exportaciones, principalmente en 2026.

Cuadro. Perspectivas económicas para los países de América Latina

Nota: América Latina 7 es la media ponderada por el PIB a valores de paridad del poder de compra de los 7 países en la tabla para el PIB. América Latina 6 es la media simple de los países incluidos en el cuadro para la inflación excluyendo a Argentina.
Fuente: OCDE Perspectivas Económicas No. 118, diciembre de 2025.

La inflación en los últimos meses ha sido más persistente de lo esperado. En la mayoría de los países se prevé que en 2025 la inflación se mantenga por encima de las metas de los bancos centrales, convergiendo gradualmente hacia las metas en 2026 y 2027. Excepciones son Perú, donde la inflación está controlada hace un año, Costa Rica, que mantiene una inflación negativa en 2025, y Argentina, en donde la elevada inflación seguirá reduciéndose gracias a una combinación de consolidación fiscal y política monetaria restrictiva. La mayoría de los países tendría que mantener una política monetaria prudente basada en datos y orientada a devolver la inflación a sus metas sin generar presiones innecesarias sobre la actividad. En este contexto, los bancos centrales deben mantenerse atentos a la evolución del comercio global, las condiciones financieras, las expectativas de inflación y la orientación de la política fiscal. Al mismo tiempo, será clave que la consolidación fiscal siga avanzando con medidas concretas y más ambiciosas, dada la elevada deuda pública y la necesidad de asegurar su sustentabilidad en un entorno externo incierto y con elevados costos de financiamiento.

Los riesgos económicos están sesgados a la baja:

  • Incertidumbre global derivada de tensiones comerciales y geopolíticas, junto con la incertidumbre política en algunos países de la región asociada al ciclo electoral u otros factores internos, podría afectar negativamente a la inversión y las exportaciones, con repercusiones adversas sobre el crecimiento económico.
  • Desviaciones fiscales podrían subir el coste del servicio de la deuda, socavar la confianza, frenar la inversión y generar presiones inflacionarias.
  • Persistencias inflacionarias limitarían el espacio para reducir las tasas de interés, afectando las condiciones financieras y desincentivando el consumo y la inversión.

Sin embargo, también hay riesgos al alza: una reducción de las barreras comerciales o redirección del comercio hacia la región y una menor incertidumbre geopolítica podrían fortalecer el consumo, la inversión y el consumo.

Aprovechar la revolución digital para avanzar hacia marcos regulatorios más simples y eficientes

El capítulo especial de las perspectivas económicas subraya la necesidad de avanzar hacia marcos regulatorios más simples y eficientes. En este contexto, la transformación digital del sector público emerge como una herramienta clave para facilitar esta simplificación regulatoria, reduciendo la carga administrativa y modernizando procesos normativos. Una implementación eficiente de la gobernanza digital representa una gran oportunidad para América Latina, tanto para mejorar la eficiencia del gasto público y la transparencia, como mejorar el crecimiento económico al impulsar la productividad de las empresas, históricamente baja. Un gobierno digital bien implementado permite:

  • Ofrecer servicios públicos más rápidos, sencillos e inclusivos.
  • Reducir costos administrativos y simplificar trámites gubernamentales, mejorando el entorno de negocios, lo que cual se puede traducir en ganancias significativas de eficiencia al reducir costos y tiempos de espera, ampliar la cobertura y fomentar la competitividad de las empresas. 
  • Fortalecer la transparencia y rendición de cuentas facilitando el acceso ciudadano a la información, la detección de irregularidades, contribuyendo a prevenir el fraude.

Los indicadores de la OCDE muestran que países como Colombia y Brasil lideran el gobierno digital en la región. Colombia ha avanzado significativamente con la puesta en marcha de plataformas en línea, aplicaciones móviles para trámites gubernamentales y datos abiertos, mientras que Brasil ha sido pionero en servicios como el voto electrónico, las declaraciones de impuestos digitales, y más recientemente la centralización del acceso a cientos de servicios y la identificación digital. No obstante, muchos otros países siguen rezagados (Figure 1).

¿Qué se necesita para una transformación digital exitosa del sector público?

Para lograr una transformación digital exitosa en el sector público, los gobiernos de América Latina aún enfrentan retos importantes y requieren redoblar esfuerzos para lograr:

  • Infraestructura digital robusta con cobertura suficiente y sistemas interoperables entre niveles de gobierno para garantizar que todos puedan acceder a los servicios digitales.
  • Coordinación efectiva entre gobiernos centrales y locales. En muchos países de la región, existe una gran brecha en el uso de herramientas digitales entre las instituciones públicas centrales y las locales.
  • Autoridad política clara para liderar la transformación.  El reciente impulso a la agenda digital en México, incluida la creación de la Agencia de Transformación Digital y Tecnológica, es un ejemplo destacado de cómo dotar de liderazgo institucional a estos procesos
  • Regulación ágil y flexible para tecnologías emergentes como la inteligencia artificial.
  • Confianza ciudadana. Garantizar la privacidad y la seguridad de los datos es esencial para que los ciudadanos confíen y utilicen los servicios públicos digitales, aprovechando así al máximo el potencial de la digitalización. Además, publicar datos en formatos reutilizables facilitaría el acceso a información pública completa y confiable, mientras que impulsar la colaboración entre gobiernos, sociedad civil, universidades y empresas, aceleraría la experimentación y mejoraría el impacto de la gobernanza digital.

Casos exitosos como el de Estonia demuestran que una gobernanza digital bien implementada puede generar ahorros al gobierno equivalentes al 2 % del PIB anual.

Digitalizar para transformar

La digitalización del sector público no solo mejora la eficiencia del gasto público. También genera beneficios que se extienden a toda la economía, al elevar la productividad, reducir cargas administrativas para ciudadanos y empresas, facilitar la formalización y mejorar el acceso a servicios esenciales, todos desafíos de larga data en la región. Pero para que la gobernanza digital tenga legitimidad y pueda realmente desplegar todo su potencial, es necesario que todos se conviertan en “ciudadanos digitales”. Esto implica centrarse en las necesidades reales de la población y crear las condiciones para que todos tengan acceso a conexión a internet, dispositivos adecuados y las habilidades necesarias para navegar con seguridad. La transformación digital debe ser ambiciosa. Solo así la región podrá aprovechar todo su potencial y construir un futuro más próspero.

Para más información:

OECD (2025), OECD Economic Outlook, Volume 2025 Issue 2, OECD Publishing, Paris, https://doi.org/10.1787/9f653ca1-en – Reporte completo en inglés con las proyecciones macroeconómicas, los principales desafíos estructurales e información detallada por país.

Perspectivas económicas de la OCDE para países de América Latina

Información detallada por país: Argentina Brasil Chile Colombia Costa Rica | México Perú


Developments in Artificial Intelligence markets: New evidence on model characteristics, prices and providers

By Christophe André, Manuel Bétin, Peter Gal and Paul Peltier.

The release of Deepseek’s R1 model on January 20th stunned the world. This “sputnik moment” in AI showed that an almost unknown Chinese company could develop an AI model at the very top of AI capabilities at a fraction of the development costs of other leading models, release its parameter set (“weights”) for open use and offer ten times cheaper access to users. 

Our recent OECD paper, “Developments in Artificial Intelligence markets: New indicators based on model characteristics, prices and providers” (André, Bétin, Gal and Peltier, 2025), shows that while important risks for competition in digital markets persist, the strong position of digital incumbents in the supply of AI has not curbed innovation and prevented potential AI-users from accessing better and cheaper AI models, which provides strong preconditions for adoption across many sectors of the economy.

New data and indicators to monitor AI markets

After the skyrocketing popularity of OpenAI’s GPT models in late 2022, concerns emerged that AI may further entrench dominant positions in digital markets, with incumbents gaining a definitive advantage by controlling the three key AI inputs to AI development: access to data, computing capacity and top AI talents (OECD, 2024). However, emerging empirical evidence offers some nuance regarding such concerns.

The paper relies on an extensive data collection on AI foundation models on the market and shows that, so far, there have been several signs indicating dynamism in three segments of the AI value chain (AI model development, AI model provision from the cloud and AI downstream applications). First, the number of available AI foundation models has been rising exponentially (Figure 1), developed by an increasing number of companies and offering several interaction modalities. 

Second, using common industry benchmarks to evaluate AI models’ performances and collecting prices of AIfrom cloud providers, we construct an AI Economic Frontier by identifying, each month, the best models in terms of the price-performance trade-off (Figure 2). Results suggest that in the last two years, the positions at this AI Economic Frontier have shifted continuously towards lower prices and higher quality. Moreover, the developers and models that make it to the frontier have been changing, with five to six players alternating at the frontier (OpenAI, Meta, DeepSeek, Anthropic, etc.) and around ten others following closely.

Figure 2. The AI Economic frontier shows the continuous improvements of AI 

Note: Performance is defined by a normalised weighted performance index on industry benchmarks. Each dot represents the model with the best available price-performance trade-off within Text-to-Text models.
Source: André, Betin, Gal and Peltier, 2025.

This variety of models at the frontier is important from an economic perspective. Many users may not always need the best available models and would rather pay an order of magnitude less to access “good enough” models specialised for specific tasks or preferences. In addition to the offer of closed models directly from the cloud, open-weight models offer an option for cheaper (with no license fee), transparent and easily customable (fine-tuned) models used outside of the public cloud environment. This option provides opportunities for better tailored performance and greater control in specific business applications and enhanced data privacy.

AI is getting better, cheaper and more accessible

Figure 2 illustrates the upward shift of the AI economic frontier, implying that AI has become more efficient and cheaper. Indeed, our quality-adjusted AI price index has fallen by on average 80% in two years (Figure 3) and, on average, 30% of models at the frontier have been replaced every month by cheaper and better models.

AI-adopting firms have benefited from greater access to AI models via a widespread offer accessible through several cloud providers (for business use) and an increasing number of AI-powered consumer services (consumer-facing applications). According to our data collection, around 60 cloud providers offer access to AI models, on average from five different AI developers. Downstream, in consumer facing applications, we recorded more than 12 000 AI tools ranging from chatbots to image editing software, customer support applications or domain specific services. While this offer is large and growing, only a few of them (like ChatGPT) attract most users.

 AI market developments have been favourable for AI users, but risks for competition exist

Dynamic AI markets are a necessary condition for the diffusion of AI across the economy via widespread AI adoption in various sectors, a central determinant of long-term productivity gains from AI (Filippucci et al., 2024). Our evidence so far suggests that the supply of AI has been more open than initially expected in various segments of the AI value chain, driving innovation and generating the optimal conditions for broad AI adoption (lower price, better quality, broader accessibility). If current trends persist, dynamic AI markets can foster adoption and boost innovation which in turn are preconditions for widespread economic and welfare benefits.

Nonetheless, several uncertainties and risks persist about the future dynamism of AI markets. For instance, the capacity of digital incumbents to leverage existing compute infrastructure and user base in adjacent markets is high. Furthermore, the high concentration of the necessary inputs for AI development — data, compute, and talent — creates additional risks for long-term competition.

References

André, C. et al. (2025), “Developments in Artificial Intelligence markets: New indicators based on model characteristics, prices and providers”, OECD Artificial Intelligence Papers, No. 37, OECD Publishing, Paris, https://doi.org/10.1787/9302bf46-en.

Filippucci, F., P. Gal and M. Schief (2024), “Miracle or Myth? Assessing the macroeconomic productivity gains from Artificial Intelligence”, OECD Artificial Intelligence Papers, No. 29, OECD Publishing, Paris, https://doi.org/10.1787/b524a072-en.

OECD (2024), “Artificial intelligence, data and competition”, OECD Artificial Intelligence Papers, No. 18, OECD Publishing, Paris, https://doi.org/10.1787/e7e88884-en.

Live data from OECD.AI


Miracle or Myth? Assessing the macroeconomic productivity gains from Artificial Intelligence

By Francesco Filippucci, Peter Gal and Matthias Schief, OECD Economics Department.

Artificial Intelligence (AI) could unleash productivity gains, boost growth, and raise incomes. Indeed, many firms are looking to the technology to increase productivity, with large documented gains in workers’ performance from using Generative AI tools (e.g. Large Language Models similar to ChatGPT) in business contexts such as customer service, business consulting, or software development. Moreover, given its rapidly expanding capabilities, AI is widely heralded as a new General-Purpose Technology (GPT) that could lift macroeconomic productivity growth, as it was the case with the internet and personal computers or with previous breakthrough innovations like the steam engine and electricity (Agrawal, Gans and Goldfarb, 2019; Lipsey, Carlaw and Bekar, 2005; Filippucci et al, 2024).

But can current micro-level productivity gains really lead to large productivity gains from AI at the macroeconomic level over the next decade? To answer this question, one needs to consider what share of economic activities would experience productivity gains if AI was adopted (“exposure to AI”), and how quickly firms will adopt AI. Additionally, at the macroeconomic level, one needs to consider that productivity gains can also depend on broader economic factors, such as sectoral linkages, demand responses, or labour and capital market frictions.

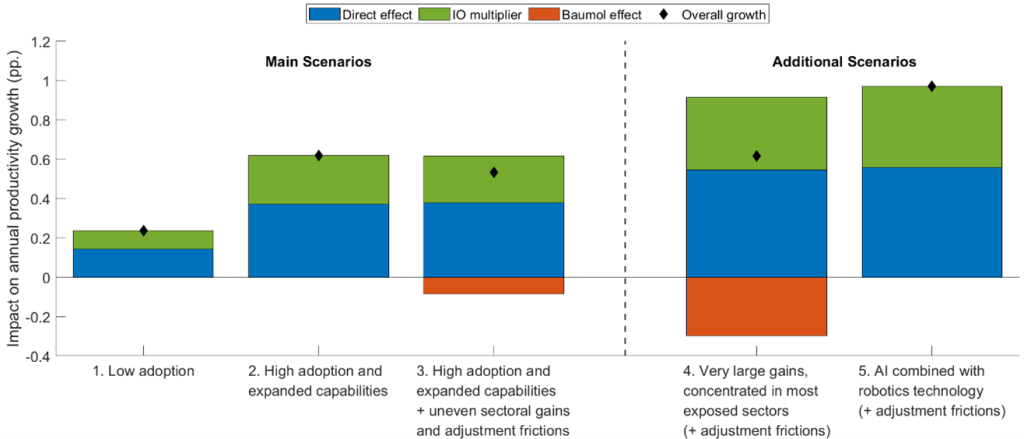
A new working paper by the OECD Economics Department (Filippucci, Gal and Schief, 2024) considers these mechanisms and assesses the macroeconomic productivity gains from AI over the coming 10-years. The results suggest that AI could contribute significantly to aggregate productivity growth over the next decade, contributing between 0.25 to 0.6 percentage points to annual Total Factor Productivity (TFP) growth in the United States (or 0.4 to 0.9 percentage points to annual labour productivity growth) in our main scenarios (Figure 1). Estimates for other economies are of similar magnitude, though somewhat lower given that adoption of AI is expected to be slower. These estimates imply a substantial improvement in the context of the weak productivity growth across the OECD over the past decades, which has been in the range of 1-1.5% per year.

Figure 1: Macro-level productivity gains from AI over

Estimated impact on annual growth rates over a 10-year horizon

Note: The bars correspond to different scenarios regarding the adoption, capabilities, and micro-level gains of AI (as in Figure 1). In scenarios 1 and 2, demand is assumed to be relatively elastic, and the factors of production (labour and capital) can reallocate freely across sectors. In scenarios 3-5 with adjustment frictions, demand is assumed to be very inelastic, and factors cannot reallocate across sectors. See more details in section 3 of Filippucci, Gal and Schief (2024).

The aggregate productivity gain from AI is the sum of three effects: 1) a direct effect of increasing productivity at the sectoral level; 2) an input-output multiplier effect as productivity gains in one sector also benefit other sectors through reduced costs of intermediate inputs; and 3) a negative reallocation effect in the spirit of Baumol’s growth disease (Baumol, 1967; Nordhaus, 2008) that arises if the sectors with limited productivity growth increase as a share of GDP.

A key insight that emerges from this analysis is that the macroeconomic impact of AI will depend primarily on the adoption speed and the degree to which AI can benefit economic activities across a wide range of sectors in the economy. Current adoption varies strongly across firms and sectors, with country-level adoption rates being generally low, in the range of 5-15%, as reported by official statistics of businesses and firm-level studies (e.g. Calvino and Fontanelli, 2023). Fast and productive integration of AI in a wider range of economic activities through expanded AI capabilities (e.g. further integration with other digital tools) is necessary for the emergence of large macroeconomic gains (Scenario 2 vs 1).

However, even with high adoption rates and expanded capabilities, general equilibrium effects working through prices could reduce the overall macroeconomic gain if the productivity benefits of AI remain concentrated in a few sectors (knowledge intensive services such as ICT, finance and professional services) (Scenarios 3 and 4). Demand for these services can become saturated, and growth will thus be limited “not by what we do well but rather by what is essential and yet hard to improve” (Aghion, Jones and Jones, 2019). In contrast, macroeconomic gains would be larger if AI gains were more widespread across sectors, for instance in the case of further integration with robotics technology, which would enable not only cognitive but also manual-intensive activities to benefit from AI (Scenario 5).

Overall, AI holds significant promise to revitalise productivity growth in OECD countries and beyond. Governments can also play a role in shaping the macroeconomic gains for AI, for example by resolving legal uncertainties around accountability, which may hold back productive AI adoption by firms (OECD, 2024a). At the same time, governments can foster a competitive environment (both in the AI-using as well as the AI-producing sectors; see Aghion and Bunel, 2024; OECD, 2024b) which is conducive to innovation and experimentation, while monitoring potential labour market disruptions and supporting workers as they transition into new roles in the AI economy (e.g. Acemoglu, Autor and Johnson; Baily, Brynjolfsson and Korinek, 2023; OECD, 2023).

References

Acemoglu, D. (2024) “The Simple Macroeconomics of Artificial Intelligence”, Economic Policy, 2024, eiae042, https://doi.org/10.1093/epolic/eiae042

Acemoglu, D., D. Autor and S. Johnson (2023), Can we Have Pro-Worker AI? Choosing a path of machines in service of minds, MIT Shaping the Future of Work Initiative, Policy Memo, https://shapingwork.mit.edu/wp-content/uploads/2023/09/Pro-Worker-AI-Policy-Memo.pdf

Aghion, P. and S. Bunel (2024), “AI and Growth: Where Do We Stand?”, https://www.frbsf.org/wp-content/uploads/AI-and-Growth-Aghion-Bunel.pdf

Aghion, P., B. Jones and C. Jones (2019), “Artificial Intelligence and Economic Growth”, in: The Economics of Artificial Intelligence: An Agenda, p. 237-82, University of Chicago Press, https://www.nber.org/system/files/working_papers/w23928/w23928.pdf

Agrawal, A., J. Gans and A. Goldfarb (2019), “Economic Policy for Artificial Intelligence”, Innovation Policy and the Economy, Vol. 19, https://doi.org/10.1086/699935

Baily, M., E. Brynjolfsson and A. Korinek (2023), Machines of mind: The case for an AI-powered productivity boom. Brookings Institution, https://www.brookings.edu/articles/machines-of-mind-the-case-for-an-ai-powered-productivity-boom/

Baumol, W.J. (1967). “Macroeconomics of Unbalanced Growth: The Anatomy of Urban Crisis?” The American Economic Review. 57 (3): 415–426. 

Calvino, F. and L. Fontanelli (2023), “A portrait of AI adopters across countries: Firm characteristics, assets’ complementarities and productivity”, OECD Science, Technology and Industry Working Papers, No. 2023/02, OECD Publishing, Paris, https://doi.org/10.1787/0fb79bb9-en.

Filippucci, F., P. Gal and M. Schief (2024), “Miracle or Myth? Assessing the macroeconomic productivity gains from Artificial Intelligence”, OECD Artificial Intelligence Papers, No. 29, OECD Publishing, Paris, https://doi.org/10.1787/b524a072-en

Filippucci, F., P. Gal, C. Jona-Lasinio, A. Leandro and G. Nicoletti (2024), “The impact of Artificial Intelligence on productivity, distribution and growth: Key mechanisms, initial evidence and policy challenges”, OECD Artificial Intelligence Papers, No. 15, OECD Publishing, Paris, https://doi.org/10.1787/8d900037-en.

Lipsey, R., K. Carlaw and C. Bekar (2005), Economic Transformations: General Purpose Technologies and Economic Growth, Oxford University Press, Oxford UK.

Nordhaus, W. D. (2008), “Baumol’s Diseases: A Macroeconomic Perspective”, The B.E. Journal of Macroeconomics, vol. 8, no. 1 https://doi.org/10.2202/1935-1690.1382

OECD (2023), OECD Employment Outlook 2023: Artificial Intelligence and the Labour Market, OECD Publishing, Paris, https://doi.org/10.1787/08785bba-en

OECD (2024a), Recommendation of the Council on Artificial Intelligence, https://legalinstruments.oecd.org/en/instruments/OECD-LEGAL-0449  

OECD (2024b), “Artificial intelligence, data and competition”, OECD Artificial Intelligence Papers, No. 18, OECD Publishing, Paris, https://doi.org/10.1787/e7e88884-en.


Artificial Intelligence: Promises and perils for productivity and broad-based economic growth

By Francesco Filippucci, Peter Gal, Cecilia Jona-Lasinio, Alvaro Leandro, Giuseppe Nicoletti

Recent OECD work discusses the impact of Artificial Intelligence (AI) on productivity, distribution, and growth, highlighting the challenges and conditions to be met before its benefits can be realised (Filippucci et al., 2024). These issues are particularly timely considering weak productivity growth across OECD economies in recent decades (Andre and Gal, 2024) and the widespread enthusiasm and active debate surrounding the growth-potential of AI. Some proponents suggest it might reverse the long-standing productivity slowdown by adding 1-1.5 percentage points of annual growth (Baily, Brynjolfsson, and Korinek, 2023; Artificial Intelligence Commission of France, 2024; Briggs and Kodnani, 2023). Acemoglu (2024), on the other hand, contends that current capabilities can only support moderate macro-level productivity gains, in the order of 0.1% per year.

AI is becoming a general-purpose technology with a transformative impact on a broad range of economic activities, as was the case with computers, the internet or electricity (Agrawal, Gans and Goldfarb, 2019). It is a digital technology that combines software, data and computing power to perform a variety of advanced cognitive tasks, such as content generation, prediction, or even physical tasks (coupled with robotics). It is also characterised by self-improvement (learning) and greater autonomy. These features imply that AI can boost not only the production of goods and services but also the generation of ideas, speeding up research and innovation (Aghion, Jones and Jones, 2018).

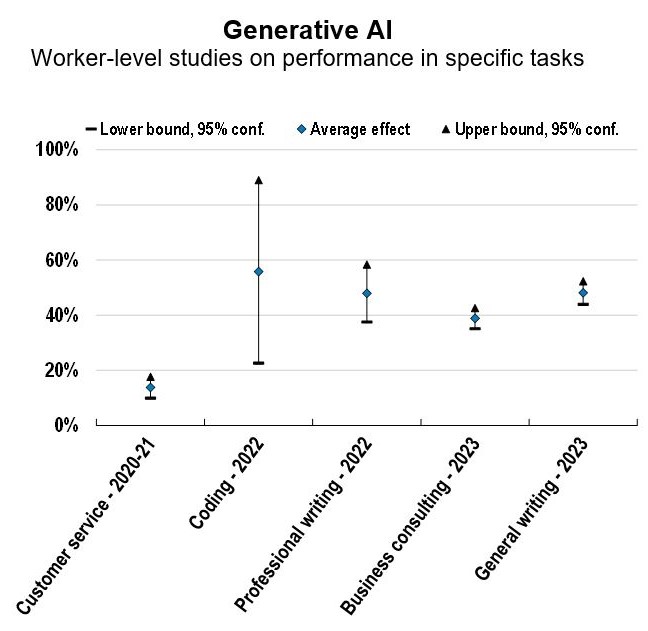
Reviewing the fast-growing literature, initial micro-level evidence covering firms, workers and researchers suggests that AI may stimulate innovation (Van Noorden and Perkel, 2023) and delivers significant productivity and performance benefits. The size of the firm-level productivity gains from pre-Generative AI is comparable to previous digital technologies (up to 10%; see Figure 1, panel on Non-Generative AI). When using more recent Generative AI to assist with various tasks – writing, computer programming or customer service – substantially larger performance benefits have been identified, with widely varying magnitudes depending on the context (in the order of 20-50%; see panel on Generative AI).

Figure 1. The relationship between AI and productivity or worker performance: Selected estimates from the literature

Note: *controlling for other ICT technologies. In the Non-Generative AI panel, “AI use” is a 0-1 dummy obtained by firm surveys, while AI patents refers either to a 0-1 dummy for having at least 1 patent (US study) or to the number of patents in firms (for the EU+UK study, where the average number is 0.48 with 2.6 standard deviation, so that firms cumulating more than one patents are relatively few). Two of the estimates in the panel (“9 countries, 2016-21”) relate to the same study (Calvino and Fontanelli, 2023), but the second estimate controls for other ICT technology use and thus better isolates the marginal impact of AI. Given that the study reports separate estimates for all 9 countries, the median estimate across countries is shown on the Figure.
Source: authors’ compilation from micro level studies.

How these microeconomic gains will translate into macroeconomic productivity growth hinges on the extent of AI adoption, which seems limited to date at less than 5% of firms in the United States (Census Bureau, 2024). It also depends on whether AI-driven automation displaces workers from heavily affected activities; or the human-augmenting capabilities of AI will prevail, underpinning labour demand. Currently, AI exposure varies greatly across sectors: knowledge-intensive, high-productivity activities seem much more affected (Figure 2), with high potential for automation in some cases (Cazzaniga et al, 2024; WEF, 2023). Hence an eventual fall in the employment shares of these sectors would act as a drag on aggregate productivity growth, resembling a new form of “Baumol disease” (Aghion, Antonin and Bunel, 2019).

Figure 2. High productivity and knowledge intensive services are most affected by AI

AI exposure of workers by sector (2019)

Note: The index measures the extent to which worker abilities are related to important AI applications. The measure is standardized with mean zero and standard deviation 1 at the occupation level and then matched to sectors. The figure does not yet include recent Generative AI models.
*Including non-market services, manufacturing, utilities, etc.
Source: Filippucci et al (2024) and OECD (2024) based on (Felten, Raj and Seamans, 2021).

AI-driven threats to market competition and inequality may weigh on its potential benefits. First, the high fixed costs and returns to scale related to data and computing power may lead to excessive concentration of AI development. Second, AI use in downstream applications may also lead to market distortions, especially if it allows first movers to build up a substantial lead in market share and market power. Moreover, AI-powered pricing algorithms have a tendency to charge supra-competitive prices (Calvano et al., 2020), and can also enhance harmful price discrimination (OECD, 2018).          

AI will likely have ambiguous impacts on inequality. The technology has the potential to substitute for high-skilled labour and narrow wage gaps with low-skilled workers, thereby reducing inequalities (Autor, 2024) at least within occupations (Georgieff, 2024). But there are also indications that AI can be associated with higher unemployment (OECD, 2024). On the other hand, AI can also lead to more inclusion and stronger economic mobility by improving education quality and access, expanding credit availability, and lowering skill barriers (e.g. foreign languages).

Further uncertainties surrounding AI include broader societal concerns. More immediate ones relate to privacy, misinformation, and bias (possibly leading to exclusion), while longer-term ones include mass unemployment or even existential risks (Nordhaus, 2021; Jones, 2023).

A comprehensive policy approach is needed to effectively manage these risks and harness AI’s full potential. Immediate priorities involve promoting market competition and widespread access to AI technologies while preserving innovation incentives and addressing issues of reliability and bias. Job displacement, reallocation and inequality impacts might emerge over longer periods, but they require preventive policy action through training, education, and redistribution measures. Policymakers should also devise national and international governance mechanisms to cope with rapid, unpredictable developments in AI.  

Endnote:
The main paper underlying this blog (Filippucci et al, 2024) was developed within the Joint OECD-Italy’s Department of Treasury Project for Multilateral Policy Support.

References:
– Acemoglu, D. (2024), “The Simple Macroeconomics of AI”, https://economics.mit.edu/sites/default/files/2024-04/The%20Simple%20Macroeconomics%20of%20AI.pdf.
Aghion, P., B. Jones and C. Jones (2018), “Artificial Intelligence and Economic Growth”, NBER Chapter in The Economics of Artificial Intelligence: An Agenda, p. 237-28, https://doi.org/10.3386/w23928.
– Aghion, P., C. Antonin and S. Bunel (2019), “Artificial Intelligence, Growth and Employment: The Role of Policy”, Economie et Statistique / Economics and Statistics, 510-511-512, 149–164. https://doi.org/10.24187/ecostat.2019.510t.1994.
– Agrawal, A., J. Gans and A. Goldfarb (2019), “Economic Policy for Artificial Intelligence”, Innovation Policy and the Economy, Vol. 19, https://doi.org/10.1086/699935.
– Andre, C., and P. Gal (2024), “Reviving productivity growth: A review of policies”, OECD Economic Policy Papers, forthcoming.
– Artificial Intelligence Commission of France (2024), “AI, Our Ambition for France” / “IA : Notre Ambition pour la France”, https://www.info.gouv.fr/upload/media/content/0001/09/4d3cc456dd2f5b9d79ee75feea63b47f10d75158.pdf.
– Autor, D. (2024), “Applying AI to Rebuild Middle Class Jobs”, NBER Woking Paper, No. 32140, National Bureau of Economic Research, https://doi.org/10.3386/w32140.
– Baily, M., E. Brynjolfsson and A. Korinek (2023), “Machines of mind: The case for an AI-powered productivity boom”, in The Economics and Regulation of Artificial Intelligence and Emerging Technologies, Brookings, https://www.brookings.edu/articles/machines-of-mind-the-case-for-an-ai-powered-productivity-boom/.
– Briggs, J., and D. Kodnani, (2023), “The Potentially Large Effects of Artificial Intelligence on Economic Growth”, Global Economics Analyst, Goldman Sachs, New York, https://www.gspublishing.com/content/research/en/reports/2023/10/30/2d567ebf-0e7d-4769-8f01-7c62e894a779.html.
– Calvano, E. et al. (2020), “Artificial intelligence, algorithmic pricing, and collusion”, American Economic Review, Vol. 110/10, p. 3267-3297, https://doi.org/10.1257/aer.20190623.
– Calvino, F. and L. Fontanelli (2023), “A portrait of AI adopters across countries: Firm characteristics, assets’ complementarities and productivity”, OECD Science, Technology and Industry Working Papers, No. 2023/02, OECD Publishing, Paris, https://doi.org/10.1787/0fb79bb9-en.
– Cazzaniga, M. et al. (2024), “Gen-AI: Artificial Intelligence and the Future of Work”, IMF Staff Discussion Notes, International Monetary Fund, https://www.imf.org/en/Publications/Staff-Discussion-Notes/Issues/2024/01/14/Gen-AI-Artificial-Intelligence-and-the-Future-of-Work-542379.
– Census Bureau (2024), Business Trends and Outlook Survey, Updated March 28, 2024, https://www.census.gov/hfp/btos/data.
– Felten, E., M. Raj and R. Seamans (2021), “Occupational, industry, and geographic exposure to artificial intelligence: A novel dataset and its potential uses”, Strategic Management Journal , 42(12), p. 2195-2217, https://doi.org/10.1002/smj.3286.
– Filippucci, F., P. Gal, A. Leandro, C. Jona-Lasinio and G. Nicoletti (2024), “The impact of Artificial Intelligence on productivity, distribution and growth: Key mechanisms, initial evidence and policy challenges”, OECD Artificial Intelligence Papers, No. 15. OECD Publishing, Paris, https://doi.org/10.1787/8d900037-en.
– Georgieff, A. (2024), “Artificial intelligence and wage inequality”, OECD Artificial Intelligence Papers, No. 13, OECD Publishing, Paris, https://doi.org/10.1787/bf98a45c-en.
– Jones, C. (2023), “The A.I. Dilemma: Growth versus Existential Risk”, NBER Working Paper, No. 31837, National Bureau of Economic Research, https://doi.org/10.3386/w31837.
– Nordhaus, W. (2021), “Are We Approaching an Economic Singularity? Information Technology and the Future of Economic Growth”, American Economic Journal: Macroeconomics, Vol. 13/1, p. 299–332, https://doi.org/10.1257/mac.20170105.
– OECD (2018), Personalised Pricing in the Digital Era. https://www.oecd.org/competition/personalised-pricing-in-the-digital-era.htm
– OECD (2024), “Labour Market Shortages, Mismatches and Megatrends”, Global Forum on Productivity, forthcoming.
– Van Noorden, R. and J. Perkel (2023), “AI and science: what 1,600 researchers think”, Nature, vol. 621/7980, p. 672-675, https://www.nature.com/articles/d41586-023-02980-0.
– WEF (2023), “Jobs of Tomorrow: Large Language Models and Jobs”, https://www.weforum.org/publications/jobs-of-tomorrow-large-language-models-and-jobs/.


Accelerating the EU’s green transition

By Martin Borowiecki, Economics Department

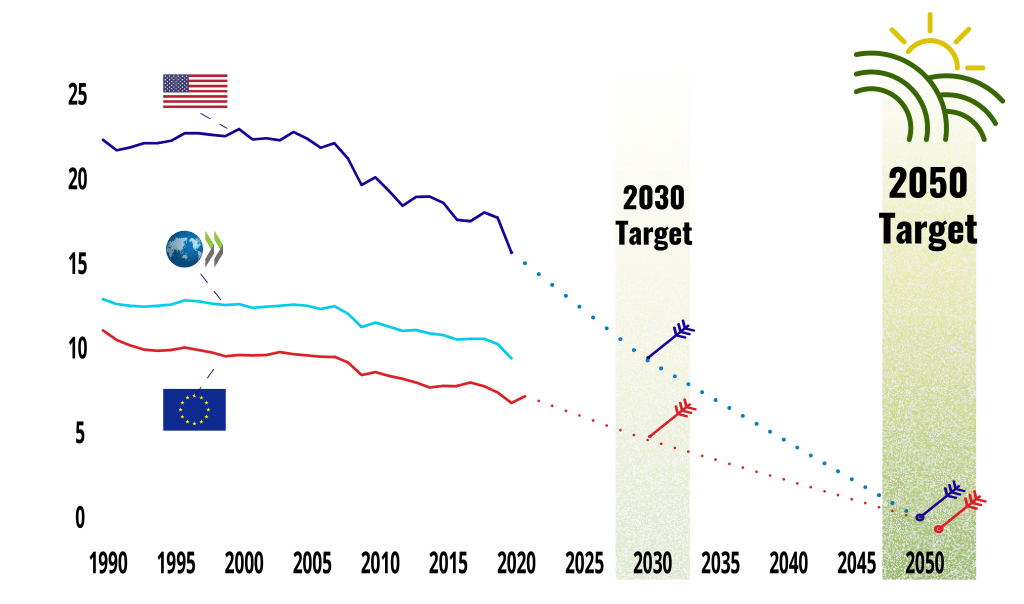
The EU’s Green Deal aims at achieving net zero emissions by 2050. Reaching this target will require a tripling of the rate of emission reductions relative to 1990 and 2020 (Figure 1). More action is needed across all sectors, but particularly in sectors not covered by emission trading, notably agriculture and transport. Reducing emissions in these sectors will rely on regulatory measures and a gradual alignment and raising of carbon prices. Also, more ambitious climate action will entail transition costs. The OECD Economic Survey of the European Union and euro area highlights four main challenges to reduce emissions more cost-effectively and equitably.

Figure 1. Reductions in greenhouse gas emissions need to accelerate

Greenhouses gases emissions

Tonnes of CO2 equivalent per capita

Note: Greenhouse gas (GHG) emissions include those from the land use/land use change and forestry sector (LULUCF). Data on the EU’s GHG emissions for 2021 are taken from the European Environment Agency (2022).

Source: Eurostat; OECD Environment database; OECD Population database; European Environment Agency; and OECD calculations.

Towards more efficient mitigation policies

First, climate change mitigation policy is currently based on a combination of regulations and carbon prices that vary across sectors (Figure 2). The EU’s Emission Trading System (ETS) sets an EU-wide carbon price, but only for energy generation and energy-intensive industry. Other sectors are not covered by the EU-wide carbon price. The uneven coverage of the ETS across sectors imposes heterogeneous abatement incentives across activities, leading to higher costs of achieving climate targets. Moreover, industry continues to receive most emission allowances free of charge. The consequence is that polluters do not necessarily pay the cost of pollution. Addressing the challenge of reducing greenhouse gas emissions requires a gradual alignment and raising of carbon prices together with adopting and implementing standards and regulations.

Figure 2. Carbon pricing differs across sectors and energy uses

Effective energy tax rates across sectors, 2021

Note: Data refers to EU member countries that are also members of the OECD (22 countries). Effective carbon rates (ECRs) have been averaged by sector and energy category. Year of coverage is 2021, taxes as of 1st April 2021. ETS coverage estimates are based on OECD, with adjustments to account for recent coverage changes. Instrument coverage: specific fuel excise taxes, explicit carbon taxes, ETS (Emission Trading System) permit price includes German National ETS besides EU-ETS. No fossil fuel subsidies or other GHG are accounted for. The ETS permit price is the price of tradable emission permits in mandatory emissions trading and cap-and-trade systems representing the opportunity cost of emitting an extra unit of CO₂ equivalent, regardless of the permit allocation method.

Source: OECD (2022), Pricing Greenhouse Gas Emissions: Turning Climate Targets into Climate Action, OECD Series on Carbon Pricing and Energy Taxation, OECD Publishing, Paris, https://doi.org/10.1787/e9778969-en.

To make polluters pay, the OECD recommends to continue expanding the ETS, including to agriculture. In addition, bringing forward the phase-out of free emission allowances would align effective costs of polluting in the ETS.

Ramp up mitigation in agriculture and transportation

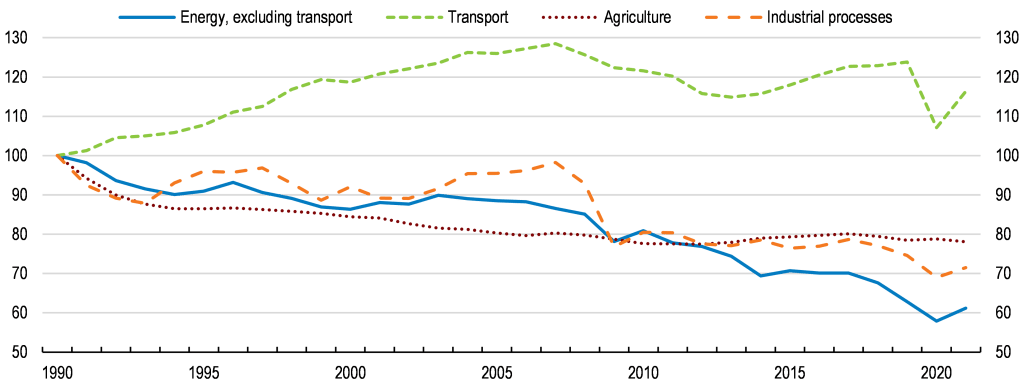
Second, agriculture and transport have contributed little to emissions reduction during the last decade (Figure 3). Reducing emissions in these sectors calls for phasing out environmentally harmful subsidies. In agriculture, direct payments to farmers keep livestock numbers high and promote the agricultural use of drained peatlands, despite their negative impact on the climate. In transportation, more stringent EU vehicle emission standards and an extension of the ETS carbon price to transportation fuels from 2027 will help reduce emissions. However, reduced tax rates and tax exemptions for environmentally harmful fossil fuels, including aviation and maritime fuels, continue to undermine decarbonisation efforts.

Figure 3. Agriculture and transport have contributed little to emissions reduction  

GHG emissions by source sector

index 1990 = 100

Note: Excluding land-use, land-use change and forestry (LULUCF).

Source: OECD Environment Statistics database.

To reduce emissions in agriculture, support for the agricultural use of drained peatlands should be removed, and direct payments for high livestock numbers gradually withdrawn. Withdrawing coupled payments may lead to higher meat prices, which may have an impact on food affordability for low-income households. Hence, withdrawing direct payments should be done gradually. To reduce emissions in transport, minimum tax rates for transportation fuels should be based on energy content and environmental performance, and the tax base broadened by phasing-out exemptions and reduced rates.

Accelerate the energy transition

Third, more integrated wholesale electricity markets are key for the energy transition and achieving energy security. For instance, countries with excess supply of wind and solar can export electricity to meet demand in other countries where supply is short. However, insufficient investment in cross-border electricity grids hampers such integration. Moreover, retail electricity prices are regulated for affordability reasons, often to below-cost levels. Low regulated prices discourage investment in much-needed clean technologies and reduce energy saving incentives.

An important element of the energy transition is affordable and secure clean energy, which requires more integrated electricity markets. To this end, the OECD recommends to increase investment in cross-border grid connections. In addition, the EU should ensure EU countries phase out regulated retail electricity prices to recover costs in the energy sector and encourage investment in clean energy. To help low-income households, government could use well-targeted affordability measures.

Limit the reallocation costs from the green transition

Finally, the green transition will also involve transition costs, including those arising from the reallocation of workers across sectors or regions. EU funding aims to help most affected regions manage the employment effects of the green transition. However, funding for mobility and training could be better tailored to local labour market needs. As regions develop their “Just Transition Plans”, greater efforts are needed to identify and address the drivers of low training and job-to-job transitions.

Concentrating future EU funding on mobility support and training, and making it conditional on labour market outcomes would help to alleviate the socio-economic impacts of the green transition.

References

OECD (2023), OECD Economic Surveys: European Union and euro area 2023, OECD Publishing, Paris


How can Europe catch up on its digital backlog?

By Laurence Boone, OECD Deputy Secretary-General and Chief Economist; Jörg Haas, David Haugh, and Young-Hyun Shin, OECD Economics Department.

With political agreement on two big regulatory reforms – new rules about online content moderation and competition rules for big digital platforms – in the last two months, the European Union is showing that digitalisation continues to be a policy priority despite the geopolitical turmoil related to Russia’s war in Ukraine. The issue certainly requires urgent attention: Covid-19 has resulted in many activities moving online and underlined the importance of innovation. In order to thrive in the future, economies will need to be nimble when it comes to using and producing digital technology. This blog post1 argues that the EU will need sizeable efforts to keep up with the United States and parts of Asia. So far, it lags behind in the skills and innovation needed to reap the benefits of digitalisation and has been “generating” relatively few technology-frontier firms. 

Escaping the low digitalisation trap will demand forceful investment to tackle pre-pandemic weaknesses in digital skills, innovation and tangible capital, as well as pro-competition reforms to encourage the entry and growth of innovative, high potential firms (Andrews, Nicoletti and Timiliotis, 2018; Sorbe et al., 2019). This is also key for the transition to net zero carbon emissions. This transition relies heavily on bringing future technologies to the market. The EU must tackle all its problems faster than it has been used to, because in a digital world “winner takes all” dynamics rapidly widen the gap between those regions who have it and those who do not (Barwise and Watkins, 2018).

Boosting skills and attracting skilled workers

Many Europeans lack the skills necessary to succeed in a rapidly digitalising economy. The OECD Survey of Adult Skills shows 43% of the respondents in participating EU countries having a very low proficiency in the category “problem solving in technology-rich environments” (Figure 1, Panel A), meaning they could not perform simple digital tasks. While the EU shares this challenge with other OECD economies, including the United States, it compares unfavourably in terms of education outcomes. The share of top performers in maths and science is low, especially compared to Asian economies like Korea, but also Canada and Switzerland (Figure 1, Panel B). These deficits in the scientific education system risk making it harder for the next generation of Europeans to find well-paid and highly productive employment opportunities.

Figure 1. Many Europeans lack digital skills

Note: Panel A: Very low or no ICT skills refers to level 1 or lower proficiency in problem solving in technology-rich environments. EU is the unweighted average of the following EU member states: AUT, CZE, DNK, EST, FIN, DEU, GRC, HUN, IRL, LTU, NLD, POL, SVK, SVN, SWE. Panel B: Top performers refer to students who have achieved at least Level 2 in all three core domains and at Level 5 in mathematics and/or science. EU is the unweighted average of EU27 countries. * Data did not meet the PISA technical standards but were accepted as largely comparable. TWN denotes Chinese Taipei.
Source: Survey of Adult Skills (PIAAC) (2012, 2015, 2018), PISA 2018; and OECD calculations.

In addition, while the US makes up for lower skills attainment by attracting highly qualified people from abroad, the EU suffers net outflows of its scientific workforce. It is remarkable that the share of tertiary graduates in STEM is relatively high in the EU (Figure 2, Panel A), but there is a steady stream of scientific authors leaving the EU for countries that offer higher wages or better working conditions, such as Australia, Switzerland, or the United States (Figure 2, Panel B).

Figure 2. The EU struggles to retain talent

Note: Panel A: STEM refers to natural sciences, mathematics and statistics, ICT, engineering and engineering trades. Tertiary education refers to education levels of short-cycle tertiary education, bachelor’s or equivalent level and master’s or equivalent level. EU refers to the 22 EU members that are also members of the OECD. Panel B: EU refers to the 27 member states of the EU.
Source: OECD Education at a Glance, OECD Science, Technology and Industry Scoreboard; and OECD calculations.

The EU performs poorly in digital innovation

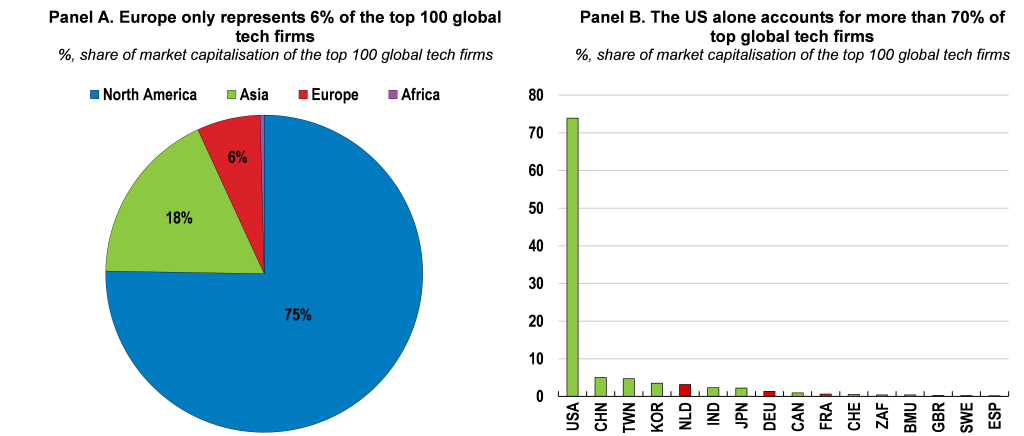
Beyond the human capital factor, the EU is lagging behind in the global race for technological leadership. Today’s tech giants, including Apple, Facebook, Google, Alibaba or Tencent, are dominated by the US and China. Of the 100 largest global tech firms by market capitalisation, the share of European tech companies amounts to only 6%, while the share for the US alone represents 75%, and for the US and Asia combined 93% (Figure 3).

Figure 3. Few tech giants are European

Note: The market value is the average of January 2022 and converted to million USD. Technology firms refer to firms that fall under the category of Computer Services, Internet, Software, Computer Hardware, Electronic Office Equipment, Semiconductors and Telecommunications Equipment. Panel B: TWN denotes Chinese Taipei.
Source: DataStream Global Equity Index and OECD calculations

Insufficient digital investment and research and development (R&D) are at the heart of the issue. European businesses invest significantly less in the tech industry than the United States or Asian economies like China or Korea (Figure 4, Panel A) – and the EU falls behind on important innovation output indicators such as information and communications technology (ICT) patents (Figure 4, Panel B). Bridging this digital investment gap and lack of R&D will be essential to allow the EU to boost innovation, productivity growth and avoid falling behind the curve on the technology front.

Figure 4. Europe needs to pick up digital investment and research

Source: OECD Science, Technology and Industry database.

A lack of innovation may also hamper the EU’s climate ambition

Insufficient investment in innovation, research, and skills also risks obstructing the transition to net-zero emissions (NZE) by 2050, which requires huge leaps in clean energy innovation and the widespread deployment of clean energy technologies.

The EU’s high reliance on energy imports makes its energy-intensive sectors particularly vulnerable to energy supply shocks and energy price rises, as witnessed during the pandemic and war. To secure reliable energy sources and deliver on its climate ambitions, EU economies will need to substantially ramp up clean energy investment and accelerate clean energy innovation (Figure 5, Panel A).

According to International Energy Agency (IEA) scenarios (International Energy Agency, 2021), many clean energy technologies needed to reach CO2 emission reduction targets by 2030 already exist today. However, while some of these technologies are mature, meaning that they are established in the market, many still require increased commercialisation or a wider integration into the market to reach its full market potential (Figure 5, Panel B). In addition, the IEA estimates that by 2050, almost 50% of the emission reductions needed will depend on technologies that are currently under development, i.e. at the demonstration or prototype stage (Figure 5, Panel B). This means that further effort in new technology development, as well as deployment will be needed, in addition to the required tripling of annual clean energy investment already by 2030. These will be essential to bringing new technologies to the market on time and reaching net zero emissions.

Figure 5. To reach climate targets, the EU must accelerate innovation

Note: Panel A: Total final consumption refers to the sum of the consumption in the end-use sectors and for non-energy use, excluding for own use of the energy producing industries, backflows from the petrochemical industry, international aviation bunkers and international marine bunkers. A negative rate indicates a net exporter of energy, while a dependency rate above 100 % means that energy products have been stocked. Panel B: shows global CO2 emissions changes by technology maturity category in the NZE by 2050.
Source: IEA World Energy Balances database; IEA (2021), “Net Zero by 2050”; and OECD calculations.

Increasing tangible investment in the EU

All of the above suggests that only a significant investment effort will be able to achieve the EU’s laudable ambitions, the twin objective of faster digitalisation and a smooth path to net zero. Both public and private capital will have to play an important role in delivering the large amounts of investment needed to make the digital and green transformations a success. The EU should be commended for avoiding the mistakes of the Global Financial Crisis, when public investment spending was cut drastically in an attempt to consolidate government budgets. It activated the Stability and Growth Pact’s escape clause and set up the Recovery and Resilience Facility. With the support of accommodative monetary policy, these measures allowed governments to use fiscal policy to start addressing structural problems and even countries that were hit hard by COVID-19 could increase their productive spending. After a long weakness, public investment in the euro area surged during the pandemic and is now above 2007 levels in volume terms and catching up with the United States (Figure 6, Panel A).

Figure 6. Investment needs to increase in order to meet future challenges

Note: Euro area refers to the 17 members of the euro area that are also members of the OECD.
Source: Economic Outlook 110 database; and OECD calculations.

However, while public investment can crowd in private capital, it accounts for less than a sixth of overall investment. Overall investment has been affected more severely by the pandemic, and has only recently reached pre-GFC levels (Figure 6, Panel B). This is inconsistent with the aspiration to accelerate digitalisation and ultimately increase productivity. In addition, the composition of investment will have to change, with more focus on digital and green technologies for productivity, environmental and security reasons.

A combination of national and EU policies will have to be deployed, including:

  • structural policies at the level of member states to improve their attractiveness as destinations for investment and talent
  • redoubling EU efforts to deepen the capital markets union to enhance return on private investment
  • better EU and national fiscal frameworks to support investment over the short, medium and longer term.

References

Andrews, D., G. Nicoletti and C. Timiliotis (2018), “Digital technology diffusion: A matter of capabilities, incentives or both?”, OECD Economics Department Working Papers, No. 1476, OECD Publishing, Paris, https://dx.doi.org/10.1787/7c542c16-en.

Barwise, P. and L. Watkins (2018), The evolution of digital dominance: how and why we got to GAFA, Oxford University Press, New York, NY. https://doi.org/10.35065/pub.00000914

International Energy Agency (2021), Net Zero by 2050, IEA, https://www.iea.org/reports/net-zero-by-2050.

Sorbe, S. et al. (2019), “Digital Dividend: Policies to Harness the Productivity Potential of Digital Technologies”, OECD Economic Policy Papers, No. 26, OECD Publishing, Paris, https://dx.doi.org/10.1787/273176bc-en.


[1] This blog post is based on an issues note for the Informal Meeting of the EU Ministers for Economy and Finance (ECOFIN) on 25 and 26 February 2022.

Photo credit: Featured image by Gorodenkoff/Shutterstock.com


Will telework persist after the pandemic?

By Pawel Adrjan, Alexandre Judes, Tara Sinclair (Indeed Hiring Lab), Gabriele Ciminelli, Michael Koelle, and Cyrille Schwellnus (OECD Economics Department)

The pandemic has triggered a surge in telework. In a new paper, we analyse developments in online job postings that advertise telework across 20 OECD countries over the past two years. This allows us to provide new insights into the extent and drivers of telework adoption during COVID-19. 

Job postings that advertise telework differ from measures of realised telework: in contrast to realised telework, job postings relate to firms’ future hires rather than telework adoption by their existing workforces. However, online job postings signal firms’ expectations of future developments in telework, and as such provide the best available measure of its medium-term adoption, beyond ad-hoc arrangements adopted during COVID-19 related lockdowns. 

On average across countries, advertised telework more than tripled during the pandemic… 

We find that the average share of remote postings across the countries in the study more than tripled from just 2.5% of job postings in January 2020 to 7.9% in April 2021. Despite the easing of restrictions during the first half of 2021, the average share of remote postings remained near its peak at 7.5% in September 2021 (Figure 1, Panel A). While advertised telework increased almost everywhere, there were notable differences across countries, raising the question of the role of policies and institutions in telework adoption during the pandemic (Panel B). 

Figure 1. Advertised telework more than tripled 

Note: Panel A depicts the average share of job postings advertising telework from January 2019 to September 2021 across 20 OECD countries. Panel B depicts the difference in the average share of advertised telework during the pandemic period (January 2020 to September 2021) and its average share during the pre-pandemic period (2019) for each of the 20 countries.
Source: Adrjan et al. (2021)

Pandemic-driven mobility restrictions were a catalyst for remote work… 

Restrictions to mobility explain about one third of the differences in the rise of remote postings across countries between January 2020 and September 2021. In countries where mobility restrictions were high, such as Ireland, Italy, Spain or the United Kingdom, the share of remote work increased significantly more than in countries where restrictions were low, such as Japan and New Zealand (Figure 2). 

Figure 2. Government restrictions boosted advertised telework

Note: The Figure relates the Oxford Covid-19 Government Response Stringency Index to the pandemic change in the share of job postings advertising telework. The government restriction index is calculated as the mean value of the Oxford Stringency Index over January 2020 to September 2021. The change in advertised telework during the pandemic refers to the change in advertised telework during the pandemic.
Source: Adrjan et al. (2021)

but the easing of government restrictions has so far not reduced advertised telework 

Our econometric analysis suggests that advertised telework responds strongly to tightening government restrictions but only weakly and temporarily so to easing restrictions. In other words, government-imposed mobility restrictions appear to durably drive up advertised telework even once they are fully lifted. 

The weak response of advertised telework to easing restrictions is overwhelmingly driven by countries with high levels of digital infrastructure, suggesting that telework will be particularly persistent in digitally well-prepared countries. 

For instance, in Italy, where internet penetration is relatively low, the share of remote work increased by more than 9 percentage points from January 2020 to April 2021 but decreased by five percentage points in the following five months as restrictions were eased. In contrast, in the United States, where internet penetration is high, the share of teleworkable job postings increased by about seven percentage points between January 2020 and January 2021, at the peak of restrictions, and remained at about that level during the subsequent period of easing, suggesting that companies permanently integrated remote work into their organisation rather than treating it as a temporary remedy. 

Conclusion: Telework is likely here to stay 

In sum, our analysis suggests that government-imposed mobility restrictions have catalysed telework. But the easing of restrictions has so far not triggered an equivalent reduction, even during the first half of 2021 when, in many countries, the easing occurred in the context of rapidly rising vaccination rates and was thus perceived to be more persistent than in 2020. This suggests that remote work is here to stay even once the pandemic recedes. 

In order to benefit from the possible diffusion of remote work in the coming years, public policies should try to make the most of its potential effects on productivity and well-being. This may include ensuring that workers have a suitable working environment (e.g. computer equipment, office and childcare facilities), facilitating the dissemination of best management practices (e.g. moving from a culture of presenteeism to an output-oriented assessment of worker productivity) or ensuring that everyone has access to a fast, reliable and secure internet connection (e.g. in rural areas). 

Reference 

Adrjan, P., et al. (2021), “Will it stay or will it go? Analysing developments in telework during COVID-19 using online job postings data”, OECD Productivity Working Papers, No. 30, OECD Publishing, Paris, https://doi.org/10.1787/aed3816e-en


Spurring growth and closing gaps through digitalisation in a post-COVID world: Policies to LIFT all boats

By Mauro Pisu, Christina von Rüden, Hyunjeong Hwang and Giuseppe Nicoletti, OECD Economics Department

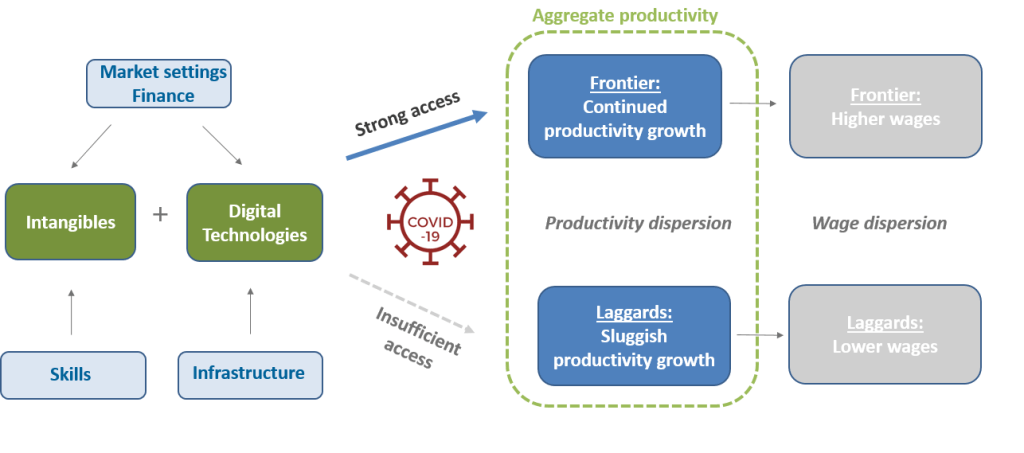
Over the past decades, policy makers across OECD countries faced the double challenge of a marked slowdown in productivity growth and a large increase in inequality. This happened despite the seemingly rapid emergence of digital technologies, which have the potential to boost productivity growth and living standards. This new study shows that the productivity slowdown, rising income dispersion and fast digitalisation are linked: they can be traced back to differences across firms and households in access to digital technologies and the complementary knowledge, embodied in intangible investments, which is necessary for digital technology adoption. The study stresses that broad-based policy support would help to spur growth and narrow the divides in digitalisation, productivity and incomes.

The key for understanding the link between the productivity slowdown, rising income dispersion and fast digitalisation is that intangible assets are costly and difficult to finance, especially for less productive firms and SMEs. While the high productive firms can afford and benefit from intangible assets, the low productivity firms much less so, and therefore are set to lose ground relative to the best performers. Ultimately, differences in access to technology and intangibles translate into both rising productivity differences across firms and rising cross-firm dispersion in average wages, which largely depend on the firms’ average productivity. This in turn not only drags down aggregate productivity growth but also contributes to overall wage inequality (Figure 1).

Figure 1. Linking digitalisation, productivity and income gaps

Source: OECD.

Indeed, gaps between firms at the global productivity frontier and productivity laggards increased dramatically over the past two decades, especially in intangible-intensive sectors where complementarities with digital technologies are strong (Figure 2).

Figure 2. Productivity dispersion and its link with wage dispersion

Evolution of productivity dispersion (difference between frontier and laggards) grouped by intangible intensity (2000=100)

Source: Corrado et al. (2021 forthcoming), New Evidence on Intangibles, Diffusion and Productivity, OECD publishing, Paris.

Broad-based, equitable and growth-enhancing digital transformation requires action spanning several policy areas at once. Policies that help to close productivity gaps across firms by broadening the digital transformation and raising the productivity of laggard firms offer a double dividend: they contribute to sustain aggregate productivity and to close wage and income gaps.

The COVID-19 pandemic has added new opportunities for accelerating productivity-enhancing digitalisation. For instance, lockdowns and social distancing requirements have increased the use of online platforms (OECD, 2020), raising resilience during the crisis and foreshadowing future productivity benefits, especially for SMEs and less productive firms, which benefit most from the use of platforms. It also caused a surge in telework, with real time surveys suggesting that the phenomenon is likely to survive the crisis. The added flexibility that telework allows might also raise productivity in activities where stronger telework is feasible and sustainable.

In addition to making use of these opportunities, the paper proposes a multipronged policy approach to durably accelerate the diffusion and uptake of digital technologies across all layers of society, and share their benefits more widely. The building blocks of the proposed LIFT approach are the following:

  • Lifelong learning for all. Skills are crucial to adopt and effectively use digital technologies. Building effective and inclusive lifelong learning programmes is key to ensuring everybody has the opportunity to acquire and upgrade the skills needed to thrive in a digital world. Boosting adult learning programmes and on-the-job training schemes, and better integrating digital tools into school curricula are key steps to this end.
  • Intangibles finance. Supporting intangible investments requires not only financial market reforms to facilitate their funding with private equity and their collateralisation for bank credit, but also specific policies for the development, upgrade and diffusion of managerial and workers’ skills.
  • Framework conditions. These should provide firms with the right incentives and access to markets, including via the updating of competition and regulatory policies to the digital age and easy access to digitalised public services via e-government and open data.
  • Technology access via infrastructure. Policy should support the development and access to quality ICT infrastructure, as such infrastructure is the basis for the take up and effective use of all kinds of digital technologies.

Only a comprehensive, coordinated and well-monitored policy approach at the national level, coupled with initiatives at the international level to establish common principles, share best practices and foster robust cooperation among relevant agencies, can ensure that OECD economies succeed in spurring growth and closing gaps through accelerated and widespread digitalisation in the post-COVID world.

References:

OECD (2020), “The Role of Digital Platforms in Weathering the COVID-19 Shock, OECD Policy Responses to Coronavirus (COVID-19)”, http://www.oecd.org/coronavirus/policy-responses/the-role-of-online-platforms-in-weathering-the-covid-19-shock-2a3b8434/.

Pisu, M., et al. (2021), “Spurring growth and closing gaps through digitalisation in a post-COVID world: Policies to LIFT all boats”, OECD Economic Policy Papers, No. 30, OECD Publishing, Paris, https://doi.org/10.1787/b9622a7a-en.