Strengthening pro-growth reforms in Argentina 

Man at work, wearing protective stuff, handling boxes in a warehouse in a car factory in Campana, Buenos Aires, Argentina

Read the Spanish version here.

By Adolfo Rodríguez Vargas and Priscilla Fialho 

Argentina has taken decisive steps to stabilise its economy and address long-standing macroeconomic imbalances. Macroeconomic instability has been one element holding back growth, but more structural factors can also help explain Argentina’s declining labour productivity, which has reduced the economy’s growth potential to just 0.5% annually (Figure 1). Argentina has begun to tackle these structural factors through ambitious reforms across a wide range of policy areas. The 2025 OECD Economic Survey of Argentina reviews advances and pending challenges and presents policy recommendations to further boost productivity and growth. 

Figure 1. Securing reform momentum can revive productivity growth  

GDP per person employed, constant 2021 purchasing power parity $, Index 2011 = 100 

Note: OECD is an average of OECD countries. Latin America is an average of Argentina, Brazil, Chile, Colombia, Costa Rica, Mexico and Peru.  
Source: World Bank World Development Indicators. 

Making domestic markets more competitive  

For decades, high entry barriers have reduced competition in key sectors and regulations have placed high financial and administrative burdens on Argentinian firms. Recent reforms to make regulations more competition-friendly and reduce entry barriers have improved the business environment (Figure 2). The implementation of silence-is-consent rules, the streamlining of procedures and requirements in many sectors including agriculture and retail, and the removal of unjustified technical requirements for industrial products have been key elements of these reforms. Entry barriers have also been lowered in network sectors like transport and communications. Rent controls and other price controls have also been scaled back.

Estimates presented in the OECD Economic Survey suggest considerable potential output gains from the regulatory reforms that have been achieved so far. By 2050 output is expected to be 2.7% higher compared with a situation where regulation would have remained as in 2018. Implementing further reforms over the coming decade to align regulations OECD best practice could boost incomes by another 6.8%. 

But more can be done to strengthen competition in domestic markets. The Economic Survey focuses particularly on entry barriers in services sectors and administrative burdens for establishing new firms. Barriers to entry imposed by provincial governments persist in several professional services, retail activities still face many restrictions, and entrepreneurs must cope with time-consuming procedures when starting their businesses. The Survey also recommends to systematically assess the effects of regulatory changes on competition to avoid collateral damage on competition from the design of new rules. Establishing an independent competition authority, as mandated by law, could create strong momentum for promoting competition. 

Figure 2. Making regulations more competition-friendly can boost productivity and employment

Product Market Regulation overall indicator 
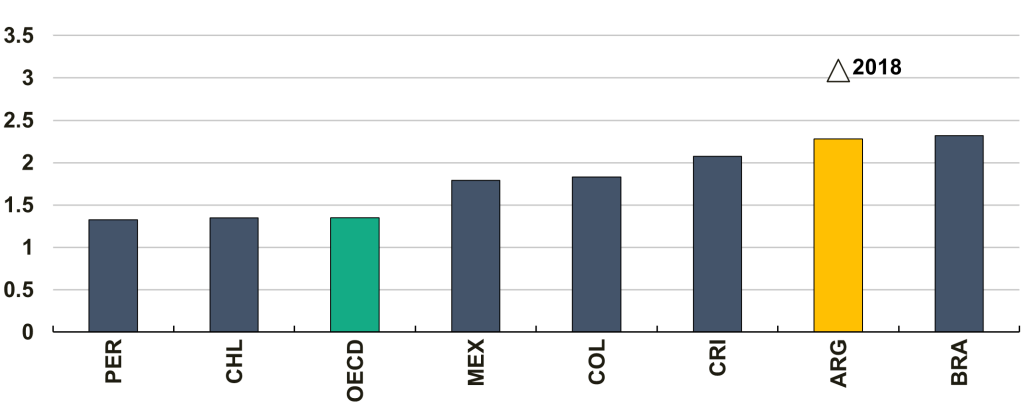
Note: Product Market Regulation overall indicator (0 = best – 6 = worst). Data reflect laws and regulations that were in force by January 1st, 2025 for Argentina; by January 1st, 2024 for Hungary, the Netherlands, the US, Bulgaria, China, Cyprus, Indonesia Malta and Peru; and by January 1st, 2023 in all other countries. 
Source: Product Market Regulation OECD-WBG database. 

Tearing down trade barriers 

Argentina trades relatively little with other countries for an economy of its size, and participates little in global value chains. Enhancing its integration into the world economy would allow firms to access higher-quality inputs and technology, potentially boosting their productivity.   

Recent reforms have included reductions in trade barriers, including through measures in  trade facilitation. A special tax on all imports has been eliminated, and tariffs on many products have been significantly reduced, including consumer goods and industrial inputs. Non-tariff barriers have also been reduced or even dropped entirely. A cumbersome non‑automatic import licensing regime has been scrapped and technical requirements have been eased for many products. Barriers to exports have also been lowered, although export taxes remain in place for some major exported goods. One area where further progress could support stronger export performance is the quality of trade logistics, which remains below the OECD mean and has deteriorated. 

The Economic Survey discusses possible ways to promote further integration into world markets. These include further tariff cuts, especially on intermediate inputs and capital goods, and continuous adjustments of non-tariff trade barriers, like unwarranted technical regulations. Phasing out export taxes should also be a priority, especially as other public revenue sources can be mobilised. The one-stop shop for foreign trade could be further enhanced by ensuring interoperability and data exchange between customs and other agencies to cover all export-related procedures. Continuing to work towards the full implementation of free trade agreements can also open even more markets to Argentinian producers and expose domestic producers to the discipline of international competition. Reducing remaining foreign equity ceilings can help to increase Argentina’s attractiveness for foreign direct investment, which has fallen short of other emerging-market economies (Figure 3). 

Figure 3. Argentina needs to increase its attractiveness to FDI 

FDI inward positions, 2023 

Notes: Data exclude Special Purpose Entities (SPE).LAC6 is an unweighted average, and the OECD is a weighted average. 
Source: OECD database – FDI main aggregates, BMD4. 

Improving infrastructure, skills and judiciary efficiency 

Further improvements in competitiveness could result from reforms to tackle low judicial efficiency, by investing in digital skills and infrastructure and promoting alternative dispute resolution schemes. Streamlining administrative procedures at the local level can help to accelerate digital infrastructure deployment and encourage digitalisation. Strengthening the integrity of the public sector, for example by updating the Public Ethics Law and ensuring systematic consultations of the Anticorruption Office by government agencies, can support ongoing efforts in the fight against corruption. 

Much has been achieved in a short period of time, but only by maintaining the current reform momentum can Argentina live up to its economic potential and lift incomes in a durable manner. 

For more information, please visit the OECD’s Economic Snapshot of Argentina webpage.

References

OECD (2025), OECD Economic Surveys: Argentina 2025https://doi.org/10.1787/27dd6e27-en, OECD Publishing, Paris.


Greater fiscal prudence would help sustain growth in the Netherlands

The Hague, Netherlands

Scrapping the most inefficient expansionary measures
and further enhancing the fiscal framework would contribute to preserving sound public finances.


By Daniela Glocker and Nicolas Gonne, OECD Economics Department

Sound public finances have largely contributed to the resilience of the Dutch economy. Years of fiscal discipline allowed the country to build up substantial budgetary buffers. These enabled the government to support households and businesses during recent downturns. They also provide the fiscal space needed to implement structural reforms.

However, current budgetary plans reflect a shift in priorities, towards increasing purchasing power in the short run and away from policies that support productivity, enhance competitiveness, and accelerate the green transition. The deficit is projected to widen from 0.9% of GDP in 2024 to 2.3% in 2025 and 2.8% in 2026 (Figure 1).

Figure 1. Public finances are projected to deteriorate

General government fiscal balance (% of GDP)

Source: OECD Economic Outlook: Statistics and Projections (database).

Should it not correct its course, the Netherlands could face a “Significant Deviation Procedure” under the preventive arm of the EU Stability and Growth Pact. Such a scenario is unlikely, as the government is strongly committed to remaining in compliance with EU Treaty limits for deficit and debt levels, and because supply bottlenecks often led to underspending in recent years. Yet, proactive fiscal adjustments would provide greater policy certainty and credibility, as discussed in the latest OECD Economic Survey of the Netherlands.

Budgetary plans should aim at expanding supply, not boosting demand

The fiscal stance is expansionary, with significant increases in spending on healthcare and housing, and with lower revenue from personal, corporate, and environmental taxation. Several new spending and tax measures are costly and lack targeting, including the reduction in out-of-pocket payments for medical care and the introduction of a new, lower-rate bracket for personal income taxation.

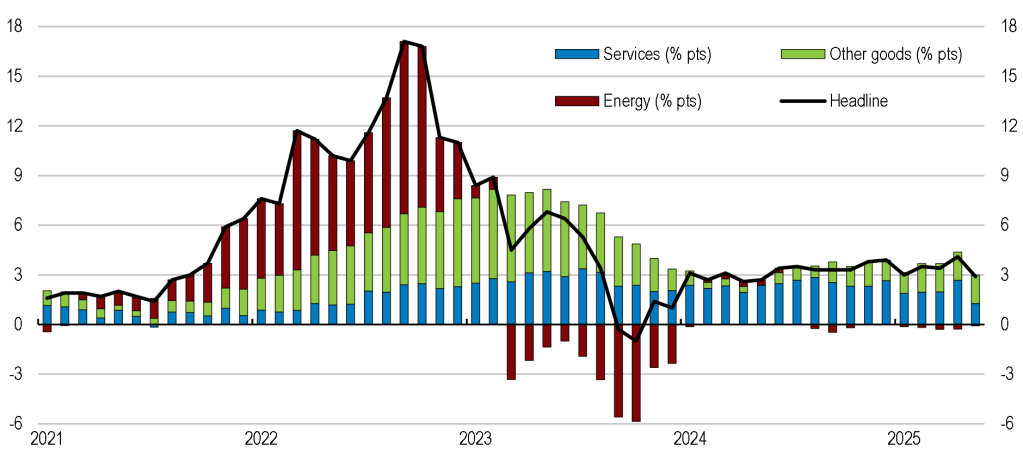
The expansion risks exacerbating inflationary pressures given persistent supply constraints, most notably the tight labour market. Labour costs have been rising relatively quickly since the post-pandemic recovery, pushing up the cost of labour-intensive services and contributing to elevated inflation (Figure 2). Further supply bottlenecks include electricity grid congestion, skills mismatch, and the knock-on impact of the nitrogen crisis. At the same time, spending cuts on education and R&D, while partially offsetting the fiscal cost of expansion, will weigh on growth potential and productivity.

Figure 2. Wage-driven price pressures remain

Contributions to consumer price inflation (y-o-y % change)

Source: OECD Eurostat Harmonised Index of Consumer Prices (database).

Fiscal prudence is key to supporting the economy and sustaining growth, by avoiding excessive demand stimulus and promoting supply-side expansion. Scrapping the most inefficient expansionary measures should be a priority. Reallocating expenditure towards efficiency-enhancing public investments would further promote growth potential, while reconsidering proposed cuts to public spending on knowledge, skills, and innovation would further help productivity, an increasingly pressing challenge for the Dutch economy.

Fiscal reforms are necessary to safeguard sound public finances

Under current budgetary plans, the fiscal balance is expected to deteriorate steadily over the medium run, particularly from 2029 onwards. This is despite the Dutch trend-based fiscal framework, which has been instrumental so far in maintaining fiscal space while enabling automatic stabilisers to fully operate –a particularly important feature to absorb global shocks in an open economy like the Netherlands’.

Most aspects of Dutch multi-year fiscal strategy are regarded as best practice under the OECD Spending Better Framework. However, the expenditure framework is fixed over the government’s term, while budgetary measures are announced on an annual basis. This limits the framework’s ability to address long-run fiscal pressures and can create incentives to postpone politically difficult but necessary decisions on revenue-raising measures and spending cuts.

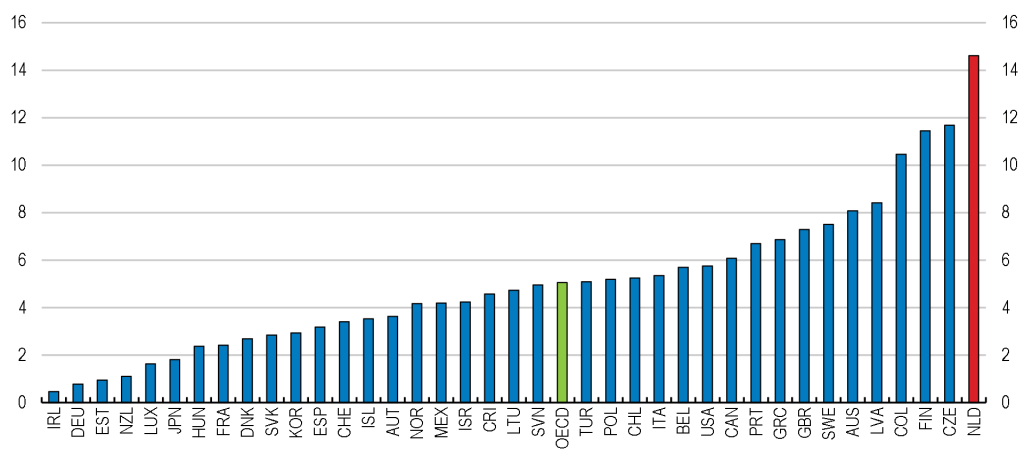
Rolling forward expenditure ceilings every year to keep a constant spending horizon would provide greater predictability, enhance transparency, and further support fiscal sustainability, while keeping the benefits of the current framework, including fiscal discipline on the expenditure side and macroeconomic stabilisation on the revenue side. This would be conducive to greater fiscal prudence, creating the conditions for achieving a balanced combination of revenue-raising measures and targeted spending cuts, including by reducing inefficient tax expenditures (Figure 3).

Figure 3. There is room to streamline tax expenditures

Tax expenditures (% of GDP), 2024 or latest available year

Source: Global Tax Expenditure Database.

For more information, please visit our Netherlands Economic Snapshot page.

REFERENCES

Borowiecki M., J. Pareliussen, and D. Glocker (2021), “Chasing the frontier: Digitalisation for stronger productivity in the Netherlands”, OECD Economics Department Working Papers, No. 1680, OECD Publishing, Paris, https://doi.org/10.1787/e800ee1d-en.

CPB (2025), “Centraal economisch plan 2025 [Central economic plan 2025]”, Netherlands Bureau for Economic Policy Analysis, The Hague.

OECD (2025), OECD Economic Surveys: The Netherlands 2025, OECD Publishing, Paris, https://doi.org/10.1787/2dd1f4aa-en.

Gonne, N. (2023), “Lifting labour supply to tackle tightness in the Netherlands”, OECD Economics Department Working Papers, No. 1771, OECD Publishing, Paris, https://doi.org/10.1787/df5448fe-en.


Argentina: Consolidando la recuperación económica 

Biking through one of Beunos Aires' many parks

Por Priscilla Fialho y Jens Arnold 

Blog para el lanzamiento del Estudio Económico Argentina 2025. También disponible en inglés.

En las últimas décadas, Argentina no supo desarrollar su potencial económico, y su crecimiento quedó por detrás de muchos pares regionales. El gasto público superó continuamente la capacidad de recaudar, y sucesivos gobiernos siguieron recurriendo a la creación de dinero para cubrir la brecha. Esto alimentó la inflación, comprometió la estabilidad macroeconómica y redujo la confianza de los inversores y los consumidores. Controles de capital, restricciones a la importación y racionamiento de divisas se introdujeron en varias ocasiones para evitar mayores crisis financieras y económicas, pero a expensas de deprimir el crecimiento de la productividad, reducir el empleo y los ingresos reales, y aumentar la pobreza.  

Reconociendo que la debilidad de los fundamentos fiscales estuvo a la raíz de la inestabilidad macroeconómica de Argentina durante años, una nueva administración se embarcó en un impresionante proceso de consolidación fiscal en 2024. Desde entonces, se han registrado superávits primarios casi todos los meses, algo que la Argentina no había visto en décadas. El ajuste fiscal en 2024 alcanzó más del 5% del PIB. La historia tiene pocos ejemplos de un proceso de consolidación fiscal tan grande y ninguno de los intentos de estabilización anteriores de Argentina logró reducir las vulnerabilidades fiscales de manera tan decisiva.  

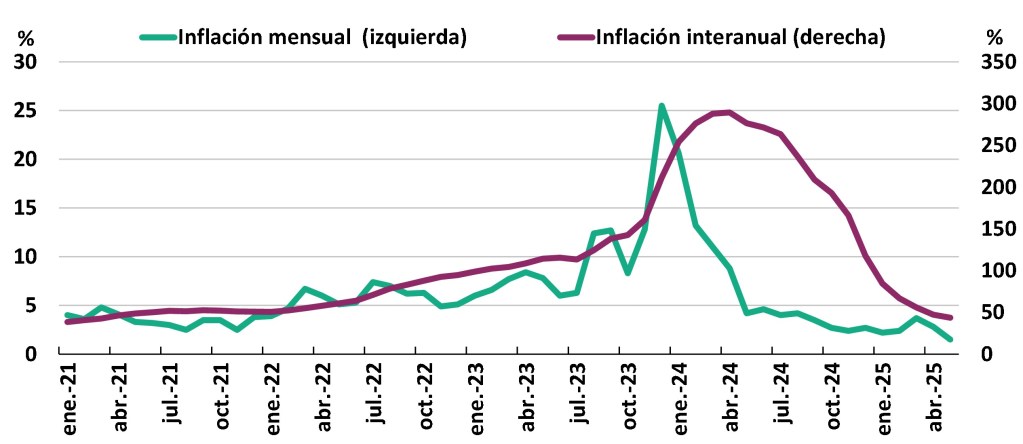
El marcado ajuste fiscal puso fin a años de financiamiento monetario de los déficits fiscales, lo que, junto con las mejoras en el balance del Banco Central, fue fundamental para reducir la alta inflación. La inflación bajó del 211% interanual en diciembre de 2023 a menos del 45% en mayo de 2025. A medida que la inflación retrocedió y se incrementó el gasto social bien focalizado, la pobreza volvió a disminuir a finales de 2024 hasta situarse por debajo de los niveles observados en 2022. Los aumentos de los salarios reales respaldaron la recuperación del consumo privado y la inversión, lo que ayudó a impulsar el crecimiento.  

Gráfico 1. La inflación ha caído a niveles no vistos en años 

Argentina: La inflación ha caído a niveles no vistos en años
Fuente: Banco Central de la República Argentina. 

Además, se han adoptado medidas de política estructural para mejorar el entorno empresarial y volver la Argentina más atractiva para la inversión. Por ejemplo, para simplificar la regulación, se ha introducido en los procedimientos administrativos una norma de que el silencio equivale consentimiento. Con el fin de promover la competencia, se han simplificado varios procedimientos de autorización, registro e importación en los ámbitos de la agricultura, el transporte y el comercio al por menor. También se han eliminado gradualmente los controles de precios, mientras que las barreras comerciales se han reducido para una serie de productos. 

Para hacer frente a las vulnerabilidades externas, en abril de 2025 se puso en marcha un nuevo régimen cambiario con un tipo de cambio flotante dentro de bandas que se ampliarán cada mes. El nuevo régimen mejorará la resiliencia a los shocks externos, al tiempo que fortalecerá la confianza económica. Un programa recientemente aprobado por el FMI de 20.000 millones de dólares apoyará las reservas internacionales a corto plazo, hasta que los cambios estructurales favorezcan mejores perspectivas para las cuentas externas.  

Los esfuerzos de reforma han comenzado a dar frutos, y la economía se encamina hacia a una sólida recuperación en los próximos dos años. Argentina entra ahora en una nueva etapa, que requerirá un ajuste de sus políticas para mantener la prudencia fiscal de manera duradera y, al mismo tiempo, impulsar el crecimiento potencial. El Estudio Económico de la OCDE sobre Argentina 2025 propone varios temas de reflexión.  

A pesar de las recientes mejoras, el gasto público en Argentina sigue siendo alto en comparación internacional y aún hay margen para mejorar la eficiencia del gasto. Una opción para seguir avanzando es seguir recortando los subsidios ineficientes. Los subsidios a la energía se implementaron después de la profunda crisis económica de 2001-02 a través de una combinación de limitación de precios y una amplia compensación gubernamental a los proveedores de energía. Estos subsidios han tenido efectos distributivos principalmente regresivos. Además, al crear una brecha entre el precio pagado por los usuarios finales y los costos de producción, reducen los incentivos para ahorrar energía. Los subsidios a la energía se han reducido progresivamente en 2024, pero aún representan alrededor del 1% del PIB. Continuar eliminándolos y reorientar parte de los recursos fiscales hacia formas más eficientes de protección social mejoraría la eficiencia del gasto.  

La eliminación gradual de los impuestos más distorsivos, introducidos a lo largo de los años para financiar aumentos continuos del gasto público y responder a las necesidades de financiación a corto plazo, ayudaría a mejorar la eficiencia fiscal y favorecería una asignación de recursos más eficiente en toda la economía. La eliminación gradual de estos impuestos requiere identificar fuentes alternativas de ingresos, a fin de mantener los esfuerzos de consolidación fiscal en curso. La ampliación de las bases impositivas sobre los ingresos y el consumo, y la mejora del cumplimiento del impuesto sobre el valor agregado, podrían ser soluciones. Los ingresos por impuestos sobre los ingresos personales representan solo el 2,5% del PIB en 2022, en comparación con el 8,6% del PIB en los países de la OCDE. Un mínimo no imponible alto, que supera el salario promedio y hace que solo alrededor del 10% de la población activa pague impuestos sobre los ingresos personales, explica la mayor parte de la diferencia. Además, Argentina tiene exenciones del impuesto sobre los ingresos personales y otras deducciones fiscales generosas que son inusuales en la comparación internacional.  

Gráfico 2. Los ingresos por impuestos sobre la renta son bajos en comparación internacional

Argentina: Los ingresos por impuestos sobre la renta son bajos en comparación internacional
Fuente: OCDE Estadísticas de ingresos; MECON, Secretaría de Hacienda, Subsecretaría de Ingresos Públicos. 

El federalismo fiscal argentino siempre se ha caracterizado por un importante desequilibrio entre los recursos propios de las provincias y sus gastos. En 2022, las provincias llevaron a cabo el 42,2% de todo el gasto público, mientras que sus ingresos propios representan solo alrededor del 16% de los ingresos públicos totales. En respuesta, se ha desarrollado un complejo sistema de transferencias intergubernamentales. Sin embargo, a lo largo del tiempo la distribución de las transferencias entre las provincias no ha respondido a los cambios en el nivel de demanda de servicios públicos entre las provincias y hoy parece arbitraria. Tan pronto como las finanzas públicas se hayan fortalecido de manera más duradera, Argentina podría fortalecer el vínculo entre los recursos y las necesidades de gasto entre las provincias. Esto reduciría la necesidad de transferencias discrecionales a las provincias, que con frecuencia se han utilizado para fines políticos. 

Es necesario reconocer y elogiar el renovado compromiso de la Argentina de abordar las debilidades y distorsiones de larga data. El impulso de las reformas debe continuar para mantener a la economía argentina en una senda de crecimiento sólido, lo cual es esencial para elevar los niveles de vida de manera duradera. 

Para más información, visite la página web de la OCDE Panorama económico de Argentina.

Referencia

OECD (2025), OECD Economic Surveys: Argentina 2025https://doi.org/10.1787/27dd6e27-en, OECD Publishing, Paris.


Argentina: Consolidating the economic recovery 

Biking through one of Beunos Aires' many parks

Blog post accompanying the launch of the 2025 Economic Survey of Argentina. Read the version in Spanish here.

By Priscilla Fialho and Jens Arnold

Over the last decades, Argentina has struggled to realise its economic potential as growth fell behind many regional peers. Public spending continuously exceeded revenue capacity, and successive governments kept resorting to money creation to fill the gap. This fuelled inflation, compromised macroeconomic stability and weighed on investor and consumer confidence. Capital controls, import restrictions, and foreign currency rationing were introduced on several occasions to avoid major financial and economic crises, but at the cost of depressing productivity growth, reducing employment and real incomes, and increasing poverty.  

Recognising that weak fiscal fundamentals have been at the core of Argentina’s macroeconomic instability for years, a new administration embarked on an upfront fiscal consolidation process in 2024. Primary surpluses have been recorded almost every month since, something Argentina had not seen for decades. The fiscal adjustment in 2024 reached more than 5% of GDP. History holds few examples of such a sharp fiscal consolidation process and none of Argentina’s previous stabilisation attempts managed to reduce fiscal vulnerabilities so decisively.  

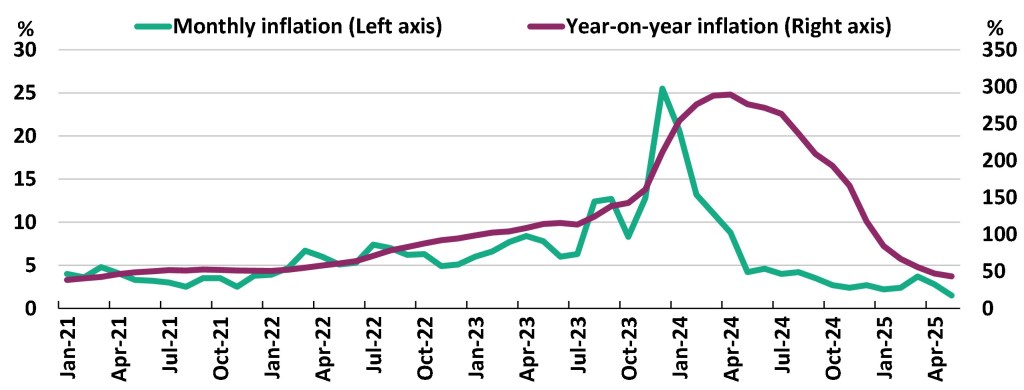
The marked fiscal adjustment put an end to years of monetary financing of fiscal deficits, which together with improvements in the central bank’s balance sheet, was instrumental for taming high inflation. Inflation fell from 211% year-on-year in December 2023 to less than 45% in May 2025. As inflation receded and well-targeted social spending has been scaled up, poverty decreased again at the end of 2024 to below levels observed in 2022. Real wage gains supported the recovery of private consumption and investment, helping to boost growth.  

Figure 1. Inflation has fallen to levels not seen in years 

Argentina: Inflation has fallen to levels not seen in years 
Source: Banco Central de la República Argentina. 

In addition, structural policy measures have been taken to improve the business environment and Argentina’s attractiveness for investment. For example, to simplify regulation, a silence-is-consent rule has been introduced in administrative procedures. To promote competition, several authorisation, registry and import procedures have been streamlined in the areas of agriculture, transport and retail trade. Price controls have also been phased out, while trade barriers have been scaled back for a series of products. 

To address external vulnerabilities, a new exchange rate regime was put in place in April 2025, allowing the exchange rate to float within bands that are set to widen every month. The new regime will improve resilience to external shocks, while also strengthening economic sentiment. A recently approved IMF programme of USD 20 billion will support international reserves in the short term, until structural changes favour better prospects for external accounts.  

Reform efforts have started to bear fruit, and the economy is set for a robust recovery in the next two years. Argentina is now entering a new phase, which will require further fine-tuning of its policies to maintain fiscal prudence in a durable way while also boosting potential growth. The OECD Economic Survey of Argentina 2025 proposes several avenues for consideration.  

Despite recent improvements, Argentina’s public expenditure remains high in international comparison and there is still scope for enhancing spending efficiency. One avenue for further progress is to continue cutting back inefficient subsidies. Energy subsidies were implemented after the deep economic crisis of 2001-02 through a combination of price caps and broad-based government compensation to energy providers. These subsidies have had mostly regressive effects on income distribution. Moreover, by creating a gap between the price paid by end-users and production costs, they reduce incentives to save energy. Energy subsidies have been progressively scaled back in 2024, but still represent about 1% of GDP. Continuing to phase them out while redirecting some of the fiscal resources to more efficient forms of social protection would improve spending efficiency.  

Phasing out the most distortionary taxes, introduced over the years to finance continuous increases in public spending and respond to short-term financing needs, would help enhance tax efficiency while also favouring a more efficient allocation of resources across the economy. Phasing out these taxes requires identifying alternative revenue sources, to safeguard on-going fiscal consolidation efforts. Broadening income and consumption tax bases, and improving Value-Added tax compliance, could be potential solutions. Personal income tax revenues amounted to only 2.5% of GDP in 2022, compared to 8.6% of GDP in OECD countries. A high basic allowance, which exceeds the average wage and results in only about 10% of the active population paying personal income taxes, explains most of the difference. In addition, Argentina has Personal Income Tax exemptions and other generous tax deductions that are unusual in international comparison.  

Figure 2. Revenues from taxes on personal income are low in international comparison 

Argentina: Revenues from taxes on personal income are low in international comparison 
Source: OECD Revenue Statistics; MECON, Secretaría de Hacienda, Subsecretaría de Ingresos Públicos.  

Argentina’s fiscal federalism has always been characterised by a significant imbalance between provinces own resources and their expenditure. In 2022, provinces carried out 42.2% of all public expenditures, while own-revenues of provincial governments account only for about 16% of total public revenues. A complex system of intergovernmental transfers has been developed in response. However, the distribution of transfers across provinces has not responded to changes in the level of demand for public services across provinces over time and appears arbitrary by now. As soon as public finances have strengthened more durably, Argentina could strengthen the link between resources and spending needs across provinces. This would reduce the need for discretionary transfers to provinces, which have frequently been used as a political bargaining chip. 

Argentina’s renewed commitment to tackling long-standing weaknesses and distortions needs to be recognised and praised. The reform momentum needs to continue to maintain Argentina’s economy on a solid growth path, which is essential to lift living standards in a durable manner. 

For more information, please visit the OECD’s Economic Snapshot of Argentina webpage.

References:

OECD (2025), OECD Economic Surveys: Argentina 2025https://doi.org/10.1787/27dd6e27-en, OECD Publishing, Paris.


Overcoming persistent obstacles to growth in South Africa

By Nikki Kergozou and Lilas Demmou, OECD.

South Africa, under the Presidency’s Operation Vulindlela, has embarked on bold reforms to address key obstacles to economic growth. Keeping this reform momentum is critical: GDP growth has averaged only 0.7% per year over the past decade. The persistently sluggish pace of GDP growth has failed to significantly raise GDP per capita, expand labour market participation, or improve living standards for the majority of South Africans. The economy’s high emissions intensity presents an additional challenge, as renewed growth may amplify environmental pressures.

In this context, the new 2025 OECD Economic Survey of South Africa (OECD, 2025) contains four main messages:

  1. The macro-economic policy framework needs to be strengthened to make the economy more resilient.
  2. Transforming the electricity sector to ensure energy security is vital for economic growth and would, in addition, facilitate the green transition.
  3. Greater inclusion of South Africans in the labour market is essential for social cohesion and poverty reduction.
  4. The prospect of higher growth requires speeding up reforms to reduce emissions.

An enhanced macro-economic framework is a prerequisite for stronger sustainable growth. South Africa’s 3-6% inflation target is high and its mid-point is well-above that of other major trading partners. Lowering the inflation target and considering reducing the band around it would help achieve lower inflation and support competitiveness. Public debt has surged from 31.5% of GDP in 2010 to a projected 77% in 2025 (National Treasury, 2025) and rising debt-servicing costs of around 5% are squeezing fiscal space, limiting the government’s capacity to finance social programmes and public investment. Stricter spending controls through reinforced spending rules, and improved governance would help improve the fiscal position and eventually reduce debt. Enhancing the efficiency of tax services, while raising value-added and property taxes, would also contribute to increase revenue collection.

A key structural reform to ensure that growth can be higher in a sustainable way is to ensure that electricity provision is sufficient for businesses to operate. Power outages, or “loadshedding” were estimated to have reduced economic growth by 1.5 percentage points in 2023 (SARB 2024). In addition to directly reducing efficiency, a loss of confidence in the electricity system weakens incentives to invest and deters new market entrants. Significant progress has been made but a lot remains to be done to put electricity outages behind us. Priority should be given to establishing a competitive wholesale electricity market, expanding the transmission grid, and improving municipality’s capacities to deliver electricity effectively. Reforms to municipal management and financing should prioritise earmarking electricity revenues to reduce cross-subsidisation, enhancing property tax collection and exploring distribution concessions.

Many South Africans struggle to find work: the country has the lowest employment rate and the highest unemployment rate among G20 economies. Reforms are needed to help firms create more jobs and to also help workers better connect with job opportunities. Restrictive regulations constrain firms’ ability to enter the market and expand, limiting job creation. Urban sprawl and insufficient public transport lead to lengthy, expensive commutes that pose challenges for workers to connect with employment. Promoting densification, and prioritising housing near public transport and development corridors would help.

As reforms leading to higher growth would put upward pressure on greenhouse gas emissions, South Africa will face additional challenges in meeting its climate goals. In addition, the country is highly vulnerable to the changing climate. A greener economy requires higher carbon prices, an enhanced policy framework for faster implementation of policies, and improved public transport so that people use their cars less often. In parallel, adaptation to climate change needs to be accelerated, notably by reducing the severe under resourcing of municipalities, who have a key role to play in climate policies.

References


Boosting EU productivity through a stronger Single Market

3 young adults running with the EU flag

By Martin Borowiecki and Federico Giovannelli, Economics Department

Strengthening productivity remains a key challenge

Productivity has grown more slowly in the EU than in the United States. Since 2000, labour productivity growth in the EU has been on average half a percentage point lower each year than in the United States (Figure 1, panel A).

Productivity developments have been particularly weak in the largest EU economies. In contrast, some Northern as well as Central and Eastern European countries recorded stronger productivity growth. Nevertheless, productivity levels in Central and Eastern Europe remain relatively low (Figure 1, panel B).

The productivity growth difference compared to the United States is mainly due to the services sector (Figure 2). In particular, productivity growth in the information and communication sector, as well as in professional services, has been weaker in the EU. These are two sectors that make strong use of digital technologies. This reflects industry structure as well as the greater ability of U.S. companies to develop and utilise digital technologies. In contrast, the EU has made significantly less use of the benefits of digital technologies (van Ark, O’Mahony and Timmer, 2008; Schivardi and Schmitz, 2019).

Overall, investment as a share of GDP is relatively high in the EU, which is due to high residential investment. In contrast, productivity-enhancing investments (excluding residential investment) – as shown in Figure 3 (panel A) – have grown less dynamically than in the United States since the early 2000s. In particular, after the financial crisis, investment rates between the EU and the United States began to diverge significantly.

The divergence in investment spending is mainly due to lower expenditures on intellectual property, particularly on research and development (R&D) as well as information technologies (Figure 3, panel B). This affects all sectors but is especially pronounced in information and communication technology. It reflects the higher R&D spending of U.S. high-tech companies as well as their larger size. In contrast, business R&D spending in the EU tends to be concentrated in medium-tech sectors such as the automotive industry. The lower level of innovation activity in the EU, along with the specialisation in medium-technology sectors, has contributed to the EU falling behind the United States, and increasingly China, in cutting-edge technologies such as artificial intelligence (Filippucci, Gal and Schief, 2024; Fuest et al., 2024).

One factor behind the weak innovation activity in Europe is weak business dynamism and the low level of investment in young innovative companies. Firm entry and exit rates have been declining in both the manufacturing and services sectors (Figure 4). Promoting the growth of successful companies and the market entry of new firms is crucial to fully unlock the potential of the private sector and to boost innovation and productivity growth.

The Single Market is key for productivity

A more integrated Single Market will be key to boost productivity. Market integration is particularly low in the services sector (Figure 5). A fragmented Single Market puts European companies at a disadvantage, as firms in larger markets can achieve economies of scale more easily and tend to be more productive and innovative.

In its latest Economic Survey of the EU and euro area, the OECD provides policy recommendations to boost productivity (OECD, 2025).

First, a more integrated Single Market with fewer regulatory barriers for businesses would strengthen productivity. Well-designed EU regulations can reduce compliance costs for companies in the Single Market compared to the inefficiencies of fragmented national rules. However, in practice, a growing EU regulatory burden is slowing down business dynamism. Subjecting EU regulatory proposals to rigorous cost-benefit analysis would help reduce the EU regulatory burden, including documentation requirements and reporting obligations for businesses. In addition, a common EU corporate law (“28th regime”) would help innovative firms scale, strengthen dynamism, and set minimum standards for registration and bankruptcy.

Another challenge is the still relatively low labour mobility within the EU. Cross-border labour mobility is hindered by limited mutual recognition of qualifications. To this end, mutual recognition of qualifications should be improved, and all unjustified and disproportionate restrictions on professional services removed.

Third, a deepening of European capital markets would also help to promote productivity growth. Capital markets in the EU remain underdeveloped. The fact that the high savings rates in the EU do not translate into productive investments is partly due to the insufficient risk appetite of the predominantly bank-based financial system. In particular, young and innovative companies suffer from the lack of alternatives to bank loans. Strengthening competition in savings and investment products could help deepen the pool of long-term capital available for investment. This could be paired with a stronger uptake of privately funded pensions to strengthen the institutional investor base.    

Fourth, while the EU’s science base is strong, a major weakness lies in the translation of science into breakthrough innovation. However, EU-level public R&D spending is limited. This makes it all the more important that EU public R&D expenditures are consistently targeted at addressing this innovation deficit. This calls for rigorous evaluations of R&D programmes based on clear key performance indicators, closing underperforming programmes, and shifting funding to well-performing programmes.

Finally, unilateral national industrial policies pose risks to the Single Market. The EU announced to make the state aid framework simpler and more flexible to support investment in strategic sectors until 2030. Such an approach to industrial policy raises risks for the Single Market as countries with more fiscal space may provide excessive support. To protect the level playing field within the Single Market, state aid rules should not be relaxed.

For more information about the latest OECD Economic Survey of the European Union and euro area, please visit the economic snapshot page.

References

Filippucci, F., P. Gal and M. Schief (2024), “Miracle or Myth? Assessing the macroeconomic productivity gains from Artificial Intelligence”, OECD Artificial Intelligence Papers, No. 29, OECD Publishing, Paris, https://doi.org/10.1787/b524a072-en.

Fuest, C. et al. (2024), EU-Innovation Policy: How to Escape the Middle Technology Trap?, Policy Report of the IEP/TSE/EconPol-CESifo European Policy Analysis Group.

OECD (2025), OECD Economic Surveys: European Union and Euro Area 2025, OECD Publishing, Paris, https://doi.org/10.1787/5ec8dcc2-en.

Schivardi, F. and T. Schmitz (2019), “The IT Revolution and Southern Europe’s Two Lost Decades”, Journal of the European Economic Association, Vol. 18/5, pp. 2441-2486.

van Ark, B., M. O’Mahony and M. Timmer (2008), “The Productivity Gap between Europe and the United States: Trends and Causes”, Journal of Economic Perspectives, Vol. 22/1, pp. 25-44.


What has been holding back investment?

By Dennis Dlugosch, Max Glanville, John Hooley, Fatih Ozturk and Ben Westmore, OECD.

Despite strong corporate profits and historically low financing costs, investment has remained subdued across many OECD economies since the Global Financial Crisis (GFC), according to our recently released OECD paper. What has been holding it back?

Investment has stalled—why does it matter?

Investment is a key driver of long-term economic growth. Yet since the GFC, real investment has failed to keep pace with pre-crisis trends, weighing on potential output growth. Real investment in both advanced and emerging market economies is still roughly 20% below its pre-GFC trend (Figure 1). Even in economies with relatively strong business investment—most notably the United States—investment remains below its pre-crisis trajectory.

This slowdown reflects both major cyclical shocks—the GFC and the COVID-19 pandemic—and deeper structural forces. Moreover, these effects are interrelated: cyclical downturns can themselves bring structural change by inflicting lasting ‘scars’ on firm balance sheets, labour-market dynamics and patterns of technological adoption.

For business investment, weak demand is only part of the puzzle

In the wake of the GFC and pandemic, aggregate demand fell sharply, discouraging firms from expanding capacity. While demand has partially recovered, business investment has not. Analysis using a simple investment ‘accelerator’ model shows that subdued demand explains about one-third of the shortfall in business investment (Figure 2, Panel A). The rest is an unexplained “gap” deriving from non-demand factors weighing on investment.

The size of these unexplained gaps differs by country, from relatively low gaps, in the case of Japan and Finland, to gaps of above 30 percent of predicted investment, in the case of Australia, Korea, and the Netherlands (Figure 2, Panel B).  

Financing costs are low, profits are high. But where are the profits going?

Other traditional explanations for weak investment like high capital costs or weak profitability are not behind the slowdown. Borrowing costs and corporate tax rates have fallen. Tobin’s Q, an indicator of market incentives to invest, has remained above one in many countries, suggesting firms’ returns on investments exceed their costs. At the same time, corporate profits have surged, but businesses are investing less of their earnings in fixed capital.

Instead, firms have been accumulating financial assets or returning funds to shareholders in the form of dividends or share buybacks. In many countries, the corporate sector has shifted from being a net borrower to a net lender, meaning firms are saving more than they are investing. High “hurdle rates” suggest firms demand very high returns before committing their capital, possibly due to perceived risk or reduced competitive pressures.

Uncertainty is a major factor holding back investment

Policy-related uncertainty has risen steadily since 2016, which can discourage long-term investment. Firms tend to delay or scale back projects when they perceive uncertainty to be high. OECD estimates suggest that uncertainty may explain up to one-sixth of the investment shortfall across OECD countries, or one-quarter of the unexplained gap. And the outlook is not great; uncertainty indicators have increased dramatically since late 2024 and recent survey evidence suggests that perceived uncertainty is increasingly a major obstacle to business investment.

The digital transition and intangible economy are changing the nature of investment

Investment patterns have shifted toward digital and knowledge-based assets, such as software, data, and R&D. These assets now account for over 35% of business investment across OECD economies, up from 28% in 2000. Investment in digital capital has been particularly strong in tech-intensive industries, particularly in firms specialising in the use of artificial intelligence.

But digital assets come with challenges. They depreciate faster, meaning more investment is needed just to maintain the capital stock. Digital assets are also more difficult to finance externally, because of their limited use as collateral. These challenges push firms, especially smaller ones, to rely on retained earnings and limits investment capacity.

Market power and declining business dynamism may be reducing the pressure to invest

Another relevant part of the puzzle is the rise in market concentration and the decline in business dynamism observed across many advanced economies. As market concentration increases, investment becomes more heavily concentrated among a few large firms, while competitive pressures weaken. In this context, dominant players may prefer to buy back shares or acquire competitors rather than invest in new capacity, especially when faced with limited competition or regulatory uncertainty.

Housing investment has been lagging, leading to affordability issues

Residential housing investment has also slowed in recent decades, failing to keep up with rising demand from population growth, urbanisation and increased immigration. This supply shortfall has resulted in persistent affordability problems. Across the OECD, the share of consumption allocated to housing has increased by nearly 3 percentage points since 2000. The low levels of investment likely reflect various supply constraints, including regulatory barriers, increasing construction costs, zoning restrictions, and labour shortages.   

Public policies can help revive investment  

Reviving investment will require a range of public policy reforms tailored to the circumstances of each country. This was reflected in the policy recommendations in the country notes of the June 2025 OECD Economic Outlook. Many of these recommendations focused on promoting stronger business investment, with changes to competition policy the most commonly suggested area for reform (Figure 4). Efforts to address skills shortages, improve access to finance and reduce barriers to foreign direct investment were other priority areas. Outside of the business sector, there is scope to boost housing investment in some economies, with regulatory reforms that include the easing of land-use restrictions and rental market regulations seen to be beneficial in certain countries. Furthermore, high-quality public investment – particularly in green and digital infrastructure, research and development, health, and education – is often needed and can boost potential output growth, especially if it crowds-in private investment spending.

In the current environment of heightened policy uncertainty, improving the general clarity and predictability of economic policies is also crucial for promoting stronger investment rates. Rules-based trade policies, stable fiscal and tax regimes, clear regulatory processes and affirming climate commitments would all help address the substantial rise in policy uncertainty seen over the past decade.

References

Dlugosch, D., M. Glanville, J. Hooley, F. Ozturk and B. Westmore (2025), “Understanding the weakness in business investment: A cross-country analysis”, OECD Economics Department Working Papers, No. 1836, OECD Publishing, Paris, https://doi.org/10.1787/89bd437d-en.

OECD (2025), Economic Outlook June 2025, OECD Publishing, Paris.


Winds of change: The effects of tariffs on equity markets

By Caroline Roulet and Srdan Tatomir

The international trade landscape is changing. The new tariffs introduced by the United States (US) this year up to mid-May are estimated to have raised the effective tariff rate on US merchandise imports to 15.4%, from just over 2% in 2024, the highest rate since 1938 (OECD, 2025). This has led to retaliation from China and, to a more limited extent, Canada. At the same time, indicators of trade policy uncertainty are at the highest levels since 1960 and several magnitudes higher than in 2018-2019 (Caldara et al, 2019).

Higher tariffs and higher trade-related uncertainty are expected to weigh on global trade and economic growth as outlined in the latest OECD Economic Outlook. It will take some time for the full effects of these changes on the real economy to emerge. Financial markets can provide an early signal about the potential impact of trade developments on companies around the world.

During the US-China trade tensions in 2018-2019, the equity prices of exposed companies weakened and this was subsequently associated with lower levels of activity. In the US, equity prices for publicly listed companies exposed to Chinese tariffs experienced a significant and persistent decline following tariff-related policy announcements, with larger declines for firms that were indirectly exposed to higher tariffs through their supply chains (Amiti et al, 2025; Yilmazkuday, 2025). US firms competing with imported Chinese goods benefited from less competition, but the rise in their equity prices was small (Huang et al, 2020). The tariff-related equity price declines were strongly correlated with lower profits and weaker output, employment and productivity levels, and higher perceived risks of corporate default (Amiti et al, 2025; Huang et al, 2020). In China, publicly listed firms exposed to the US also experienced declines in their equity prices (Huang et al, 2020). Higher US tariffs dented firms’ output and employment in Chinese regions more exposed to trade (Chor and Li, 2021).

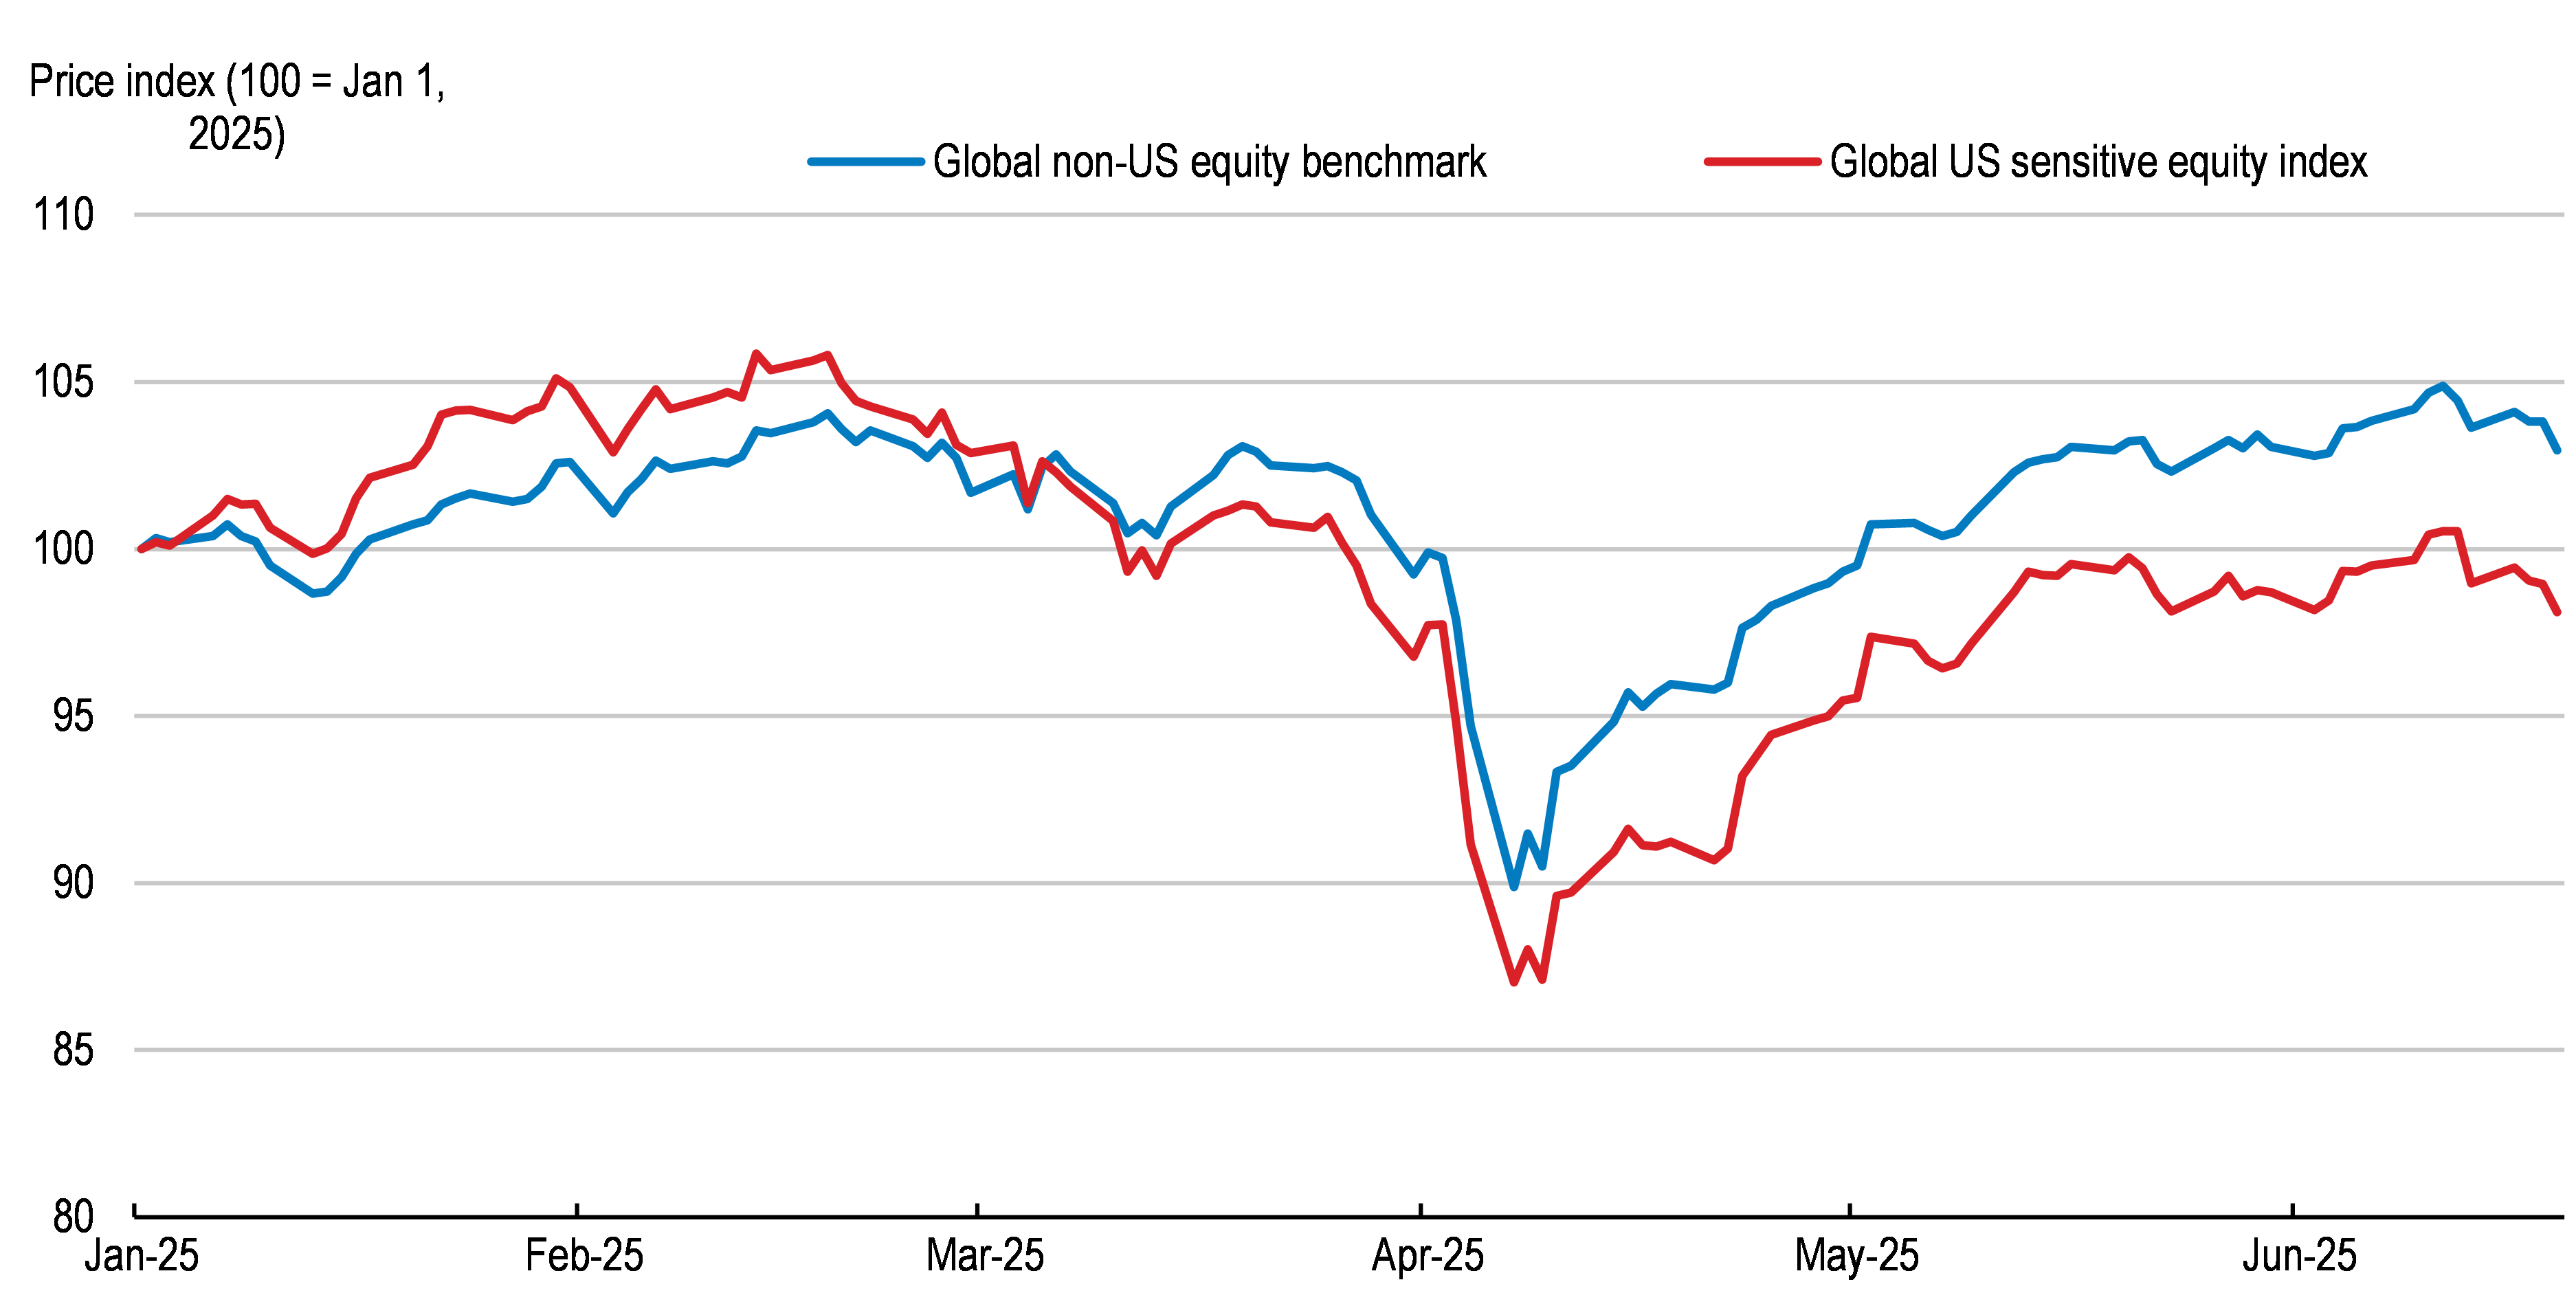
A similar set of concerns have appeared in 2025 in corporate equity markets. The equity prices of foreign companies highly exposed to the US economy have lagged behind the broader market since February. Following the substantial increase in US tariffs announced in April, the gap relative to January 1 widened to around 5 percentage points, which has persisted to date (Figure 1). Publicly listed companies in China, other emerging-market economies and in the Asia-Pacific region have been hit the hardest relative to their respective broader regional benchmarks, with European companies hit to a lesser extent so far (Figure 2).

Figure 1: Equity markets point to weaker performance for companies exposed to the US

Note: Based on data up to 19 June using a sample of 1,884 non-financial corporates in 28 selected advanced and emerging-market economies. The global US exposed index reflects the equity market performance of firms that are particularly sensitive to recent US policy changes, while the global non-US equity benchmark represents the broader non-financial corporate equity market. Exposed corporates are defined as ones with sales in the United States of 20% or more of their total sales. Indices are weighted by market capitalisation.
Source: OECD calculations.

In China, this could reflect the much higher increase in tariffs compared to most other US trading partners, as well as the sizable boost to domestically focused companies from policy support (OECD, 2025). In contrast, risks of a slowdown in growth have affected the equity prices of all companies in North America, resulting in smaller differences between companies exposed to the US and those who are domestically focused. The announced increase in tariffs has been relatively broad across different categories of goods and, when comparing sectors across countries, the negative effects have weighed on equity prices in many of them. However, companies exposed to the US in the discretionary consumer sector have tended to be more strongly affected relative to their respective sectoral benchmark, whereas technology and healthcare companies have seen little impact so far. Imports of pharmaceuticals and semi-conductors have remained exempt from new US import tariffs up to now.

In the United States, US companies with a relatively strong reliance on foreign sales initially traded at a discount in March and April, but the gap with other US companies has subsequently closed and become positive more recently (Figure 3). This could reflect initial expectations of retaliatory tariffs that have generally not materialised so far. Weaker US growth prospects relative to other countries, partly due to high uncertainty as well as higher costs of imported intermediate inputs, might be also disproportionately affecting US companies focused on the domestic market. However, historical experience suggests that the full impact of tariffs and trade-related uncertainty on equity prices develops over time (Adolfsen and Harr, 2025; Yilmazkuday, 2025). US companies are accumulating inventories ahead of anticipated tariff increases but surveys suggest they are already receiving fewer new orders, revising earnings forecasts downwards and scaling back investment plans (OECD, 2025).

Figure 3: Tariff effects have receded in US equity markets

Note: Based on data up until 19 June using a sample of 2,157 US non-financial corporates. Internationally exposed US corporates are defined as those with international sales of 20% or more of their total sales. Corporates that are not internationally exposed have a ratio of international sales to total sales of 0%. The US equity benchmark is the S&P 500 equity benchmark, excluding financials. All indices are weighted by market capitalisation.
Source: OECD calculations.

Overall, there have been clear signs in equity markets of differences across companies according to their potential exposure to tariff barriers, with the equity prices of foreign companies more highly exposed to the US market having underperformed others. As the announced tariffs have been relatively broad, the negative effects have weighed on the equity prices of most companies, but especially ones in the consumer goods sector. The equity prices of US companies with significant international exposure have recovered since falling sharply as tariffs began to be raised, but potential remains for further and unexpected trade policy events to disrupt markets again.

References

Adolfsen, J., F. and T. Harr (2025), Disentangling trade policy uncertainty and equity market performance, VOXEU column, May.

Amiti, M., Gomez, M., Kong, SH, and D. Weinstein (2025), Trade protection, stock-market returns, and welfare, NBER Working Paper No. 28758.

Caldara, D., Iacoviello, M., Molligo, P., Prestipino, A., and A. Raffo, (2019), The Economic Effects of Trade Policy Uncertainty, Journal of Monetary Economics, data retrieved from https://www.matteoiacoviello.com/tpu.htm on June 2, 225.

Chor, D., and B. Li (2021), Illuminating the effects of the US-China tariff war on China’s economy, NBER Working Paper No. 29349. 

Huang, Y., Che, L., Sibo L., and T. Heiwei, (2020), Trade Networks and Firm Value: Evidence from the U.S.-China Trade War, Centre for Economic Policy Research Working Paper DP14173.

OECD (2025), Economic Outlook June 2025, OECD Publishing, Paris.

Yilmazkuday, H (2025), U.S. Tariffs and Stock Prices [forthcoming], Finance Research Letters.


Iceland: Starting the reform engine to maintain high living standards

The unknown bureaucrat statue, Reykjavik

By Hansjörg Blöchliger

Rather small, rather remote, and prone to volcanic shocks — Iceland might not seem predestined for economic success. Yet it has become one of the wealthiest countries in the OECD. The economy is bolstered by a sound macroeconomic framework, a highly skilled workforce, and a culture of innovation. And it is among the most egalitarian in the OECD, thanks to high labour force participation, compressed wages, and well-targeted social benefits.

Growth has slowed, reforms are needed

Yet growth has considerably declined over the past two years. The economy shrank by 0.7% in 2024, down from 5½% growth in 2023, as monetary policy tightened and exports slowed. While momentum is picking up again, risks loom — from global tensions to domestic imbalances.

The latest OECD Economic Survey of Iceland calls for bold reforms. Some are indeed envisaged by the new government and should be taken forward, to keep growth strong and living standards high. Better fiscal policy should be on top of the list. It is often procyclical, amplifying fluctuations in an already volatile economy. Iceland’s budget rules have been on hold since 2019, and deficits are shrinking only slowly. A new spending rule could help smooth economic cycles and put public finances on firmer ground. Restarting spending reviews, notably for education or health care, could also do a lot to underpin prudent fiscal policy.

Inflation has cooled from a high 10% in early 2023 to around 4% in spring 2025 but is still well above the 2.5% target. Housing costs are the main culprit, driving over half of consumer price inflation. Until inflation and inflation expectations have settled around the target, monetary policy needs to stay tight.

Education: a wake-up call

Iceland’s PISA scores have been sliding for two decades, which could jeopardize long-term economic growth and well-being. The gap between native and immigrant students is among the widest in the OECD. The government should reboot the education system with:

  • National assessments of students and schools
  • A sharper curriculum
  • Better teacher training and an improved competency framework
  • More language support for immigrant students.

Powering up the electricity sector

Iceland’s energy security is under pressure. Demand is surging, but the power grid is ageing and at capacity limits. Electricity is no longer so cheap or abundant. Land-use disputes and a tedious licensing process are holding back new generation and transmission projects. A fast-track approval process for key energy projects could restore Iceland’s energy advantage and support its green ambitions.

Unleashing business dynamism

Iceland’s business climate is generally good, but not perfect. Product market regulations are still tighter than in most OECD countries. To boost productivity and innovation, Iceland should:

  • Cut red tape for business licenses
  • Ease restrictions in the professional services
  • Open up to more foreign investment
  • Streamline insolvency rules

Iceland has the capacity to thrive, but it is time to modernize the policy framework. With the right reforms, it can turn the challenges into opportunities.

For more information, please visit the Iceland Economic Snapshot page, where you’ll find more information about the 2025 Economic survey of Iceland.

References

OECD (2025), OECD Economic Surveys: Iceland 2025https://doi.org/10.1787/890dbe05-en, OECD Publishing, Paris.


New time-series data shed light on regulatory trends in energy, transport, and telecoms since 1975

By Cassie Castle, OECD.

The OECD has released the 2023 update of its Energy, Transport & Communication Regulation (ETCR) indicators.

This harmonised annual time series spans from 1975 to 2023 and captures the scope and development of regulatory frameworks in six network sectors: electricity and natural gas; transport by air, road, and rail; and telecommunications by focusing on key dimensions such as barriers to entry; the degree of concentration of market participants; and the degree of public ownership.

The data cover 34 countries, including all OECD members except the most recent additions (Colombia, Costa Rica, Latvia and Lithuania). The ETCR indicators range between 0 and 6, with higher scores reflecting a less competition friendly regulatory framework. For details on how the ETCR indicators are constructed, see the methodology slides here.

Figure 1 presents the ETCR scores over the 50-year period for which data have been collected and shows a marked decline across all six network sectors since the 1980s, reflecting a broad trend toward more competition-friendly regulation across OECD members. The pace of liberalisation was particularly rapid during the late 1990s and early 2000s.

Figure 1. ETCR over time, OECD average

To fully capture the effects of regulation in network sectors, the OECD has also published the Regulatory Impact (REGIMPACT) indicators. The REGIMPACT indicators capture how regulation in network sectors indirectly affects downstream industries that rely on them for intermediate inputs. Given that network sectors supplied approximately 20% of the intermediate inputs used by other industries in 2022, understanding both direct and indirect regulatory impacts is crucial for evaluating their broader economic significance.

REGIMPACT indicators are calculated by combining ETCR indicators with measures of sectoral exposure derived from input-output tables. The time-series is available annually from 1975 to 2023 for the 34 OECD countries covered by the ETCR. The REGIMPACT indicators are calculated for 21 downstream sectors, with coverage varying by country and sector based on data availability.

A recent OECD study uses the updated ETCR and REGIMPACT indicators to assess the long-run impact of pro-competition reforms in network sectors on economic performance. The paper, ”Regulation and growth: Lessons from nearly 50 years of product market reforms” (Andrews et al., 2025), finds that the lack of pro-competitive reforms in upstream network sectors, particularly those aimed at removing barriers to entry, significantly hampers growth in downstream industries.

On average across the OECD, liberalising network sectors between 1980 and 2023 is estimated to have raised labour productivity by around 5 percent cumulatively, driven by gains in value added (6 percent), employment (2 percent), and capital stock (4 percent). Notably, the productivity gains in manufacturing, which relies heavily on inputs from regulated upstream sectors, were more than twice as large.

The study further finds that rapid reforms in the late 1990s and early 2000s added approximately 0.25 percentage points annually to labour productivity growth. As reform momentum slowed, their positive effects weakened, possibly contributing to as much as one-sixth of the slowdown in productivity growth since 2005.

Yet, there is still room for improvement. Countries with more regulated network sectors could still raise productivity by up to 1.7% by aligning with the most liberalised peers. The findings underscore the continued value of pro-competitive reforms, especially where regulatory barriers remain high.

To learn more about the OECD’s Product Market Regulation indicators, please visit the PMR webpage.

References

Andrews, D., B. Égert, C. de La Maisonneuve and C. Castle (2025), “Regulation and growth: Lessons from nearly 50 years of product market reforms”, OECD Economics Department Working Paper No. 1835, https://doi.org/10.1787/3b3285df-en.