Inflation is easing, but growth is slowing. The tightening of monetary policy needed to tackle inflation is taking effect. Despite stronger-than-expected GDP growth in 2023, tightening financial conditions, weak trade, and subdued confidence are taking a toll. Housing markets and bank-dependent economies, particularly in Europe, are feeling the impact.
The pace of growth is uneven. Emerging markets are generally faring better than advanced economies. Europe’s growth lags behind North America and major Asian economies. Inflation, while easing, remains a concern.
We are projecting a soft landing for advanced economies, but this is far from guaranteed. The relationship between inflation, activity and labour markets has changed, making the full impact of monetary policy tightening hard to judge. In the United States, the economy is demonstrating more strength than expected, and there is a risk that inflation proves to be persistent. In the euro area, the full impact of tighter monetary policy is still to appear and activity may be hit more strongly than we expect.
Many emerging markets have shown considerable resilience over the past year, but countries characterised by structural debt vulnerabilities have come under market scrutiny.
Global trade is weak. Not only cyclical, but also structural factors are causing a slowdown in the rate at which value chains are integrating across countries. Opportunities for growth, particularly from greater services trade, are being missed. We must revive global trade. Resilience in global value chains is best delivered by diversification, not by protectionism and inward-looking policies.
In many countries, fiscal pressures are mounting. Demographic changes, decarbonisation, and a combination of rising interest payments and slow growth mean countries face a challenging fiscal outlook. Governments need to take bold action to reduce such pressures and give a greater focus to growth in their policy making. That means reforming labour market and pensions policies, increasing competition, and using fiscal levers to increase human capital and productivity enhancing investment, including the investment needed to deliver the green transition.
In summary, the global economy is grappling with inflation, slowing growth, and mounting fiscal pressures. Policymakers must prioritise macroeconomic stability, structural reforms, smart fiscal policies and international cooperation to foster sustainable and inclusive growth.
L’inflation s’atténue, mais la croissance ralentit. Le resserrement des politiques monétaires nécessaire pour lutter contre l’inflation produit ses effets. Malgré une croissance du PIB plus forte que prévu en 2023, le durcissement des conditions financières, la faiblesse des échanges et la confiance en berne pèsent sur l’activité. Les marchés du logement et les économies tributaires des banques, notamment en Europe, en ressentent les effets.
Le rythme de la croissance est inégal. Les économies de marché émergentes connaissent globalement une situation plus favorable que les économies avancées. La croissance est moins rapide en Europe qu’en Amérique du Nord et dans les grandes économies d’Asie. L’inflation, bien qu’en recul, reste préoccupante.
Nous prévoyons un atterrissage en douceur pour les économies avancées, mais cette issue est loin d’être garantie. La relation entre l’inflation, l’activité et les marchés du travail a changé, si bien qu’il est difficile d’évaluer pleinement l’impact du resserrement des politiques monétaires. Aux États-Unis, l’économie se révèle plus dynamique que prévu, et il existe un risque que l’inflation s’avère persistante. Dans la zone euro, les effets du durcissement de la politique monétaire ne se sont pas encore pleinement matérialisés, et l’activité pourrait être plus fortement touchée qu’on ne l’anticipe.
Nombre d’économies de marché émergentes ont fait preuve d’une résilience considérable au cours de l’année écoulée, mais les pays présentant des vulnérabilités liées à leur endettement structurel sont maintenant surveillés de près par les marchés.
Les échanges mondiaux manquent de dynamisme. Des facteurs non seulement conjoncturels, mais aussi structurels entraînent un ralentissement de l’intégration des chaînes de valeur entre pays. Des opportunités de croissance, liées en particulier à une augmentation des échanges de services, sont inexploitées. Nous devons relancer le commerce mondial. Pour développer la résilience des chaînes de valeur mondiales, il s’agit de promouvoir plutôt la diversification que le protectionnisme ou des politiques de repli sur soi.
Les tensions budgétaires s’accentuent dans de nombreux pays. Compte tenu des évolutions démographiques, de la décarbonation ainsi que de la combinaison d’un alourdissement des charges d’intérêts et d’une croissance lente, les pays sont confrontés à des perspectives budgétaires difficiles. Les gouvernements doivent prendre des mesures audacieuses pour réduire ces pressions et mettre l’accent davantage sur la croissance dans l’élaboration de leurs politiques. Cela signifie qu’il faut réformer les politiques du marché du travail et les systèmes de retraite, intensifier la concurrence et actionner les leviers budgétaires pour accroître les investissements susceptibles de renforcer le capital humain et la productivité, notamment les investissements nécessaires à la transition écologique.
En résumé, l’économie mondiale est aux prises avec l’inflation, le ralentissement de la croissance et la montée des tensions budgétaires. Les décideurs publics doivent donner la priorité à la stabilité macroéconomique, aux réformes structurelles, aux politiques budgétaires intelligentes et à la coopération internationale, pour favoriser une croissance durable et inclusive.
Iceland’s economy is riding high. Since the pandemic, the country’s growth has been one of the fastest of the OECD, driven by exports of energy-intensive goods and services and a strong rebound of foreign tourism. Relying on domestic energy sources, the country has largely been spared the power crisis that has strangled other countries, as shown in the Economic Survey of Iceland.
Unemployment is low and stable at around 3.5%, and labour participation of both men and women is again reaching historical highs. Economic growth is expected to moderate from 6.4% in 2022 to 4.4% in 2023 and 2.6% in 2024, still well above the OECD average.
Inflation remains stubbornly high
Yet everything is not cool in Iceland. Since mid-2022, headline inflation has been hovering at around 10%, much above the central bank’s target of 2.5%. Unlike in continental European countries, Iceland’s inflation surge was initially propelled by house prices. Those shot up by around 50% between mid-2020 and mid-2022, driven by the strong post-pandemic recovery and labour immigration. Inflation is now increasingly transmitted to the wider economy, notably the domestic service sector. Inflation expectations have de-anchored.
Three decades ago, Iceland succeeded in putting an end to entrenched inflation and repeated inflation bursts. It should do so again, tightening monetary policy further as needed to bring inflation back to the target and avoid a wage-price spiral. Fiscal policy should work in the same direction as monetary policy and avoid any stimulus, while limiting support to vulnerable households.
Structural reform could help raise productivity and tame inflation
Over the past few years reforms opened the tourism sectors to more competition. Despite these improvements, barriers to entry, notably for start-ups, are high. Foreign access to the computer service and construction sectors is more restricted than in any other OECD country.Professional licencing requirements were hardly eased as attempts met with resistance from vested interests.
The government should continue its efforts to improve the business climate. Strengthening competitive forces will not only help raise productivity growth – currently at 1%, which is around the OECD average – but also contribute to bring inflation down.
Building on Iceland’s natural capital and reducing carbon emissions
Iceland hosts more tourists per inhabitant than any other OECD country, exerting pressure on infrastructure and the environment. Climate change is altering a part of Iceland’s natural capital such as oceans and glaciers, jeopardising several tourism services. Iceland should continue to develop a balanced strategy for productive and sustainable tourism. It should remove the current tax privileges in the tourism sector, notably the reduced VAT rate, and it should introduce a tourism levy to fund local sustainable tourism infrastructure.
The government has strengthened climate policies over the past two years and carried out thorough cost-benefit analysis of abatement measures. Carbon emissions are declining gradually. Yet per capita emissions remain above the OECD average. The government should strengthen climate action further in a sustainable and efficient manner. It should notably strengthen carbon taxation and prioritise climate actions with low abatement cost per tonne of carbon.
Canada: five messages from the latest OECD Economic Survey
Category: Canada
written by oecdecoscope | November 29, 2023
By Ben Conigrave and Philip Hemmings, OECD Economics Department
Canada’s economy has proved resilient to testing global conditions in the wake of Russia’s invasion of Ukraine. Amid a strong post-pandemic recovery in output and revenues, the federal government stepped up action to improve housing affordability and expand access to low-cost childcare. While Canada’s recent social policy progress is impressive, a major reform challenge remains – to lift tepid growth in productivity and average incomes while also eliminating net greenhouse gas emissions by 2050. Projected economic growth of 1.3% in 2023 and 1.5% in 2024, while avoiding recession, would not close gaps in living standards to better-performing economies. The latest Economic Survey of Canada sets out recommendations aimed at boosting Canada’s growth potential and driving down carbon emissions.
Inflation has fallen from peak levels but is still above target. The main drivers of last year’s surge in consumer prices have abated. Energy price falls and easing tensions in world supply chains have helped reduce headline inflation. Higher borrowing costs have also started to cool domestic demand after a series of large interest rate rises by the Bank of Canada. Still, underlying price pressures remain elevated. Labour market conditions are tight, with the jobless rate near record lows and workers demanding larger-than-usual wage increases. Policymakers face the tricky task of returning inflation to target without creating an economic downturn.
Figure 1. Inflation has passed its peak but remains high
Headline consumer prices, annual increase, %
Note: The Bank of Canada aims to keep inflation close to the 2% midpoint of a control range from 1 to 3% over the medium term. Source: OECD (2022), Main Economic Indicators (database).
Living cost pressures have increased. High inflation has eroded real incomes and is weighing on consumer spending. Governments have stepped in to ease the cost of living. Some measures rightly target support to vulnerable households. For instance, the federal government has temporarily increased goods and services tax (GST) credit payments aimed at those on lower incomes. In contrast, provinces have in some cases introduced across-the-board subsidies to reduce utility bills or cut fuel taxes. Untargeted measures of this sort can be costly, fail to focus support on under-pressure households, and weaken incentives to save energy. A major federal-provincial initiative separately promises to improve access to cheap childcare. Properly implemented, the scheme should help lift employment, particularly among women, supporting higher living standards. At the same time, significant socio-economic gaps still separate Indigenous people and the rest of Canada’s population. Support for Indigenous self-determination needs to continue as part of efforts to close these gaps.
Budget repair has been faster than expected. Commodity export price rises contributed to revenue growth in a high-inflation environment just as pandemic support was ending. Deficits and debt burdens have shrunk despite the federal government extending living-cost relief and launching new programmes to improve the affordability of housing and childcare. But as multi-year spending commitments mount, and revenue tailwinds die down, governments will find it harder to sustain budget improvements. Better spending efficiency could reduce long-term fiscal challenges. Tax system reform will also be important, both for fiscal sustainability and unlocking higher potential output. Shifting the tax mix towards greater use of indirect taxes, and less use of distortive taxes on income, would reduce drags on Canada’s productive capacity. Windfall gains from high commodity prices in 2022 also serve as a fresh reminder of the need for provinces to make more use of stabilisation funds to mitigate boom and bust cycles in their budgets.
Figure 2. The public debt burden is decreasing
Public debt, % of GDP
Note: Data for 2022 are estimates. Gross debt includes general government liabilities in the form of currency and deposits; debt securities, loans; insurance, pensions and standardised guarantee schemes, and other accounts payable. Net debt subtracts financial assets from gross debt. Source: OECD Economic Outlook 112 (database).
More policy focus is needed on productivity-enhancing reform. Population increase, underpinned by high levels of immigration, will continue to be an important driver of growth in Canada’s economy in the years ahead. But long-term improvement in living standards will require higher productivity. Lacklustre productivity growth since 2015 saw gaps in per capita GDP widen between Canada and better-performing economies, including the United States. Reversing this trend, which coincided with weak business investment after the 2014 oil price collapse, demands reform efforts equal to those behind recent social policy advances. Removing barriers to trade between provinces would improve the business environment. Regulations and technical standards impede flows of goods and services across Canada’s internal borders as well as the performance of regional labour markets. Separately, stringent foreign ownership limits in network sectors – including telecommunications – directly restrict foreign direct investment. The rules should be reviewed.
Figure 3. Canada’s investment performance can be improved
Real private non-residential investment
Source: OECD Economic Outlook database.
Strong incentives are needed to decarbonise production. Canada’s resource-intensive economy uses more energy and generates more greenhouse gas emissions per person than most other OECD countries. An ambitious federal government plan aims to change this. Deploying regulations, market-based tools and support for green investment, the government has committed to eliminate Canada’s net emissions by 2050. As well as energy saving in businesses and homes, achieving this goal will require replacement of fossil fuels with clean energy across the economy. For policymakers, the task will be to minimise drags on activity from sometimes overlapping mitigation tools. Higher carbon prices levied uniformly on a larger share of emissions will help ensure an efficient green transition. Canada’s federal and provincial governments must work together to strengthen incentives for low-cost mitigation across key sectors – including electricity, oil and gas, transport and buildings – and prepare communities for fast-changing climates.
Figure 4. Canada’s emission reduction challenge is large
GHG emissions
Note: The solid blue line shows historical GHG emissions. The dotted line shows the emissions reductions required to meet 2030 and 2050 targets along an indicative pathway. The green line shows emissions projections by Environment and Climate Change Canada. Source: Calculations based on OECD (2022), Environment Statistics (database); Climate Action Tracker; and Environment and Climate Change Canada.
If it’s not one thing it’s another: supply and demand factors driving rising inflation
Category: Uncategorized
written by oecdecoscope | November 29, 2023
By Geoff Barnard and Seung-Hee Koh, OECD Economics Department
The rise in inflation over the past two years in economies around the world has created major challenges for policymakers. One key uncertainty in addressing these challenges has been whether the surge in inflation has primarily reflected demand factors or negative supply shocks. That question cannot be answered with a high degree of precision or certainty, but some techniques exist for estimating the contributions of demand and supply factors. The latest OECD Economic Outlook (OECD, 2022) reports on an exercise to do this for eight OECD countries.
The approach applied in that exercise is based on that of the Federal Reserve Bank of San Francisco, which uses US monthly price and volume personal consumption expenditures (PCE) data to distinguish between items where price and volume shocks move in the same direction and those where they go in opposite directions (Shapiro, 2022a and 2022b). Shocks to prices and volumes in a given month are identified by running vector autoregressions (VARs) for the 10-year period ending in that month for prices and volumes of each item and inspecting the residuals of the respective regressions1. The presumption is that price and volume residuals with the same sign reflect demand – greater demand pushes up both prices and volumes and vice versa for lower demand – while residuals with opposite signs correspond to supply shocks – lower supply means a reduction in volume but an increase in price.
In addition to items where price changes are identified as clearly demand-driven or supply-driven, an intermediate range, labelled “ambiguous”, where price and/or volume residuals are too small to be considered significant, is also identified – a threshold is set that results in approximately 20% of movements on average being classified as ambiguous. The contributions of the three categories – demand-driven, supply-driven and ambiguous – sum to total headline PCE inflation.
Other OECD countries do not have matching disaggregated monthly price and volume data for total personal consumption, although several have information for a subset of consumer spending – typically retail trade. An alternative approach is to use detailed quarterly national accounts data for total household consumption expenditure by consumption purpose (COICOP). The degree of quarterly expenditure disaggregation is highest in the United States, where the PCE data have 136 categories, but lower in the other cases: the number of categories available in the quarterly national accounts data for the other seven countries for which this exercise was undertaken in the Economic Outlook varies from 11 for Denmark to 110 for the United Kingdom.
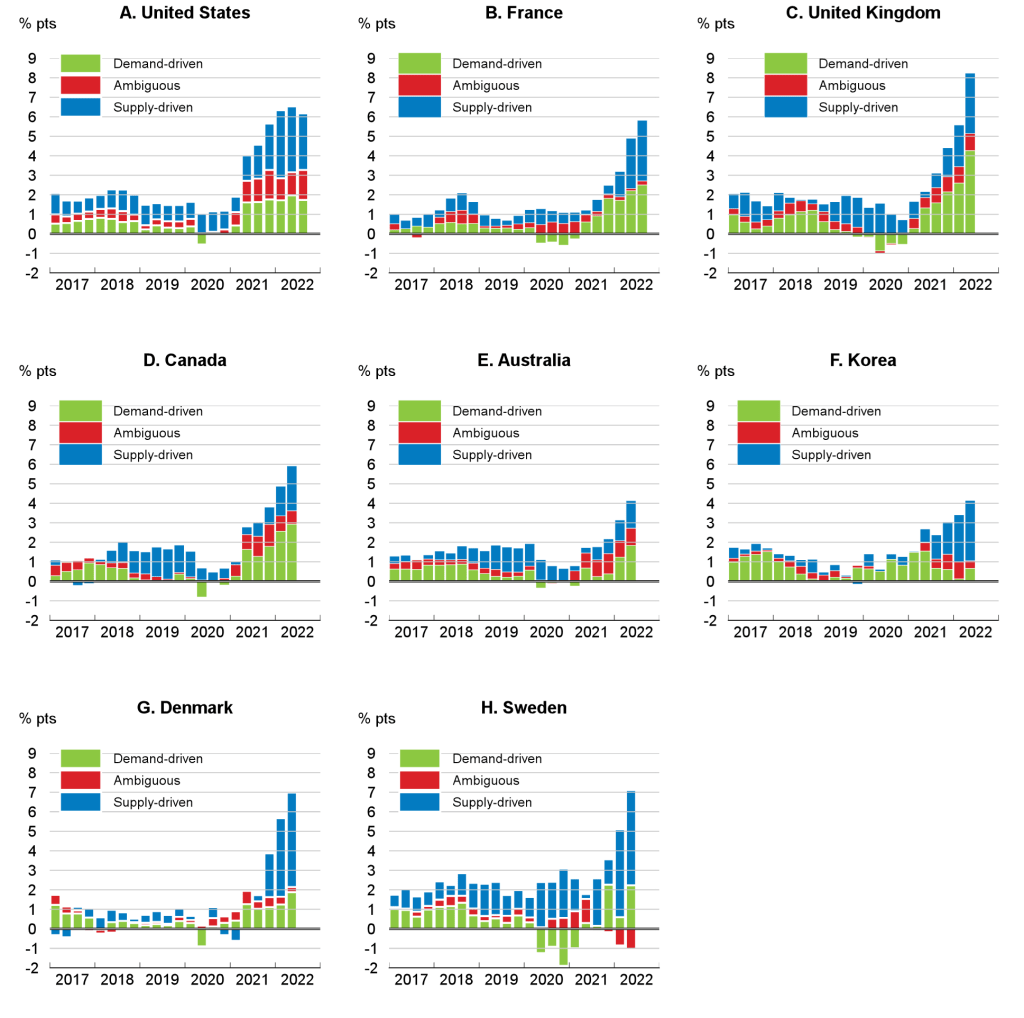
In all countries, both supply and demand factors are found to have pushed inflation up since mid 2020 (Figure 1), highlighting the current difficulties faced by policymakers in assessing the drivers of higher inflation. The proportion of annual headline inflation accounted for by demand-driven items in the second quarter of 2022 ranges from less than one-quarter in Korea to around half in the United Kingdom and Canada. Supply driven inflation is estimated to account for roughly half of total inflation on average in the eight countries shown, but well over half in Denmark, Korea and Sweden. In general, both supply- and demand-driven contributions have increased in recent quarters, with Korea being an exception: there the demand-driven component peaked in the second quarter of 2021 and has subsequently declined. The United States has had a broadly stable demand-driven contribution to year-on-year inflation for several quarters, which is in line with the picture portrayed by the monthly estimates by the San Francisco Fed.
Compared to the immediate pre-pandemic period, when headline inflation was close to central bank objectives in all these economies, the rise of inflation has generally reflected both supply-driven and demand-driven factors. The increase in the contribution of supply-driven inflation has been relatively small in Canada and the United Kingdom. For demand-driven inflation, the increase in the contribution relative to 2019 was largest in the United Kingdom (around 4 percentage points), and also relatively large in Canada and France.
There are several caveats to bear in mind when considering the results of this exercise. First, the method used identifies the price change for each item in a given period as being primarily demand- or supply driven, but in most cases a mix of supply and demand factors will be operating, even when the exercise allocates the item to the demand-driven or supply-driven category. Also, the pandemic period is clearly atypical, with special factors at play which may make the results less reliable. Finally, the difference in the degree of disaggregation in the available data may limit the extent to which valid conclusions can be drawn from cross-country differences.
Figure 1. Contributions of supply- and demand-driven inflation to headline inflation in selected OECD economies
Decomposition of contributions to year-on-year headline inflation
Source: U.S. Bureau of Economic Analysis; Statistics Canada; UK Office of National Statistics; INSEE; Australian Bureau of Statistics; Bank of Korea; Statistics Denmark; Statistics Sweden; and OECD calculations.
1. A two-equation VAR of prices and quantities: pi,t= Zi, t-1γ+εi,t^p and qi,t= Zi,t-1γ+εi,t^q was estimated where pi,t and qi,t are the logs of the price and quantity indices respectively of category i in quarter t, Zi,t-1 is a vector of 4 lags of the log price and quantity indices of category i in quarter t and εi,t^p and εi,t^q are the price and quantity residuals for category i in quarter t. The equations were estimated over a 10-year rolling window for the period 2005Q4-2022Q2 or 2022Q3. The supply-driven, demand-driven and ambiguous contributions to year-on-year inflation are computed as a weighted sum of the latest four quarterly contributions.
United States: Challenges Faced by the Middle Class
Category: United States
written by oecdecoscope | November 29, 2023
By Álvaro Leandro, OECD Economics Department
According to Aristotle, “The most perfect political community is one in which the middle class is in control, and outnumbers both of the other classes”. Almost 2400 years later, policymakers around the world still believe that a strong and prosperous middle class is the key to economic and political stability. In fact, many studies show that countries with a strong middle class tend to enjoy higher levels of wellbeing and trust in institutions, and better governance.
It is therefore no surprise that the struggles of the United States middle class and its shrinking size have been front and centre of the economic policy discussions in the country. Indeed, as shown in the 2022 OECD Economic Survey of the United States, low intergenerational mobility and rising income inequality have been accompanied by a rise in the polarisation of the United States income distribution, or a “hollowing out” of the middle class. Whereas more than 60% of US households earned between 66 and 200% of the median income in the 1970s (a common definition of the middle class), this proportion shrank to 50% by 2020. Taking a narrower definition, the proportion of households earning between 75 and 150% of median income shrank from 43% in 1970 to 33% in 2020.
Figure 1. The US middle class has been shrinking
Source: Annual Social and Economic Supplement of the Current Population Survey
Those remaining middle class households have faced stagnating incomes and rising costs of important goods and services. According to the Congressional Budget Office, growth in incomes of the US middle class has lagged those of higher- and lower-income households during the past decades after accounting for taxes and transfers. From 1979 to 2018, the average income after taxes and transfers rose by 53% for the middle three quintiles of the income distribution, while it rose 91% and 120% for the lowest and highest quintiles, respectively.
Figure 2. The middle class has faced stagnating incomes and rising costs
Source: Bureau of Labour Statistics
Improving access to affordable and high-quality child care
While the high costs of health care, higher education and housing in the United States have received much attention, reported child care costs are also very high by international comparison, and have risen significantly in recent years. Additionally, financial aid for child care is very limited, with only a fraction of eligible households receiving public aid despite it being targeted towards the poorest households.
Both poor and middle-class families with young children spend significant amounts of their disposable income on child care, which has led the Biden administration to propose a programme that would cap household spending on child care to 7% of income. Such a programme would require significantly increasing public child care funding, which is very low in the United States compared to other OECD countries. Doing so would bring multigenerational benefits: for children, attending high quality early childhood education contributes to better outcomes later in life in terms of educational attainment, employment, health, earnings and wellbeing, with larger effects for children from disadvantaged socioeconomic backgrounds; for parents, easy access to affordable child care can boost lifelong earnings by increasing labour market participation and human capital accumulation.
Supporting lower- and middle-income households through the climate transition
The administration has announced ambitious policy targets for reducing greenhouse gas emissions. The 2030 Nationally Determined Contribution is to reduce greenhouse gas emissions by 50-52% below 2005 levels. In addition, the United States has committed to a goal of achieving net zero greenhouse gas emissions by 2050.
These targets imply that carbon cuts need to accelerate significantly, a considerable endeavour that will have large macroeconomic and redistributive consequences. The pace of the transition towards net zero emissions and the ambition of the policies required to achieve it will inevitably have important economic implications for the middle class. The transition entails a large reallocation of jobs and capital from high-carbon to low-carbon activities, which has already started to occur. Housing and transportation, which account for a large part of US greenhouse gas emissions, will have to rapidly decarbonise. Improving the energy efficiency of their housing and transportation will entail significant costs for lower- and middle-income households.
The Inflation Reduction Act passed in August this year is a major achievement. It includes significant investments and tax credits to improve the US energy system, which are estimated to significantly contribute to reducing net greenhouse gas emissions, while means-tested consumer tax credits and rebates will reduce the burden on lower- and middle-income households. However, more action across all levels of government will be needed to achieve the climate pledges of the United States. For example, state and local governments will have to adopt updated building energy codes and plan and execute renewable energy projects. In achieving the transition in the residential sector, middle income households should be further assisted to invest in greater home energy efficiency, possibly by further expanding home weatherisation and retro-fitting programmes. Well-designed policies in this area and in child care can support the re-emergence of a thriving middle class.
What is driving the spike in inflation dispersion in the euro area and how should policy react?
Category: Euro Area,Inflation
written by oecdecoscope | November 29, 2023
By Pierre Beynet and Antoine Goujard, OECD Economics Department
Inflation in the euro area has kept surprising on the upside, creating a significant challenge for macro-economic policy in a context of weakening growth prospects. In addition, the dispersion of inflation is at an all-time high. In August 2022, headline inflation ranged from 6.5% in France to 25.2% in Estonia (Eurostat, 2022). Inflation spreads had already been widening since the start of the COVID-19 pandemic and the asymmetric impact of the surge in energy, commodity and food prices is further adding to this dispersion (Figures 1 and 2).
Inflation dispersion will make it even more difficult to ensure an efficient transmission of monetary policy across member states and to guarantee an effective coordination between monetary and fiscal policies. Combined with the asymmetric impact of potential shocks, such as further energy and commodity price hikes, this could lead to diverging economic trajectories if monetary policy, which is set at the euro area level, remains too loose for countries with very high inflation while it becomes too tight for countries with relatively low inflation rates (see for example Aksoy et al., 2002). In contrast, until 2019, inflation differentials had been relatively small across euro area countries and roughly in line with those across US census divisions or metropolitan areas (Figure 2; ECB, 2021; Darvas and Wolff, 2014).
Figure 1. Headline inflation in the euro area, July 2022
Note: Contributions to year-on-year harmonised price inflation are calculated as described in OECD (2022) using national price inflation indices. Source: Eurostat and OECD calculations; OECD (2022), OECD calculation of contributions to overall annual inflation.
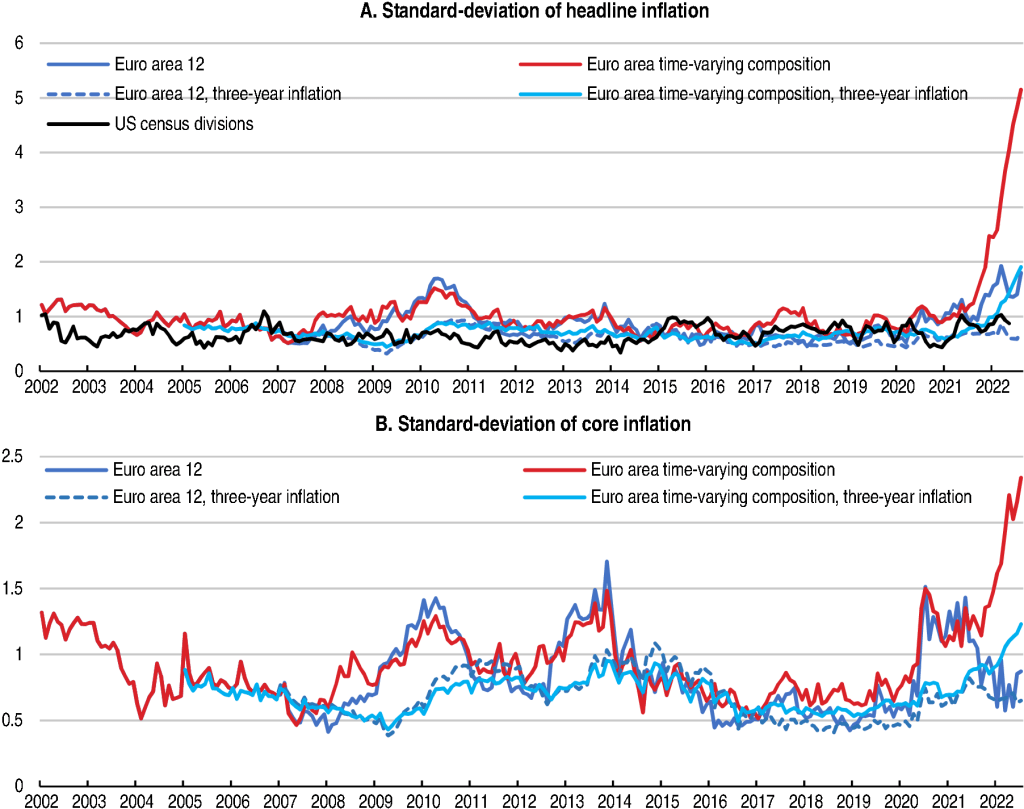
A first reason for these divergences in inflation rates is the differentiated impact of the COVID-19 crisis. The peak of the pandemic in 2020 resulted in very low prices that varied greatly across countries, leading to strong base effects when prices started to increase again. The different speeds of the reopening of European economies after various lockdowns triggered by the pandemic have also mechanically increased the spread of inflation rates over 2021-22. Looking at the 3-year annualised change instead of the usual 1-year change, the recent increase in the standard deviation appears less striking (Figure 2).
A second reason is the diverging effects of energy and commodity price spikes (Figure 1) (Boone and Elgouacem, 2021; Blake and Bulman, 2022; EC, 2022). Retail energy prices increased by close to 40% over the year from August 2021 to August 2022 in the euro area. The share of energy in each country’s harmonised price index ranges from 6.7% in Malta to 16.2% in Latvia, with typically larger shares in Baltic and Eastern European countries. Similar differences exist for food. Moreover, the energy mix differs across countries, as does the extent of emergency price policies in reaction to the price spikes (Bethuyne et al., 2022).
Third, the current elevated level of dispersion reflects widening spreads in core inflation (Figure 2). While the standard deviation of core inflation rates across the euro area is broadly in line with its 2005-19 average for the initial EA-12 countries in July 2022, it was 156% above once Baltic and Eastern European countries are included. This is due to the different behaviours of both services’ and industrial goods’ prices (Figure 3), reflecting different impacts from supply disruptions and national labour markets.
Figure 2. Dispersion of headline and core inflation in the euro area
Note: Euro area 12 is the standard deviation across the 12 initial euro area countries. The time-varying composition is the standard deviation across (time-varying) euro area countries. The standard deviations are unweighted. For the USA, the series represents the unweighted standard deviation across the nine US census divisions in 2019-22, back casted over 2002-18 using the standard deviation across the four census regions. Source: Eurostat, BLS and OECD calculations.
Figure 3. Core inflation in the euro area, July 2022
Note: Contributions to harmonised price inflation are calculated as described in OECD (2022) using national price inflation indices. Source: Eurostat and OECD calculations; OECD (2022), OECD calculation of contributions to overall annual inflation.
Persistent or stronger-than-expected commodity and energy price shocks could further raise inflation differentials. Based on the NiGEM macroeconomic model, the OECD June Economic Outlook estimated that a European embargo on Russian gas imports could add up to 1.1 percentage points to European inflation in 2023 (OECD, 2022a).
Yet, this impact would likely be highly unequal. To shed light on the magnitude of this mechanism, an illustrative calculation assumes a 40% increase in wholesale gas prices and a 20% increase in wholesale oil prices with a pass-through to retail prices of 40% for oil, 13% for gas and heating and 4% for electricity (Figure 4; EC, 2022). Also, as the pass-through is likely higher when commodity prices are already high (and the capacity of firms to further reduce margins is smaller), an alternative simulation assumes a higher pass-through to retail prices of 50% for oil, 26% for gas and heating and 8% for electricity. In both scenarios, cross-country differences only stem from the different weights of energy items in national consumption baskets. All things equal, the simulated national impacts of these global commodity price shocks appear to increase the standard deviation of headline inflation by around 2% (and 3% in the high pass-through alternative), compared to its historically-high August 2022 level.
Figure 4. Illustrative direct effects of a hike in wholesale energy prices on harmonised inflation after one year
Effects of a 40% increase in wholesale gas prices and a 20% increase in oil prices, percentage points
Note: The calculation assume a 20% increase in wholesale oil prices and a 40% hike for wholesale gas prices. The pass-through to retail prices of oil and gas is assumed constant across euro area economies at the median estimates of the EC (2022): 40% for oil, 13% for gas and heating and 4% for electricity. To gauge the uncertainty around this scenario, an alternative scenario assuming a higher pass-through is simulated using the median pass-through estimates plus the interquartile ranges of the EC (2022): 50% for oil, 26% for gas and heating and 8% for electricity. Source: Eurostat; EC (2022) and OECD calculations.
Based on the analysis above, divergences in inflation rates seem mainly driven by the differentiated impact of the coronavirus crisis and energy shocks so far. As those factors are expected to be mostly temporary, and as long as the divergence in core inflation remains moderate, differences in inflation should come down eventually. This would facilitate the conduct of monetary policy, and reduce the risk that the tightening euro area monetary stance exacerbates financial fragmentation amongst member states.
Second-round effects from the burst of inflation may also differ across countries and be a further source of inflation dispersion. Inflation differences can become more entrenched via expectations, but also depending on the functioning of labour markets (e.g. wage-price indexation mechanisms), as well as how rents, social benefits, regulated prices and taxes are linked to inflation. In countries where inflation is particularly high and there are signs of excess demand, such as in the Baltic States and several Eastern European economies, a tighter fiscal stance should play a role in countering demand pressures, since area-wide monetary policy alone is unlikely to be sufficient.
Fiscal policy should also tackle the adverse distributional impacts of higher energy prices. Temporary fiscal measures can help moderate inflation pressures and may thus help anchor inflation expectations (OECD, 2022a). However, as levels of public debt are already high and so as to not fuel inflation further, policy action to help cushion the impact of higher energy prices should be well targeted. Means-tested transfers to households generally meet these criteria, even though finer targeting mechanisms that go beyond income, for example based on housing location and quality, should be developed (OECD, 2022b). Also, fiscal support should not outlast the period of exceptional price pressures to avoid weakening longer-term price signals, which are critical for the energy transition.
Fiscal policy choices should ideally take into account potential spillovers to other member states, and the possible interactions with monetary policy. Fiscal and price-control measures are not equally well designed and targeted across the euro area, which might reduce their effectiveness and possibly create distortions in competition. Common European guidelines can help avoid this.
A more long-term structural source of inflation divergence is the heterogeneous national economic structures that lead to asymmetric country-specific shocks (OECD, 2021). Structural policies should help make the euro area more resilient to price shocks. Investment to improve the interconnection among national electricity grids would reduce energy costs and improve security. Improved storage capacity and diversification of energy sources would also limit volatility in oil and gas markets, including during the energy transition (OECD, 2022a). More generally, Europe should implement reforms that aim for stronger cross-country convergence, notably in three main avenues: the resilience of labour markets, the strength of the single capital market, as well as fiscal integration (OECD, 2021).
In conclusion, while at their highest levels since 2002, divergences in inflation rates have so far been mostly driven by temporary factors until now. The main immediate challenge for an even transmission of monetary policy is not diverging inflation, but diverging bond yields. However, this optimistic scenario could be put at risk if inflation divergences become more entrenched. To avoid this, fiscal policy will need to be tightened appropriately in countries with excess demand while structural reforms need to be implemented more generally to facilitate cyclical convergence across member states.
References
Aksoy, Y, P. De Grauwe and H. Dewachter (2022), “Do asymmetries matter for European monetary policy?”, European Economic Review 46 (2022).
Bethuyne et al. (2022), Targeted income support is the most social and climate-friendly measure for mitigating the impact of high energy prices, VoxEU.org, 6 June 2022.
Boone, L. and A. Elgouacem (2021), At the cross-roads of a low-carbon transition: what can we learn from the current energy crisis?, ECOSCOPE, https://oecdecoscope.blog/2021/10/22/at-the-cross-roads-of-a-low-carbon-transition-what-can-we-learn-from-the-current-energy-crisis/.
Darvas and Wolff (2014), So far apart and yet so close: should the ECB care about inflation differentials?
ECB (2021), The need for an inflation buffer in the ECB’s price stability objective – the role of nominal rigidities and inflation differentials, ECB Occasional Paper Series, No. 279, September 2021.