Promoting stronger and more sustainable growth for all people across Spain

También disponible en español

By Bertrand Pluyaud and Adolfo Rodríguez-Vargas, OECD Economics Department

Before the COVID-19 pandemic, the Spanish economy experienced a period of sustained and more balanced economic growth, less dependent on the construction sector, and with a healthier financial system. The pandemic and Russia’s war of aggression against Ukraine were successive shocks that required strong government support to protect businesses and households, as noted in the 2023 Economic Survey of Spain. Output has recovered to its pre-pandemic level, and growth has held up well since the second half of 2022 and it is expected to remain solid in 2024.

The recovery from the pandemic has been steady following the large fall of GDP in 2020

Gross Domestic Product, Volume, base 2019Q4 = 100


Made with Flourish

Spain has also introduced several major reforms to address longstanding labour market issues, promote business growth and innovation, ensure pensions’ sustainability, and boost vocational education. However, structural weaknesses remain that weigh down Spain’s growth potential. The 2023 Economic Survey discusses policy options to tackle these issues in four areas.

Addressing fiscal challenges

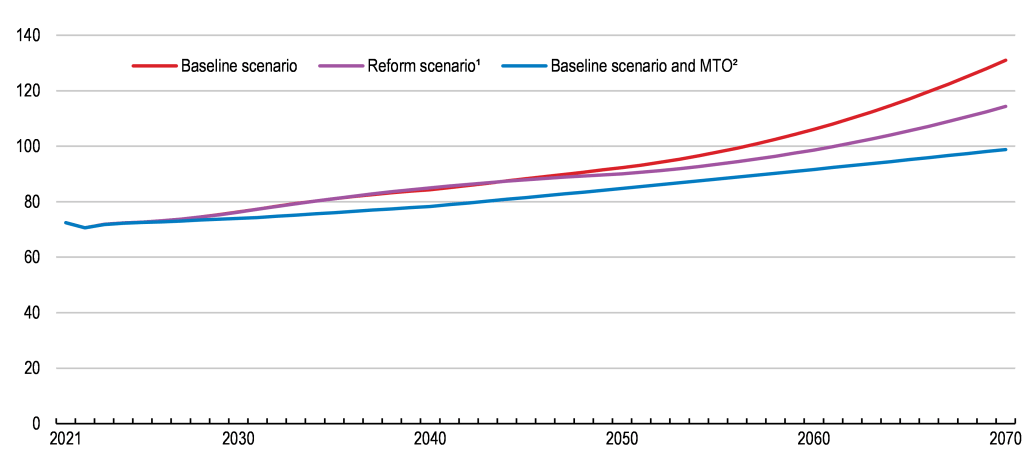
Government action was decisive for the recovery, but it was costly. Public debt, which was already high before the pandemic, has increased by 13 percent points of GDP since 2019.  Sustained fiscal consolidation is required to keep debt on a downward path and to make room for ageing-related spending and growth-enhancing items, like education and green transition. This consolidation should rely on both mobilising additional revenues and on enhancing spending efficiency.

Increasing the relatively low tax intake should encompass gradually broadening the value added tax base and raising environment-related taxes, but also reducing tax avoidance and enhancing tax collection. Spending reviews should continue to be used to define growth-enhancing spending priorities, and evaluation of public policies should become the norm.

Public debt remains high

Public debt, Maastricht definition, % of GDP


Made with Flourish

Source: Eurostat.

Raising productivity

Low investment in R&D, inefficient public spending on education and training, and an insufficient stock of ICT capital have dragged down productivity growth, which in the last decade has averaged 0.6% per year compared to 0.9% for the OECD. The share of innovative companies is also comparatively low. All this weighs on potential growth, which with rapid population ageing is expected to weaken even more.

Promoting collaboration and knowledge transfer between businesses and universities, fostering entrepreneurship,  reducing regulatory barriers, and improving regulation can increase innovation and business growth. Continuing with an effective implementation of the investment and reforms under the national Recovery, Transformation and Resilience Plan should remain a priority, as it can help overcome structural deficiencies and boost productivity.

Promoting opportunities for all people across Spain

Despite recent improvements, income inequalities remain significant. Poverty is high compared to the OECD, and Spain has the highest child poverty rate in Western Europe, at 22%. This makes it urgent ensuring that public assistance is sufficient and reaches those who need it more. The survey recommends improving the targeting of social benefits, particularly towards poor families with children, boosting the take-up of the minimum income guarantee, and reducing administrative burdens for users.

Young people in Spain face a challenging transition to an independent, productive, and happy adult life. The risk of poverty among them is particularly high, although it has fallen. That is why the special topic of this survey is how can Spain increase opportunities for its young.

Educational and labour market outcomes have improved, but many young people still leave the education system with low education levels or skills, and youth labour-market integration remains difficult. The share of temporary contracts has decreased after the 2021 labour market reform, but it is still high. The survey recommends training teachers to identify and assist students at risk and maintaining support for students to enrol in vocational education, including by fostering the participation of SMEs to offer places. Furthermore, to ease school-to-work transitions it encourages greater employer involvement in the design of university curricula, and improving access to financing for young entrepreneurs.

Housing is a pressing concern for many people in Spain, especially the young. To increase housing supply, the survey recommends expanding the very low stock of social rental housing and relaxing stringent rent controls.

Young people face high poverty risks

Risk of poverty or social exclusion, %


Made with Flourish

Note: OECD Europe includes European OECD countries and excludes Türkiye.
Source: INE.

Addressing environmental challenges

Spain has made progress in the fight against climate change, as environmental protection expenditure has increased and renewable energies are becoming more prevalent in the energy mix. To keep reducing its dependence on fossil fuels, Spain should accelerate the shift towards greener transportation, improve storage and grid interconnections, and continue promoting renewable energies.

A more environment-friendly tax regime is also needed, as environmental tax revenue as a share of GDP is low compared to most OECD European countries. The base for environment-related taxation can be broadened, including by phasing out exemptions and gradually increasing the tax rate on emissions, while compensating partially and temporarily the most vulnerable.

Persistent drought in some regions has lowered water availability, and intense agriculture production has affected water quality. These problems could be addressed through more efficient irrigation, reuse and recycling of waters, and a more sensible use of fertilizers.

Improving water availability and quality is urgent

Groundwater stations with poor quality standards, %


Made with Flourish

Note: Groundwater stations failing to meet the drinking water standard under the EU Nitrates Directive
Source: European Environment Agency (EEA).

Government action helped Spain to overcome two major successive shocks. Evidence-based public policies can also help to solve Spain’s longstanding structural weaknesses to increase growth and raise wellbeing for all people across Spain.

References

OECD (2023), OECD Economic Surveys: Spain 2023, OECD Publishing, Paris,  https://doi.org/10.1787/5b50cc51-en  


Canada: five messages from the latest OECD Economic Survey

By Ben Conigrave and Philip Hemmings, OECD Economics Department

Canada’s economy has proved resilient to testing global conditions in the wake of Russia’s invasion of Ukraine. Amid a strong post-pandemic recovery in output and revenues, the federal government stepped up action to improve housing affordability and expand access to low-cost childcare. While Canada’s recent social policy progress is impressive, a major reform challenge remains – to lift tepid growth in productivity and average incomes while also eliminating net greenhouse gas emissions by 2050. Projected economic growth of 1.3% in 2023 and 1.5% in 2024, while avoiding recession, would not close gaps in living standards to better-performing economies. The latest Economic Survey of Canada sets out recommendations aimed at boosting Canada’s growth potential and driving down carbon emissions.

Inflation has fallen from peak levels but is still above target. The main drivers of last year’s surge in consumer prices have abated. Energy price falls and easing tensions in world supply chains have helped reduce headline inflation. Higher borrowing costs have also started to cool domestic demand after a series of large interest rate rises by the Bank of Canada. Still, underlying price pressures remain elevated. Labour market conditions are tight, with the jobless rate near record lows and workers demanding larger-than-usual wage increases. Policymakers face the tricky task of returning inflation to target without creating an economic downturn.

Figure 1. Inflation has passed its peak but remains high

Headline consumer prices, annual increase, %

Note: The Bank of Canada aims to keep inflation close to the 2% midpoint of a control range from 1 to 3% over the medium term.
Source: OECD (2022), Main Economic Indicators (database).

Living cost pressures have increased. High inflation has eroded real incomes and is weighing on consumer spending. Governments have stepped in to ease the cost of living. Some measures rightly target support to vulnerable households. For instance, the federal government has temporarily increased goods and services tax (GST) credit payments aimed at those on lower incomes. In contrast, provinces have in some cases introduced across-the-board subsidies to reduce utility bills or cut fuel taxes. Untargeted measures of this sort can be costly, fail to focus support on under-pressure households, and weaken incentives to save energy. A major federal-provincial initiative separately promises to improve access to cheap childcare. Properly implemented, the scheme should help lift employment, particularly among women, supporting higher living standards. At the same time, significant socio-economic gaps still separate Indigenous people and the rest of Canada’s population. Support for Indigenous self-determination needs to continue as part of efforts to close these gaps.

Budget repair has been faster than expected. Commodity export price rises contributed to revenue growth in a high-inflation environment just as pandemic support was ending. Deficits and debt burdens have shrunk despite the federal government extending living-cost relief and launching new programmes to improve the affordability of housing and childcare. But as multi-year spending commitments mount, and revenue tailwinds die down, governments will find it harder to sustain budget improvements. Better spending efficiency could reduce long-term fiscal challenges. Tax system reform will also be important, both for fiscal sustainability and unlocking higher potential output. Shifting the tax mix towards greater use of indirect taxes, and less use of distortive taxes on income, would reduce drags on Canada’s productive capacity. Windfall gains from high commodity prices in 2022 also serve as a fresh reminder of the need for provinces to make more use of stabilisation funds to mitigate boom and bust cycles in their budgets.

Figure 2. The public debt burden is decreasing

Public debt, % of GDP

Note: Data for 2022 are estimates. Gross debt includes general government liabilities in the form of currency and deposits; debt securities, loans; insurance, pensions and standardised guarantee schemes, and other accounts payable. Net debt subtracts financial assets from gross debt.
Source: OECD Economic Outlook 112 (database).

More policy focus is needed on productivity-enhancing reform. Population increase, underpinned by high levels of immigration, will continue to be an important driver of growth in Canada’s economy in the years ahead. But long-term improvement in living standards will require higher productivity. Lacklustre productivity growth since 2015 saw gaps in per capita GDP widen between Canada and better-performing economies, including the United States. Reversing this trend, which coincided with weak business investment after the 2014 oil price collapse, demands reform efforts equal to those behind recent social policy advances. Removing barriers to trade between provinces would improve the business environment. Regulations and technical standards impede flows of goods and services across Canada’s internal borders as well as the performance of regional labour markets. Separately, stringent foreign ownership limits in network sectors – including telecommunications – directly restrict foreign direct investment. The rules should be reviewed.

Figure 3. Canada’s investment performance can be improved

Real private non-residential investment

Source: OECD Economic Outlook database.

Strong incentives are needed to decarbonise production. Canada’s resource-intensive economy uses more energy and generates more greenhouse gas emissions per person than most other OECD countries. An ambitious federal government plan aims to change this. Deploying regulations, market-based tools and support for green investment, the government has committed to eliminate Canada’s net emissions by 2050. As well as energy saving in businesses and homes, achieving this goal will require replacement of fossil fuels with clean energy across the economy. For policymakers, the task will be to minimise drags on activity from sometimes overlapping mitigation tools. Higher carbon prices levied uniformly on a larger share of emissions will help ensure an efficient green transition. Canada’s federal and provincial governments must work together to strengthen incentives for low-cost mitigation across key sectors – including electricity, oil and gas, transport and buildings – and prepare communities for fast-changing climates.

Figure 4. Canada’s emission reduction challenge is large

GHG emissions

Note: The solid blue line shows historical GHG emissions. The dotted line shows the emissions reductions required to meet 2030 and 2050 targets along an indicative pathway. The green line shows emissions projections by Environment and Climate Change Canada.
Source: Calculations based on OECD (2022), Environment Statistics (database); Climate Action Tracker; and Environment and Climate Change Canada.

References:

OECD (2023), OECD Economic Surveys: Canada 2023, OECD Publishing, Paris. https://doi.org/10.1787/7eb16f83-en


Laying the foundations for strong, sustainable growth in Finland

By David Carey, OECD Economics Department

After a large drop in the first half of 2020, Finland regained its pre-COVID-19 GDP level by mid-2021, which was faster than many other OECD countries (Figure 1). Policies to support incomes during and after the pandemic contributed to the powerful economic rebound. However, Russia’s war of aggression against Ukraine has boosted inflation, slashing household spending power and consumer confidence, and weakened Finland’s main export markets. Consequently, economic growth is set to stall in 2023 but to recover in 2024 when the adverse effects of the energy shock will have passed.

Figure 1. The economy recovered quickly from the COVID-19 shock but is set to slow

Source: OECD Economic Outlook database.

Russia’s war in Ukraine has also increased the government’s budget deficit. On current policies, the budget deficit adjusted for the business cycle is set to be around 2% of GDP in 2023-24. With increases in spending related to population ageing on the horizon, the OECD projects that gross government debt will rise to 130% of GDP by 2070 (Figure 2). This increase would be considerably smaller if the deficit were constantly limited to Finland’s medium-term target of 0.5% of GDP beyond 2030. To this end, comprehensive spending reviews should be undertaken to identify consolidation measures and the incentives in the healthcare reform for counties to increase efficiency reinforced, if necessary.

Figure 2. Government debt would increase substantially under unchanged policies

Gross general government debt, % of GDP

1. In the reform scenario, improvements in the innovation system increase the level of GDP by 3% over the baseline by 2050 and work-based immigration rises gradually from the current level (1 500 per annum) in 2030 to 7 500 per annum in 2050-70. In addition, fixed capital is assumed to grow faster (at 2% per year throughout the projection) than in the baseline scenario (0.9% per year from 2040 onwards). Higher growth in the fixed capital-to-labour ratio is the main factor increasing growth in labour productivity (to 1.4%) and output (to 1.1%) in the reform scenario.
2. In the MTO scenario, Finland continuously meets its medium-term budgetary objective of a structural financial balance of minus 0.5% of GDP from 2030.
Source: OECD.

Finland is on track to meet its gross greenhouse gas abatement targets for 2030 and 2035. However, the cost of reducing emissions is unnecessarily high. To lower these costs, the share of biofuels mandated in the transport sector should be reduced to the minimum level required by the European Union and, to compensate, the carbon price used to calculate carbon tax rates on heating fuels aligned with that used for transport fuels. Furthermore, heat production using peat, which is highly CO2 emissions intensive, should be subject to the same tax regime as other fossil fuels and policies to reverse car dependency in cities strengthened.

Finland is not on track to meet its forestry and other land-use targets. It needs to reduce forestry and land-use emissions from 2 CO2-eq. in 2021 to minus 17 and minus 21 Mt CO2-eq. by 2030 and 2035, respectively. To this end, instruments should be created to encourage the cultivation of wetted peatlands and forestry should be subject to carbon pricing.

Finland needs to reboot its innovation ecosystems, which comprise innovation partnerships between various public and private actors like universities, firms and research institutions, to lift weak productivity growth (0.5% on average over the past decade). The government’s legal commitment to boost R&D spending to 4% of GDP by 2030, from 2.9% currently, will help to strengthen innovation ecosystems. It will be important that additional spending and innovation support schemes be regularly assessed for their impact and improved continuously. Innovation support should also become more mission oriented, directing applied research toward solving the most pressing socio-economic challenges.

Another key challenge for Finland’s innovation ecosystems is the severe shortage of qualified workers with skills to develop advanced technologies or adopt successfully technologies developed elsewhere. The government has an ambitious goal of raising the tertiary attainment of young adults to 50% by 2030, from 40% today (Figure 3). To realise this goal, it should commit to a credible plan to increase tertiary study places, fund them and improve the allocation of study places across study fields to better reflect the skill needs of the labour market.

Figure 3. Tertiary educational attainment among young adults is relatively low

Percentage of 25-34-year-olds having completed tertiary education, 2021

Note: Data refer to 2020 for Chile.
Source: OECD (2022), Education at a Glance 2022.

Attracting more foreign talents is also important for alleviating skill shortages and better linking innovation activities with those in other countries. The government aims to increase annual work-based immigration by at least 50 000 by 2030. It will be important that these immigrants also find good jobs in Finland, which currently is not always the case.

References:

OECD (2022), OECD Economic Surveys: Finland 2022, OECD Publishing, Paris,
https://doi.org/10.1787/516252a7-en.


Different paths to net-zero: Assessing the effectiveness of diverse climate mitigation approaches

By Mauro Pisu (OECD), James Roaf (IMF), Florence Jaumotte (IMF), Ian Parry (IMF), Andrew Prag (OECD), Kurt Van Dender (OECD)

In the historic 2015 Paris Agreement, virtually the entire world signed up to the goal of limiting global temperature increases to 1.5-2C above preindustrial levels. Since then, more than 130 countries have set ambitious greenhouse gas emission (GHG) reduction targets to reach net zero GHG emissions by around mid-century.

However, this is where the similarities end, as the detailed targets and policies countries have so far implemented, or plan to implement, to meet those targets differ greatly.

One thing is clear: at the aggregate level, countries’ near-term ambition and policies are insufficient to bring global GHG emissions on track to meet the Paris temperature goals or to reach net zero emissions by mid-century. Without major policy changes, we may be heading for warming of 3C or more. This would be catastrophic, especially for the poorest and most vulnerable. To avoid the Paris temperature goals slipping permanently out of reach, GHG emissions would have to decline by 25-50 percent below recent levels by 2030, requiring a significant acceleration in emission reductions and drastic policy changes.

The current energy crisis adds to these challenges as it has exposed links and short-term trade-offs between safeguarding energy security and climate goals. The search for alternative sources of energy to oil and gas from Russia has shifted relative prices and, in some countries, increased the use of more polluting fossil fuels, such as coal, at least temporarily. At the same time, the crisis could become a major accelerator of the clean energy transition over the longer-term. For that to happen, international cooperation remains critical to ensure energy security and overcome policymakers’ concerns that other countries may not do their fair share in cutting emissions and relatedly that their industries might lose competitiveness. Aligning energy security with climate goals requires stronger international co-operation underpinned by a shared understanding of the impact of the diverse mitigation policy approaches countries are pursing.

To curtail emissions, countries might use carbon pricing – either via carbon taxes or emissions trading schemes – or other price-based incentives like tradeable emissions standards, feebates and feed-in tariffs for renewable electricity. Or they might use non-pricing instruments such as regulations and green investment and technology subsidies. In fact, countries typically use a combination of these measures, according to their individual circumstances. Identifying the individual and combined effects of the many measures composing countries’ mitigation policy mixes is challenging.

In a new report, the IMF and OECD have joined forces to support the German G7 Presidency on these issues. The report focuses on three key areas to improve the comparison of the impacts of different mitigation policy approaches on emissions and the broader economy:

Stocktaking of mitigation policies. Identifying and documenting countries’ diverse policy approaches requires systematically collecting information on a larger set of mitigation policies in more countries and sectors, and at a more granular level, than is currently possible. Such information, covering price-based and non-price-based policies, will provide much additional information for policy makers and will be key to estimating the emission reduction effects of policies in a consistent way across countries and sectors. Such a stocktaking can build on and go beyond the inputs from already available stocktakes such as OECD’s Effective Carbon Rates, Taxing Energy Use, International Programme for Action on Climate (IPAC), and Environmental Policy Stringency index (Figure 1). A new stocktake can provide more detailed information on the emission coverage and enlarging the set of mitigation policies being covered.

Figure 1. OECD Environmental Policy Stringency and stocktaking of climate change policies

  A. The 2021 Environmental Policy Stringency Index


B. EPS sub-indicators across countries, 2020

Note: Panel A shows the aggregation structure of the updated EPS index (referred to as “EPS21”). ELV is short for Emission Limit Value. Panel B shows the contribution of the policy components to the EPS across countries for the year 2020. The blue bars show the contribution of non-market based policies to the EPS. The red bars show the contribution of market based policies. The green bars show the contribution of technology support policies. Data for Colombia, Costa Rica, Latvia and Lithuania were not available.
Source: OECD.

Agreeing on and implementing a clear methodology for estimating the impact of policies on emissions. This would strengthen countries’ capacity to monitor progress towards climate change targets and improve the comparability of reporting such progress. Figure 2 shows a stylized example for such policy comparisons, applied to G20 economies. Different policy combinations currently planned for 2030 are mapped onto a common base of emissions reductions. These policies can then be compared to a common metric (such as the “carbon price equivalent”, which is the carbon price that would achieve the same overall mitigation effect as a package of other policies). As shown in the chart, countries differ strongly both in the mix of policies and in their overall effectiveness, with most countries’ stated policies still falling short of their Nationally Determined Contributions, let alone their longer-term net-zero targets.

Figure 2. Estimated economywide CO2 reductions

Source: IMF staff using the Climate Policy Assessment Tool.  

Assessing the broader economic effects of different climate policies, including cross-country spillovers. Understanding these effects would help to design policy approaches that allay concerns about competitiveness, carbon leakage, and burden sharing of global mitigation efforts. Figure 3 shows for example that different climate policies by the G7 countries, in the electricity sector (on the left) or in both the electricity and energy intensive and trade exposed sectors (on the right), are associated with different impacts on their international trade shares (i.e. they have different competitiveness effects). In the electricity sector, different policies have relatively similar effects, except feed-in subsidies that would reduce emissions while avoiding losses in trade shares. Feed-in subsidies policy, however, would cause comparatively higher GDP costs because of the need to finance the subsidy by raising taxes. In the energy intensive and trade exposed industries, policy makes a major difference: regulation affords firms less flexibility than a carbon price and model simulations suggest this results in a significant negative effect on trade shares of hard-to-decarbonize industries, contrary to carbon pricing.

Figure 3. Effect of pricing and non-pricing climate policies on the international trade share of energy intensive and trade exposed industries in G7 countries

Percentage point deviation from baseline in 2030

Note: EITIE denotes energy intensive and trade exposed industries.
Source: IMF staff using IMF-ENV model.

The methodologies discussed in this new paper are still work-in-progress but they provide a sound framework for comparing mitigation efforts and a roadmap to advance work supporting international policy co-operation initiatives. These could include: the Climate Club established by Germany’s G7 Presidency; the International Carbon Price Floor proposal put forward by IMF staff; the OECD’s Inclusive Forum on Carbon Mitigation Approaches (which will undertake stocktaking, mapping and estimating the effectiveness of mitigation policies); the UNFCCC’s Enhanced Transparency Framework; carbon border adjustment mechanisms and other mitigation initiatives discussed in international fora.


What role for carbon pricing in reducing emissions and generating revenues?

By Filippo Maria D’Arcangelo, Mauro Pisu (OECD Economics Department), and Anasuya Raj, Kurt Van Dender (OECD Centre for Tax Policy and Administration)

Limiting global warming and avoiding its potentially catastrophic damages hinges on reaching net-zero emissions by mid-century (IPCC, 2022). Achieving this ambitious global target requires a wide range of mitigation policies to overcome market failures, path dependencies and coordination problems (D’Arcangelo et al., 2022).

Carbon pricing can play an important role in a well-coordinated mitigation policy mix for two main reasons. First, in many instances, carbon pricing can induce lower emissions at lower economic costs than alternative mitigation policies. Second, it can generate additional government revenues, at least until emissions start falling appreciably.

Available evidence on the responsiveness of CO2 emissions and government revenues to carbon pricing is fragmented and difficult to compare across countries and sectors. Thus, tracking and comparing countries’ progress towards emission reduction targets and assessing the contribution of carbon pricing to emission reductions is challenging. We tackle this challenge in our recent paper, Estimating the CO2 emission and revenue effects of carbon pricing: new evidence from a cross-country dataset.

The paper provides fresh evidence on the long-run responsiveness of CO2 emissions and government revenues to carbon pricing within a unified framework across countries, sectors and fuels. The analysis relies on the OECD Effective Carbon Rates (ECR) database, containing comprehensive and detailed information on instruments pricing carbon emissions from energy use in 44 OECD and G20 countries. The ECR database contains data on carbon taxes, permit prices resulting from emissions trading systems, and fuel excise taxes and covers about 80% of global CO2 emissions from energy use.

Broad-based carbon pricing is an effective measure to reduce emissions in most sectors and will accelerate coal phase-out

Baseline estimates suggest that a EUR 10 per tonne of CO2 increase in carbon prices decreases CO2 emissions from fossil fuels by 3.7% on average in the long term. Policy simulations indicate that introducing a EUR 60 per tonne of CO2 global carbon price floor (about three times the 2018 average effective carbon rate) would lower total CO2 emissions from fossil fuels by about 17% compared to 2018 levels, after firms and people have fully adjusted to the increase in ECRs. This is a sizeable reduction in emissions but far from what is required to reach net-zero.

Estimates of the responsiveness of CO2 emissions to carbon pricing vary across sectors and fuels. For example, emissions in the buildings sector are about three times less responsive to carbon pricing than those in the agriculture and fisheries sector. Increasing carbon prices can be expected to have the largest effects on emissions from the Electricity and Industry sectors (Figure 1) due to a confluence of factors: the low carbon prices these sectors still face in most countries; their high emission responsiveness compared to other sectors; and their large share in total emissions. A high price floor in the Road transport sector, where effective carbon rates are already elevated due to excise taxes, would also contribute substantially to reducing emissions.

Emissions from coal are more responsive to carbon pricing than those from all other types of fossil fuels. Even mild, broad-based carbon prices would contribute significantly to coal phase-out, given its high responsiveness to carbon pricing: a floor of EUR 60 per tonne of CO2 can be expected to reduce global emissions from coal by half.

Figure 1: Effect of different ECR floors on emissions by sector

Note: Simulations of the effect on CO2 emissions (y-axis) of a global ECR floor applied to all emissions priced in 2018, by EUR 5 increments (x-axis)

Broadening carbon pricing to unpriced emissions has large effects on emissions and revenues in some countries

Moderate increases in carbon pricing would initially translate into large government revenue increases, as carbon prices are still generally low. Globally, carbon-related revenues could triple, relative to 2018 levels, with a EUR 60 global carbon price floor. Over time, if carbon price floors keep on increasing, these carbon-related revenues would dwindle in tandem with the reduction of emissions.

The broadened coverage of carbon pricing to currently unpriced emissions would contribute to around two thirds of the total estimated effects on emissions and revenues. Emission-intensive countries that do not yet price a large share of their emissions would observe a larger reduction in emissions and greatly contribute to the increase in fiscal revenues.

Figure 2: Impacts of a EUR 60 ECR floor on carbon-related revenues

Note: Red bars: Carbon-related government revenues observed in 2018; Green bars: effect of a EUR 60 carbon price floor on revenues through emissions already priced in 2018; Blue bars: effect of a EUR 60 carbon price floor on revenues through emissions not priced in 2018.

Easing the substitution of clean energy sources for fossil fuels requires policies complementary to carbon pricing

The estimated responsiveness of emissions to carbon pricing suggests that even large carbon prices (about EUR 1000 per tonne by late 2030s) will not suffice to meet net-zero emission targets.

Complementing steady but moderate increases in ECRs with policies that markedly increase the emission responsiveness to carbon pricing is crucial to put emissions on a downward path towards net-zero targets. In this respect, innovation and reallocation-friendly policies have a major role to play, as they can ease the substitution of clean energy sources for fossil fuels, thus reducing emission abatement costs and making carbon price more effective. For instance, policy simulations show that an emission responsiveness twice as large as the baseline estimate, combined with an ECR floor of EUR 40 on priced and unpriced emissions, would result in the same emission reduction as the baseline responsiveness estimates combined with an ECR floor of EUR 175 on priced emissions and EUR 60 on unpriced emissions.

References

D’Arcangelo, F.M., Ilai Levin, Alessia Pagani, Mauro Pisu, and Åsa Johansson (2022), “A framework to decarbonise the economy”, OECD Economic Policy Papers, No. 31, OECD Publishing, Paris, https://doi.org/10.1787/4e4d973d-en.

IPCC, 2022: Climate Change 2022: Mitigation of Climate Change. Contribution of Working Group III to the Sixth Assessment Report of the Intergovernmental Panel on Climate Change. Cambridge University Press, Cambridge, UK and New York, NY, USA. doi: 10.1017/9781009157926.


Korea: Stunning success and work in progress

By Jon Pareliussen, OECD Economics Department

Walking in modern-day Seoul, you are easily struck by its modernity. You do not even have to go there if you own a Samsung smartphone, drive a Hyundai, listen to BTS (which recently announced a break) or Blackpink, watch Squid Game or Extraordinary Attorney Woo. It is hard to fathom the speed at which Korea has travelled the long road from poverty and devastation following the Korean War to strength and prosperity, with per capita GDP rising above the OECD average in 2020 (Figure 1). Since the 1960s, income growth and access to health care pushed life expectancy well above the OECD average, accompanied by an equally impressive transition from authoritarian rule to vibrant democracy. The 2022 OECD Economic Survey of Korea tells the tale of present strengths and skilful governance, but also points to current and future challenges which are to an extent rooted in Korea’s export-oriented growth strategy and its rapid ascent from poverty to prominence.

Figure 1. Rapid development and great economic success

GDP per capita, constant 2015 prices and PPPs

Source: OECD National Accounts Database.

Sound economic policies

In the recent past, skilful health management steered the country through the pandemic relatively unscathed, with a world-leading tracing system implemented early in spring 2020 and a vaccination campaign carried out with speed and efficiency. Building on a tradition of sound economic management, supportive policies protected people and businesses from hardship and bankruptcy. The strong exporting sector helped the economy rebound. The recovery is set to continue as pandemic-era restrictions on contact-intensive services are shelved, despite the Russia-Ukraine war raising inflation and highlighting the need to boost supply chain resilience.

K-ETS should be Korea’s best friend to reach climate pledges

Korea has committed to reducing emissions by 40% from the 2018 level by 2030, and to net zero by 2050. Its exporting sector and electricity generation are emission intensive, pointing to a challenging transition. However, this also leaves room for relatively low-cost emission reductions with considerable co-benefits from cleaner air. Korea’s emission trading scheme (K-ETS) was the first in East Asia and should be recognised by policymakers as the best tool to reduce emissions as much as possible at a lowest possible cost. K-ETS puts a price on carbon from a large share of emissions, but too many allowances are handed out for free and its overall emission limit is not yet aligned with the new and more ambitious emissions reduction targets. Deregulation is needed to allow the carbon price to pass through to electricity producers to actually incentivise emission reductions in this important sector.

Productivity gaps are mirrored in income, social protection and working conditions

Export-led growth and the nurturing of large exporting companies laid the ground for considerable and persistent productivity gaps to smaller companies. Large firms typically offer highly educated workers well-paid jobs, good working conditions, regular employment and social insurance coverage, but their share of employment has fallen as production has been automated and moved offshore. Low-productivity SMEs hire a larger share of non-regular workers, who earn less and are less protected. These firms find it hard to attract the skilled workers needed to boost productivity, for example by adopting digital technologies. A large number of policies have been put in place to support SMEs, including subsidies, favourable access to public procurement, regulations differentiated by company size, and even whole market segments reserved for SMEs. Each policy may have some justification if seen in isolation, but they sum up to a system that supports the survival of low-productivity firms against a backdrop of regulatory complexity.

Youths’ struggle for a golden ticket is unproductive

Korea’s high level of human capital is fundamentally a strength, but important aspects of the current status quo are unproductive. Entering a top university increases the chance to land a secure and attractive career in a large firm or the public sector rather than in a low-productivity SME. Competition is therefore fierce to score highly on the university entrance exam. This Korean “Golden ticket syndrome” has several negative effects, including low youth employment, a lot of time and money spent on private tutoring (hagwon), skill and qualification mismatches, high pressure on students and low life satisfaction.

Korea needs more children and more working moms

Over the past few decades, education and access to jobs have become increasingly equal between genders. The large-scale roll-out of publicly-funded day care and kindergartens has raised enrolment rates to the level of Nordic countries, but working life and social norms have not kept pace. Combining career and children is often not an option when facing norms and expectations based on traditional gender roles, and long working hours and limited flexibility in the workplace. Mothers returning to working life tend to find that only low-paid non-regular jobs are available. Young women therefore postpone family formation and have fewer children over their lifetime (Figure 2). This has put Korea on the path to rapid ageing which will lead to fiscal and labour market pressures going forward.

Figure 2. Women postpone childbirth

Source: OECD Economic Surveys: Korea 2022.

Work in progress

Building on its considerable strengths, Korea should harness the economic dividends of equal opportunity and fair competition to reduce productivity gaps, thereby narrowing gaps in pay and social protection and reducing the pressure to win a golden ticket. Wise climate policies can contribute to productivity and help secure equal opportunities for future generations. Making the workplace friendlier to both women and men along with a continued drive by the government to lead by example, facilitate the combination of career and family and change gender norms could lead to more children, more working moms and happier people.

Find out more:

Jones, R. (2021), “The Republic of Korea: Economy”, Routledge, London.

MOEF (2022), The new government’s economic policy directions, Ministry of Economy and Finance, Sejong.

OECD (2022), OECD Economic Surveys: Korea 2022, OECD Publishing, Paris, https://doi.org/10.1787/20bf3d6e-en.

OECD (2019), Rejuvenating Korea: Policies for a Changing Society, OECD Publishing, Paris, https://doi.org/10.1787/c5eed747-en.