The hidden carbon markets: how forests can balance emissions

Positive effects of forests can offset greenhouse gas emissions
How OECD Economic Surveys reveal the drivers of deforestation, and the policy tools to stop it


By Michael Koelle, OECD Economics Department

Tropical forests cover vast swaths of land in many OECD member and accession countries, including more than 75% of Costa Rica’s territory, and over half of Brazil, Colombia, Indonesia and Peru. In these countries, emissions from land use, land use change and forestry (LULUCF), largely driven by forest loss and degradation, account for a large share of total emissions (Figure 1). In fact, land use emissions are in some cases the main driver of national emission trends. But forests can also be part of the solution, as the experiences of Finland and New Zealand, two forest-rich OECD members, teach us.

For many countries, forests are no longer just a conservation issue, they are central to climate mitigation plans. Turning forests into carbon sinks is one of the most cost-effective ways to offset hard-to-abate emissions from agriculture, transport and energy. Finland and New Zealand have long had negative LULUCF emissions thanks to sustainable forest management and afforestation. Costa Rica managed to turn around LULUCF emissions, converting its forests into a carbon sink. Indonesia aims to achieve net negative emissions from LULUCF by 2030 while in Peru and Brazil, LULUCF accounts for 65% and 38% of planned emissions reductions by 2050, respectively. The economic case for protecting forests, through stronger enforcement, property rights, sustainable agriculture, and better incentives, has never been clearer. 

Insights from Economic Surveys: What’s really driving deforestation?

What do Brazil, Costa Rica, Colombia, Finland, Indonesia, New Zealand, and Peru have in common? They are all forest-rich economies, and each has been subject of in-depth analysis in OECD Economic Surveys. These studies go beyond emissions reporting. They dig into the underlying economic drivers of deforestation and discuss what can be done to turn forests into carbon sinks. While each country has its own context, common drivers of deforestation emerge. Forest loss is rooted in economic structures and incentives, from the rapid expansion of agriculture to unclear or unenforced property rights and misalignment between individual incentives and broader societal goals. Developing forest-based activities that generate sufficient economic value while keeping forests intact is far from impossible, given that cleared forest land is often used for low-profitability activities. Moreover, as seen in Finland and New Zealand, afforestation can be one of the least costly ways to reduce net greenhouse gas emissions. Tackling deforestation therefore requires structural policy responses that make choosing forests the economically sensible option, not just environmental regulation.

Fostering sustainable agriculture

Across all countries studied the expansion of the agricultural frontier is the main driver of deforestation. In Peru, OECD research shows that 90% of all deforested land is used for agriculture and livestock-rearing (Garcia Soto and Koelle, 2025). Moreover, 75% of these lands are identified as mixed-use, where farmers combine crop growing and livestock grazing on relatively small plots. In Brazil, cattle is a major pressure; in Indonesia, palm oil plantations continue to push into forest areas. Cattle grazing was also a main driver of deforestation in Costa Rica and Colombia. Most of these activities have low productivity and profitability, making extensive use of underpriced land. As Finland’s experience shows, managing soil emissions from agriculture and forestry can become a crucial issue even when forest stocks have stabilised.

To address this, OECD Economic Surveys recommend:

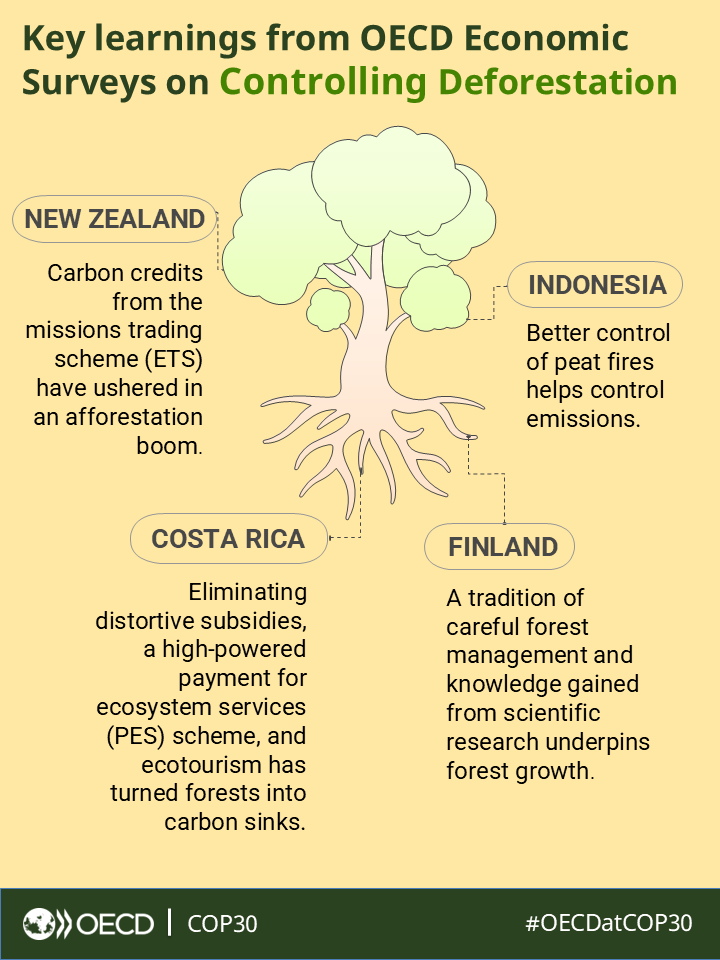
  • Eliminating environmentally harmful agriculture subsidies, such as cattle ranching subsidies, which contributed to successful reforestation in Costa Rica.
  • Improving scientific knowledge of agriculture, soils and forests, which provides the basis for cost-efficient emissions reduction and carbon storage activities in Finland.
  • Boosting productivity on existing land, to reduce pressure to expand the agricultural frontier.
  • Incentivising agroforestry and sustainable land-use practices and enforcing compliance with the law and regulations tied to land rights.

Strengthening property rights

Most deforestation occurs on land that is either publicly owned or of unclear or unenforced property rights. In Peru, state lands without designated purpose are at the highest risk for deforestation. In Colombia, land rights are often unclear and ambiguous after decades of conflict and displacement of rural populations. In Brazil, a strong framework exists, but enforcement is a challenge. Indigenous communities are especially vulnerable in defending their property rights, even if formally recognised.

OECD Economic Surveys recommend:

  • Creating comprehensive land registries using modern technology.
  • Strengthening property rights and law enforcement in remote areas, including based on satellite imagery.
  • Recognising and enforcing indigenous land rights, which are linked to lower deforestation rates.

Aligning incentives with climate goals

Even with secure land rights and strong enforcement, forest conservation must make economic sense. Intact forests need to generate real value for communities and landowners. Payment for ecosystem services (PES) that provide payments to forest owners for forest preservation are an essential policy tool. Costa Rica’s model stands out: funded by an earmarked portion of fuel taxes it covers 40% of all the nation’s forests, even if financing needs to be put on a broader footing. Other countries have significantly underfunded PES systems or rely mostly on international mechanisms like REDD+ and Article 6 of the Paris Agreement that provide a global mechanism for protecting the world’s remaining forests, but implementation is slow and partly untested. The possibility to sell carbon credits through emissions trading schemes (ETS) can provide powerful incentives for reforestation. New Zealand’s pioneering inclusion of forestry in its ETS, where forest owners can earn carbon credits for capturing carbon through tree growth and must surrender credits if they deforest, provides useful lessons on how such schemes should be designed in forest-rich countries. There should be differentiation according to the emissions removal potential of different forest types, and the design should ensure a sufficiently high carbon price to incentivise carbon-efficiency in non-LULUCF sectors.

The OECD Economic Surveys call for:

  • More robust, broader, and sustainably financed payment for ecosystem services schemes and the expansion and integration of emissions trading schemes.
  • Better integration of eco-tourism, agroforestry, pisciculture and sustainable timber industry into regional economic development and planning.
  • Public incentives that complement, not contradict, private-sector logic.

Conclusion

To truly value forests, governments must embed them into national budgets, tax systems and investment frameworks. Forest conservation must be seen as a sensible investment into preserving the nation’s natural wealth and resources. The cost of these investments is often relatively modest but strong leadership and coordination is needed to ensure that institutions and incentives all work in the same direction.  At COP30 in Belem, forest rich countries have a chance to lead, not just in emission reductions, but also in showing how forests can support climate goals and the economy.

Infographic
REFERENCES

OECD Economic Surveys: Costa Rica 2025, https://doi.org/10.1787/048cf07b-en

OECD Economic Surveys: Finland 2025, https://doi.org/10.1787/985d0555-en

OECD Economic Surveys: Peru 2025, https://doi.org/10.1787/76f6eb73-en

OECD Economic Surveys: Colombia 2024, https://doi.org/10.1787/a1a22cd6-en

OECD Economic Surveys: Indonesia 2024, https://doi.org/10.1787/de87555a-en

OECD Economic Surveys: New Zealand 2024, https://doi.org/10.1787/603809f2-en

OECD Economic Surveys: Brazil 2023, https://doi.org/10.1787/a2d6acac-en

Garcia Soto and Koelle (2025): “Deforestation in Peru: Key facts and main drivers”. OECD Economics Department Working Paper No. 1846, https://doi.org/10.1787/e7786877-en


New Zealand: Towards a strong and sustainable recovery

By David Carey and Naomitsu Yashiro, OECD Economics Department

The economy bounced back quickly from the drop caused by COVID-19 in the first half of 2020 thanks to effective virus containment, measures to protect jobs and incomes and highly expansionary macroeconomic policies (Figure 1). Confronted with the highly contagious Delta variant in late 2021 and with high vaccination rates, the government shifted from an elimination strategy, which involved stringent lockdowns and large economic costs, to minimisation and protection. Under the new strategy, virus containment measures are much less strict than before, especially for people with vaccination certificates. The government has also announced plans for re-opening the border in early 2022, although these have been put on hold owing to the spread of the Omicron variant.

Figure 1. The economy is rebounding rapidly

Real GDP

Source: OECD Economic Outlook: Statistics and Projections (database).

However, macroeconomic stimulus has been so powerful in relation to the already vibrant state of the economy following the bounce back that the economy is now overheating. The labour market is tighter than ever and inflation has soared to 6%.

The OECD Economic Survey 2022 discusses four main priorities for making economic growth strong and socially and environmentally sustainable:

1. Restore price stability and put public finances on a more sustainable path

As inflationary pressure built up rapidly on the back of strong economic recovery and supply-side constraints, the Reserve Bank of New Zealand rightly initiated a monetary policy tightening cycle in October 2021. Judging by the stability of business leaders’ longer-term inflation expectations at around 2%, the Reserve Bank benefits from high credibility, which will reduce the costs of disinflation. If the government were to accelerate fiscal consolidation, that would reduce the burden on monetary policy of restoring price stability. It would also expand room for manoeuvre to support the economy in future downturns. In the longer term, the government will need to take steps to prevent large increases in public debt caused by population ageing and rising health-care costs, including by increasing the pension eligibility age.  

2. Increase housing affordability

Expansionary monetary policies and an initial easing in loan-to-value restrictions underpinned a surge in house prices from already elevated levels (Figure 2). The Reserve Bank rightly judges current house prices to be unsustainable. The ongoing tightening in monetary policy and macro-prudential regulations and the tax changes that made investment in rental properties less attractive are already slowing price increases. Recent urban planning reforms and increased funding for housing-related infrastructure have boosted new housing supply beyond demographic demand for it, progressively reducing housing shortages and laying the ground for durable improvements in housing affordability. To realise the full potential of urban planning reforms, local governments need greater capacity to finance housing-related infrastructure and stronger incentives to do so.

Figure 2. House prices have soared

House price-to-income ratios

Source: OECD Analytical house price indicators.

3. Increase productivity through greater diffusion of digital technologies

New Zealand’s productivity has been lagging behind other advanced economies, despite its good institutional settings. One way to boost productivity is to enhance the diffusion of digital technologies. New Zealand has good digital infrastructure and New Zealanders already have a well-rounded skills set to thrive in the digital workplace. Despite these good bases for digital transformation, the digital sector is small and New Zealand makes little use of digital technologies to boost its export performance. Implementing the national digitalisation strategy is essential for advancing New Zealand’s digital transformation. Specialised ICT skills run short, in part owing to COVID-19 related border restrictions. To build a strong domestic pipeline of ICT skills, students’ maths skills should be improved, digital apprenticeships developed and help provided for women, Māori and Pacific Peoples to pursue digital careers. Stronger coordination between export promotion and innovation support would help boost the export expansion by firms that leverage digital technologies. 

4. Implement measures to achieve greenhouse emissions abatement objectives

New Zealand is not on track to meet either its Nationally Determined Contribution (a 41% reduction in emissions from the 2005 level by 2030) or its 2050 targets – net zero carbon emissions and a reduction in biogenic methane emissions from agriculture of 24-47% from the 2017 level (Figure 3). To meet these targets at least cost, substantial increases in carbon prices from progressively tightening the supply of emissions permits will be needed, complemented by further measures that address market failures not corrected by carbon pricing alone. Examples of such measures include accelerating the uptake of electric vehicles and creating options to decarbonise heavy transport and freight, which would promote a shift to sustainable transport. 

Figure 3. Emission reductions need to be accelerated

Greenhouse gas emissions

Note: The red line shows the target path for gross emissions consistent with achieving both the 2030 Nationally Determined Contribution and, for non-agricultural sectors, the 2050 net zero emissions target. This line includes agricultural emissions with existing measures. The difference between the red line and zero in 2050 reflects gross emissions in non-agricultural sectors to be offset by carbon sinks, such as forestry, and agricultural emissions. 
Source: Ministry for the Environment (2021), New Zealand’s Projected Greenhouse Gas Emissions to 2050.

Reference 

OECD (2022), OECD Economic Surveys: New Zealand, OECD Publishing, Paris,  https://doi.org/10.1787/a4fd214c-en        


Asia & Pacific economies are projected to rebound from COVID-19

by Patrick Lenain and Kosuke Suzuki, OECD Economics Department

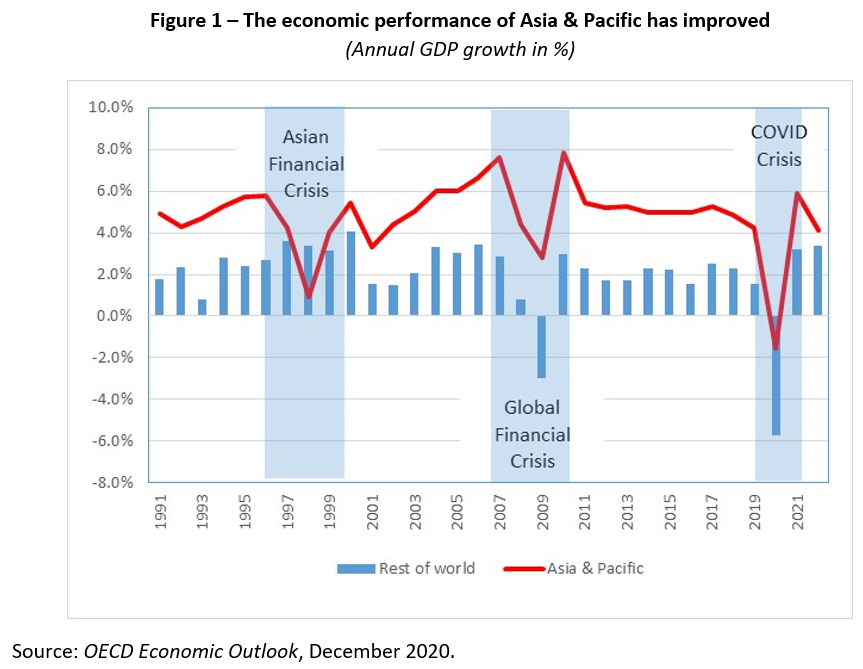
While the world is struggling to exit from the coronavirus crisis, the region Asia & Pacific is a notorious exception: many countries in the region have stopped the COVID-19 pandemic after the first wave, and they quickly returned on a path of growth in the second half of 2020 – a rare accomplishment. The OECD projects that the region’s recovery will continue in 2021 and 2022 (Table 1).

The region’s current resilience is in sharp contrast with the late 1990s, when the Asian Financial Crisis hit it very hard (Figure 1). Governments in the region drew lessons from this experience and were better prepared when the Global Financial Crisis arrived. They were also ready when the coronavirus struck: fiscal space was available, monetary policies were sound, exchange rates were flexible, foreign exchange reserves abundant, bank well capitalised, external indebtedness was low – and health systems had been re-organised.

Strong resilience in the face of crises contributes to long-term growth, especially in poor and emerging countries, as shown by a literature launched by Easterly et al. (1993). Thanks in large part to their growing resilience, the 15 countries and territories of Asia & Pacific doubled their share in world GDP from 19% in the early 1990s to 34% currently. The region has become an economic powerhouse and most likely will gain further ground. The Regional Comprehensive Economic Partnership (RCEP) recently signed will provide another boost to long-term growth, as discussed in the recent OECD Economic Survey of Thailand.

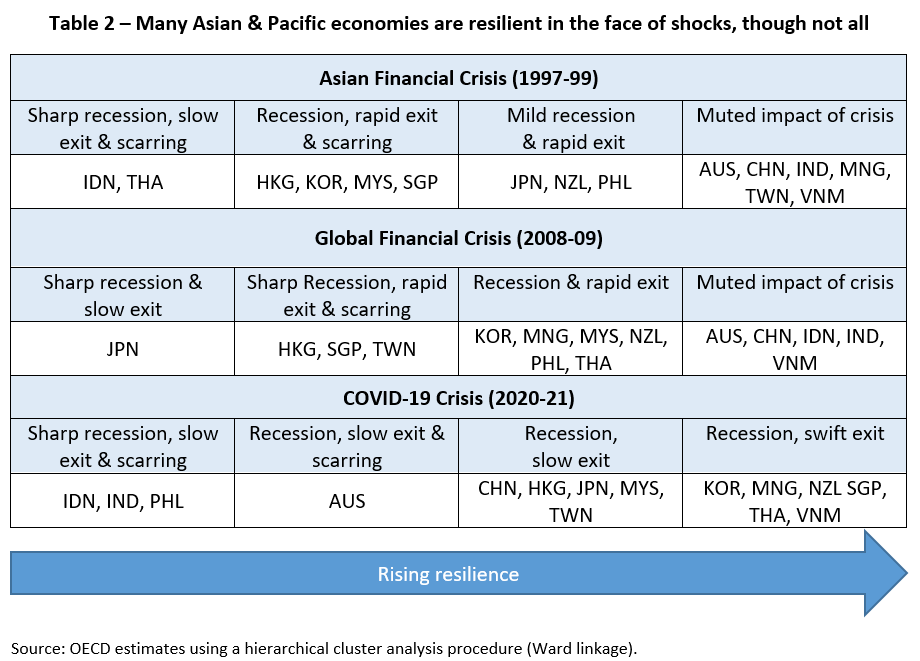
Of course, not all countries of the region have the same resilience. To throw light on this disparity, we use a hierarchical cluster analysis (Ward linkage), a statistical procedure that identifies homogenous groups of observations without making a difference between dependant and independent variables. We identify four groups of countries with common factors for each of the three crises. To group the region’s economies, we use the following indicators: 1) the depth of recession, 2) the speed of recovery, and 3) the post-recession scarring of growth. The first two indicators provide a contemporary measure of resilience when faced with a shock, while the third indicator is an ex-post measure of resilience. For the current crisis, we use the number of COVID-19 deaths as a proxy of ex-post resilience, in line with empirical findings that the spread of the coronavirus has damaged economic activity due a combination of government-imposed lockdowns and self-imposed lockdowns (Golsbee and Syverson, 2020).

Our cluster analysis reveals some diversity within the region. The resilience of individual economies has changed rapidly – in both directions (Table 2). Some key findings are:

  • Australia has shown great resilience during the first two crises, but fell into a recession with the coronavirus.
  • While China and India were resilient in the face of the first two crises, they have lost some ground with the COVID-19 pandemic, especially India.
  • Korea and Thailand have seen their resilience improve after each crisis.
  • Vietnam has consistently been the most resilient economy in the region.

Despite this diversity, the region displays overall a strong resilience and is placed to recover rapidly from the COVID-19 crisis, assuming that the pandemic is brought under control and that the large population can be vaccinated soon. If this happens, Asia & Pacific will confirm its new position as a global powerhouse. The return to economic growth should be an opportunity to address socioeconomic problems inherent in several countries, notably high informality and inequality, and make headways on a path of decarbonisation.

References:

Easterly, W., M. Kremer, L. Pritchett, and L. H. Summers (1993), “Good Policy or Good Luck? Country Growth Performance and Temporary Shocks,” Journal of Monetary Economics, 32, pp. 459–483.

Goolsbee A. and C. Syverson (2020), “Fear, Lockdown, and Diversion: Comparing Drivers of Pandemic Economic Decline 2020”, NBER Working Paper No. 27432, June.

OECD (2020), OECD Economic Surveys: Thailand 2020: Economic Assessment, OECD Publishing, Paris, https://doi.org/10.1787/ad2e50fa-en.

OECD (2020), OECD Economic Outlook, Volume 2020 Issue 2: Preliminary version, OECD Publishing, Paris, https://doi.org/10.1787/39a88ab1-en.


Better policies for better lives, the Kiwi way

by Carrie Exton, OECD Statistics and Data Directorate

Looking across the OECD’s well-being indicators, the average New Zealander has several reasons to feel cheerful: high employment, good air quality, and strong social support to name just a few. Yet, like every OECD country, there are still opportunities to improve. New Zealanders experience relatively low household income and housing affordability. Well-being outcomes such as health, education and income are unequally distributed. Roughly 1 in 6 children live in poverty, even before housing costs are considered. And New Zealand faces challenges in protecting its generous endowment of natural capital.

Opportunities for improving New Zealand’s well-being: an international perspective

For a government serious about raising
intergenerational well-being
, solid statistics will be important. Both New
Zealand Treasury
and Stats
NZ
have recently developed their own indicator dashboards. This reflects a
wider international practice that is gaining momentum in OECD countries. There
are certainly still some data gaps to fill, and well-being data are not always produced
with the frequency or granularity that fast-moving political decisions often demand.
Critically, well-being dashboards are only one part of the evidence base needed
to make policy decisions: they can help with diagnosis, but are largely silent
on the most efficient and effective cure. So to make a real difference, those dashboards
need to be embedded as part of a wider approach to advice and analysis.

New Zealand’s Wellbeing Budget, released on 30 May, is one
example of what that might look like. Some of the most important changes are
arguably the most boring: they are not about shiny new policies, but about the
processes that lie behind how policy is made. Well-being evidence informed
several different steps of the budget, from identifying priorities through to
assessing spending bids. This included adding well-being to the Treasury’s
cost-benefit analysis template and tools. A more holistic approach was taken
towards assessing spending bids (rather than narrowly within policy silos), and
greater collaboration among departments was promoted and incentivised.

New Zealand’s Wellbeing Budget process

Source: New Zealand Government (2018), Budget Policy Statement, Budget 2019, www.budget.govt.nz/budget/2019/fiscal-strategy/bps2019.htm

So what about the substantive policies? The Wellbeing Budget included a big cash injection for mental health; a focus on child well-being and steps to address family and sexual violence; funding for hospitals and schools; a boost to public transport; and steps to encourage sustainable land use and protect freshwater systems, among other measures.  

Together, the actions in the budget account for around 4% of
total public expenditure. One future challenge will be to apply a well-being
lens to reviewing baseline spend in agencies, which forms the bulk of the outlay.
Evaluating new policy programmes, post hoc, for their well-being impact will be
another important step, to help build the evidence base. Planned changes to the
Public Finance Act aim to provide a legislative basis for well-being monitoring
and objective-setting, putting this work on a more stable footing that can
enable a longer-term shift in the culture and practice of the civil service.

In New Zealand, then, the well-being approach goes beyond a
dashboard of statistics, or a set of new policies: it is also about a better
way of developing and implementing policies. It is still early days, but other
countries experimenting with well-being in their budgeting (including France,
Italy and Sweden) might look to New Zealand for some practical tips.

References:

OECD (2019), OECD Economic Surveys: New Zealand 2019, OECD Publishing, Paris.

OECD (2017), How’s Life 2017: Measuring Well-being, OECD Publishing, Paris https://doi.org/10.1787/how_life-2017-en  

New Zealand Treasury (2018), Living
Standards Framework: Introducing the Dashboard https://treasury.govt.nz/publications/tp/living-standards-framework-introducing-dashboard

Stats NZ (2019), Indicators Aotearoa New
Zealand https://www.stats.govt.nz/indicators-and-snapshots/indicators-aotearoa-new-zealand-nga-tutohu-aotearoa/


Delivering greater well-being in New Zealand: policy steps to increase housing affordability

by Andrew Barker, New Zealand Desk, OECD Economics Department

Over the past two decades, New Zealand has experienced one
of the largest house price increases among OECD countries, pushing up housing expenditure
as a share of income to very high levels. Affordability for first-time buyers
and renters has suffered, particularly in Auckland. This is a problem for
well-being as it reduces household finances available for other uses, can harm
health through various forms of deprivation such as poor nutrition, and adversely
affects labour market inclusion. There are also negative distributional consequences,
as increasing property prices benefit owners at the expense of renters.

Weak supply responsiveness in the face of strong housing
demand has been responsible for the escalation in prices. Rapid population
growth due to net inward migration has combined with record-low interest rates
to push up demand. Restrictive and complex land-use planning, infrastructure
shortages and insufficient growth in construction-sector capacity has impeded
new housing. The result has been persistent growth in the number of people per
dwelling in Auckland, and in the rest of the country too over the past five
years.

Housing costs account for a greater share of income than
in most OECD countries

1. Includes actual and imputed rents for housing, expenditure on furnishings and equipment, maintenance and repair of the dwelling. Imputed rents are likely to be biased upward for New Zealand because rental properties used as a proxy are not stratified by location, giving a higher weight to Auckland where rental properties are both more common and more expensive.
2. Median of the mortgage burden (principal repayment and interest payments) or rent burden (private market and subsidized rent). In Chile, Mexico, New Zealand, Korea and the United States gross income instead of disposable income is used due to data limitations.
Source: OECD (2017), How’s Life? and OECD, Housing Affordability Database.

Solutions should thus focus on removing barriers to new
housing supply. The government has taken a number of promising steps through
the establishment of an urban development authority and the Urban Growth Agenda,
further implementation of which will be key to achieving its ambitious goals. Strict
regulatory containment policies should be replaced with rules that facilitate
densification, while infrastructure funding and financing tools available to
local governments need to be expanded. The government has also taken a more
active role in the delivery of new housing supply through KiwiBuild. Despite
taking on considerable risk through underwriting or purchasing new homes,
KiwiBuild is yet to deliver a substantial increase in affordable housing. The
reset currently underway is a good opportunity to re-focus the programme towards
mitigating risks that developers are not well placed to manage, such as aggregating
fragmented land holdings.

Better targeting of government programmes (including KiwiBuild)
through focussing more on low-income renters would enhance overall well-being. Social
housing supply is low by international comparison and there are poor outcomes
for at-risk groups, including overcrowding, low quality housing and high
homelessness. Further expansion of social housing in areas where there are
shortages has the potential to deliver improvements across a number of
well-being dimensions, including health, education and life satisfaction.

New Zealand’s desirability as a place to live [cross reference to well-being blog] has contributed to its housing affordability challenges. Policy to support new housing supply and infrastructure where it is needed would allow those New Zealanders who have suffered most from unaffordable housing to better enjoy life in Aotearoa. 

References

OECD (2019), OECD Economic
Surveys: New Zealand
, OECD Publishing, Paris.


New Zealand has recently enjoyed strong economic growth, but housing and population ageing pose challenges

by David Carey, New Zealand Desk, OECD Economics Department.

New Zealand enjoyed strong economic growth during 2016, driven by high net inward migration, solid construction activity, booming tourism and supportive monetary policy, although in per capita terms growth has been more in line with that in other advanced economies. The terms of trade have rebounded to near record levels, boosting income growth. Growth eased somewhat during the last quarter of 2016 and the first quarter of 2017, in part due to temporary factors including the impact of unfavourable weather conditions on agricultural output and disruption from the November 2016 Kaikōura earthquake. The OECD projects that growth will return to around 3% in 2017‑18, supported by export growth from strong tourism demand and increases in dairy exports. However, slower net immigration is likely to curtail both consumption and residential construction, and the wind-down in the Canterbury earthquake rebuild will curb construction expenditure, more than offsetting the boost from the Kaikōura rebuild and the recently announced increases in infrastructure spending. The unemployment rate is expected to edge down to 4 ½ per cent by the end of 2018 and wage growth to rise moderately. Consumer price inflation should rise sustainably to 2% by the end of 2018, as the effects of oil price falls pass and capacity constraints bite.

While appropriate on the basis of the Reserve Bank of New Zealand’s inflation projections, current monetary policy settings have the downside of fuelling increases in house prices and household debt. As discussed in the accompanying housing blog, both have reached high levels by historical standards and in comparison with most other countries. Further progress is needed to reduce housing supply restrictions, and macro-prudential policy may need to be tightened further, notably by the implementation of debt-to-income limits to reduce financial stability risks.

The government’s prudent approach to fiscal policy puts New Zealand in good stead to cope with future global shocks and natural disasters. Like other countries, New Zealand also faces large spending pressures from public pensions and health-care costs in the longer term. To this end, the government has announced its intention to increase the age of eligibility for the public pension by six months each year from 2037, reaching 67 by 2040. Budget savings would be larger and inter-generational equity greater if this increase were to be brought forward, the transition period lengthened and the pension age subsequently indexed to life expectancy. The planned focus on increasing public-sector productivity should help to contain long-term increases in health-care outlays.

NZmacroblog

References
OECD (2017), OECD Economic Surveys: New Zealand, OECD Publishing, Paris.


Lifting New Zealand’s game on productivity

by Andrew Barker, New Zealand Desk, OECD Economics Department

Productivity growth will be the main driver of global economic growth and prosperity over the coming decades. For New Zealand, this represents both a challenge and an opportunity, as NZ productivity is below that of leading OECD countries (Figure 1). This problem is not new, and previous OECD work has shown that distance from markets is a substantial part of the explanation. The key question, considered in the 2017 OECD Economic Survey of New Zealand, is what can be done to improve generally sound policy settings in New Zealand so as to boost productivity, in spite of the economic challenges posed by its remote location.


NZ prod 1

Overcoming distance barriers means that New Zealand needs to do everything possible to increase benefits from international connections. As a small country, it is reliant on foreign direct investment to provide access to global supply chains and markets, promote local competition and drive technological, skills and managerial quality transfers. New Zealand’s comprehensive foreign investment screening regime should be narrowed, while reducing compliance costs and increasing predictability for investors. Although New Zealand has few other barriers to trade, there would be benefits from cutting remaining tariffs, strengthening trade facilitation measures and improving recognition of foreign licenses to practice. Digitalisation offers increasing opportunities for trade that is not affected by distance, heightening the importance of continuing efforts to modernise information technology infrastructure.

Facilitating international connections would also deliver benefits through increased competitive pressures, which can improve productivity through resource reallocation to the most productive firms, greater diffusion of existing technologies to laggards and increased incentives for innovation. Competition could also be improved by giving the Commerce Commission the power and resources to undertake market studies and through improving the efficiency of the insolvency regime.

Another key factor in New Zealand’s poor productivity performance is a low rate of capital investment. Options to address low investment include decreasing the high effective corporate tax rate through lowering the statutory rate, and increasing national saving through reducing taxation of non-housing saving vehicles. Reforms to urban planning and infrastructure funding arrangements will be important to address the drag on productivity from inflated house prices.

Finally, innovation is a key driver of productivity growth. Government support for R&D is low in New Zealand, and there is a low level of collaboration between firms and higher education and research institutions (Figure 2). Fiscal support for R&D should be increased, firm-level caps on R&D grants need to be removed, and support for successful collaboration between research institutions and industry should be maintained or increased.

NZ prod 2

References

OECD (2017), OECD Economic Surveys: New Zealand, OECD Publishing, Paris.


The downsides of New Zealand’s inflated house prices

by David Carey and Andrew Barker, New Zealand Desk, OECD Economics Department

In real terms, house prices in New Zealand increased more than in any other OECD country between 2010 and 2016 (Figure 1). While house price increases have supported economic growth through wealth-induced consumption growth, they have also created a number of social and economic problems. Housing affordability has been undermined, particularly for those with low incomes: housing costs for the bottom fifth of households reached 54% of income in 2015, up from under 30% in 1990. Driven by mortgage growth, the ratio of household debt to disposable income now exceeds the level recorded prior to the global financial crisis and is high compared with other OECD countries (Figure 2). This raises financial stability risks. House price increases also undermine productivity growth by inhibiting people from moving into economically successful, highly productive urban areas.


NZ housing 1

NZ housing 2

Price increases have been most pronounced in Auckland. Around half of all new migrants settle in Auckland, exceeding its (one third) share of the national population. Since 2008, new housing construction in Auckland has failed to keep pace with population growth. Prices in the rest of New Zealand, on the other hand, have risen despite little or no increase in the population-to-dwelling ratio. Throughout the country, record low interest rates have magnified house price increases.

The long-term solution, for Auckland in particular, is to address supply constraints. The recent Auckland Unitary Plan will allow greater densification and some expansion of urban development limits. However, insufficient infrastructure has constrained the extent to which densification is possible in central parts of Auckland. As in other parts of the country, infrastructure provision is primarily the responsibility of local governments, which face financial constraints and weak incentives to invest in amenities to facilitate growth. Options to broaden funding sources for public infrastructure should be explored, including more user charging, targeted property taxes, more cost-reflective developer contributions, sharing in a tax base linked to local economic activity and further recourse to alternative delivery models such as public-private partnerships. Reforms to the urban planning system are also needed – recommendations from the OECD’s Environmental Performance Review and the Productivity Commission’s Inquiry into Land Use Planning should be considered in order to deliver a more responsive and efficient planning system.

Relieving supply constraints takes time, however, so demand-side measures are also important to address financial stability risks. The Reserve Bank has progressively tightened restrictions on loan-to-value ratios, constraining the maximum amount that banks can lend to most customers. House price increases have moderated since the last round of tightening in October 2016. Debt-to-income restrictions, which complement loan-to-value ratios by limiting further debt as house prices increase relative to incomes, may be necessary if house price increases resume, and should be added to the Reserve Bank’s toolkit following analysis demonstrating that benefits would outweigh costs.

References

OECD (2017), OECD Economic Surveys: New Zealand, OECD Publishing, Paris.

OECD (2017), Environmental Performance Review: New Zealand, OECD Publishing, Paris.

NZPC (2017), Better Urban Planning, Inquiry Report, Wellington.