Reviving business dynamism in Japan

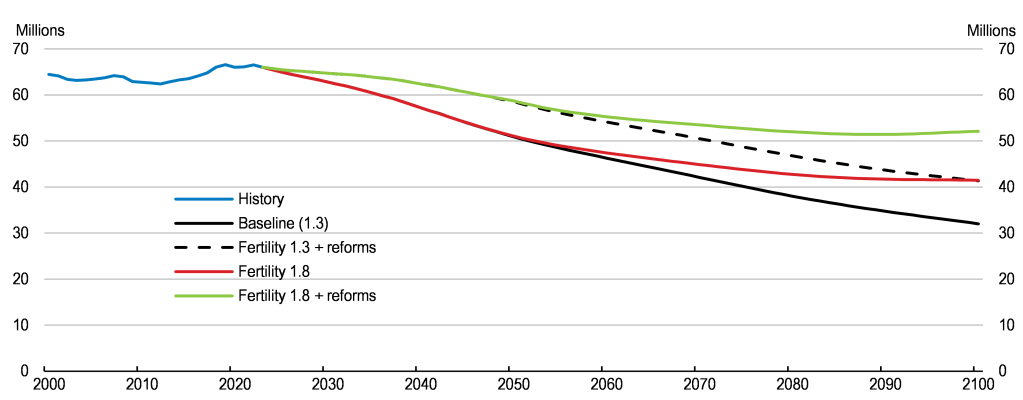
In the context of a shrinking working-age population, Japan needs to reignite productivity growth to sustain living standards. Annual growth in hourly productivity fell from 1.2% in the 2000-08 period to 0.3% between 2019 and 2024. 

By Patrizio Sicari, OECD Economics Department


Business dynamism, which spurs productivity by encouraging firm entry and subsequent growth, as well as the exit of less productive firms, is weak in international perspective (Figure 1). As highlighted in the 2026 OECD Economic Survey of Japan, strengthening competition, making public support to small and medium-sized enterprises (SMEs) more effective and reforming the innovation framework and incentives for start-ups are key to a more dynamic entrepreneurial ecosystem.

Overhauling cumbersome business regulations

Starting a business is relatively complex, requiring several procedures across different institutions. The introduction of online business registration in 2020 formally reduced the need for time-consuming direct contact with licensing, employment and social security authorities. Access to the relevant online services occurs through a common digital authentication platform (gBizID) managed by the Digital Agency. However, limited digitalisation means that this opportunity is not fully exploited.

Further improving the availability and uptake of digitised administrative procedures requires expanding gBizID’s service coverage across local governments and promoting its adoption among firms. Among corporations, only 33% have registered with the service as of early 2026, well below the government’s 80% target by 2030. Seamless digital integration across government services would enable firms to avoid resubmitting information already held by other public authorities (the “once-only” principle). Adopting a “silence is consent” principle would also ease procedural uncertainty for more complex licences and permits.

Ensuring efficient capital allocation towards more dynamic SMEs

As of March 2025, around 45% of SMEs held publicly guaranteed loans offering 80% coverage of private banks’ credit risk, amounting to 5.3% of 2024 GDP (Figure 2, Panel A). Public financial institutions provided SMEs with a further 4.2% of GDP in direct loans. Although at levels below pandemic peaks, these broad-based guarantees and subsidised loans weigh on business dynamism. They prevent the exit of low-productivity firms, hindering the reallocation of resources towards more dynamic firms. Indeed, the share of zombie firms eased somewhat after the phase-out of pandemic-era support, but remained elevated at 14.3% in FY2024 (Panel B). Lowering guarantee coverage rates would improve risk sharing between banks and the public sector by strengthening banks’ incentives to carry out deeper credit screening.

Public SME support is largely bank-based, constraining access for innovative start-ups lacking tangible assets for collateral or personal guarantees required by risk-averse banks. Limited availability of alternative financing sources also prevents their scaling up. Greater reliance on public venture capital (VC) investment would boost the valuation and scaling of artificial intelligence and deep-tech start-ups. The limited size of the late-stage VC market often forces highly innovative start-ups to go public prematurely, after which many struggle to secure follow-on funding, constraining their productivity potential. Complementing public VC with a wider use of mezzanine financing instruments, which offer more flexible growth capital, would also help limit direct public exposure.

Redesigning public support for broader innovation and scaling up

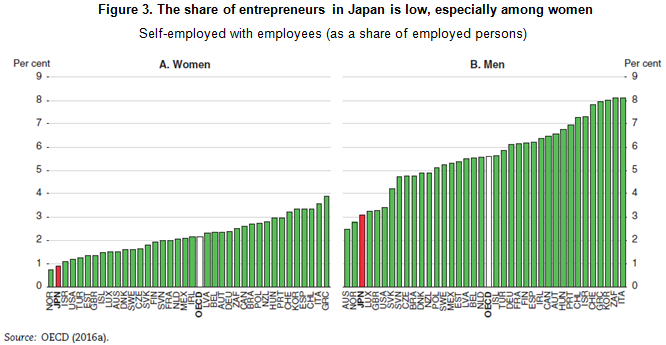
Japan has the fifth highest expenditure on research and development (R&D) in the OECD, but this is mainly commercially oriented and concentrated in large manufacturing firms. Openness to foreign R&D funding and collaboration with universities remains limited, especially among SMEs, which performed just 5% of business R&D in 2023 (Figure 3). R&D tax incentives make up around 75% of total public support for business R&D, but they mainly benefit large incumbents. This reduces the likelihood of SMEs developing breakthrough inventions and scaling up, constraining innovation and its diffusion.

The R&D tax system should be simplified. The main existing schemes are combinable but separately administered, with different eligibility criteria, rate calculations, and varying deduction ceilings. In addition, a recent tax reform introduced higher R&D tax credit rates for business investment in strategic-technology research fields from FY2027, which could increase fragmentation. Together with various revisions and temporary provisions, these features lower the system’s predictability and make it administratively burdensome. A more streamlined and stable system would help increase uptake among smaller innovative firms, which are more likely to drive productivity growth.

To support scaling, public R&D policy should more effectively target innovative start-ups, reducing the share of support to profitable incumbents that are likely to invest in innovation regardless. Amendments to the Corporate Tax Act approved in March 2026 move in this direction, by allowing innovative SMEs, which typically have little or no tax liabilities, to carry forward unused R&D tax credits for up to three years from FY2027. However, this was accompanied by less favourable effective credit rates for firms that do not increase R&D spending over time. Complementary measures making credits partly refundable for research aligned with specific policy objectives (e.g. fostering systemic innovation) would strengthen investment incentives for early-stage firms and help broaden the innovation base.

In addition, the 2026 OECD Economic Survey of Japan provides policy recommendations to enhance competition in services, encourage greater inward foreign direct investment, promote an effective skills pipeline for innovation-oriented research and boost the adoption of advanced digital technologies.

Visit the OECD’s Japan Economic Snapshot page for further information.

References

OECD (2026), OECD Economic Survey of Japan, OECD publishing, Paris.


Addressing the challenges of high government debt and population ageing in Japan

By Müge Adalet McGowan, OECD Economic Department

Japan has coped well with the pandemic and the energy crisis, but the fiscal support to help mitigate their impact has pushed up gross public debt to an unprecedented level of almost 245% of GDP in 2022. Demographic change will exacerbate these challenges. Japan’s population is projected to decline from 135 million to around 96 million in 2060, while the elderly population will reach 79% of working-age population, one of the highest in the OECD (Figure 1). The government projects that with ageing, social security spending will rise from 21.5% of GDP in 2018 to around 24% by 2040. Without corrective action, this would substantially worsen long-term fiscal sustainability.

The 2024 OECD Economic Survey of Japan discusses fiscal and structural reforms to bring debt levels down. Japan lacks a credible medium-term fiscal consolidation strategy to put public debt on a downward path and build fiscal buffers to increase resilience to shocks, which should include both revenue and expenditure measures. Containing spending growth requires health and long-term care reforms. Lengthy hospital stays and a high number of medical consultations suggest room for efficiency gains in providing high-quality care to Japan’s ageing population. Gradually raising tax revenues, including by increasing the consumption tax rate further in small increments, should be another element of broad fiscal reforms. Raising productivity and employment, particularly among women and older people, is also key to limit the effects of demographic headwinds.

Figure 1. Japan’s elderly dependency ratio is high and will continue rising

Note: Ratio of population aged 65 and above to population aged 20-64. Projections are based on medium fertility variant.
Source: OECD Demography and Population Statistics database.

Under current fertility, employment and immigration rates, employment would fall by 52% by 2100 (Figure 2). The government aims to increase the fertility rate from 1.3 to 1.8, which would help mitigate the decline in employment. One priority is to strengthen the weak financial position of youth, which leads many to delay or forgo marriage and children. Making it easier to combine paid work and family is also critical so that women are not forced to choose between a career and children. Increasing the take-up and duration of parental leave by fathers can also boost fertility rates. Policies should also cut the cost of raising children, the key obstacle to couples achieving their desired number of children.

Given the difficulty of raising fertility, which partially reflects changing social norms, and the decades-long wait for a pay-off from higher fertility, it is essential to prepare for a low-fertility future, in part by raising labour force participation. Hence, Japan should also continue to remove obstacles to the employment of women and older persons and make greater use of foreign workers, which would have a more immediate impact on labour shortages. Breaking down labour market dualism, which disproportionately affects youth, women, and older people, is a priority. Abolishing the right of firms to set a mandatory retirement age (usually at 60) and raising the pension eligibility age would also promote employment. These reforms should be accompanied by measures to re-skill older workers, whose participation in lifelong learning is relatively low. Offering long-term residency to workers and their families and broad policies to increase the integration of foreign workers would boost foreign worker inflows.

Figure 2. Reforms to boost fertility, employment rates and foreign worker inflows would mitigate the decline in employment

Note: The reforms include; i) a doubling of inflows of foreigners to 200 000 per year; ii) a convergence of female employment rates to those of men by 2050; and iii) the employment rate for each five-year cohort from 60-64 to 70-74 converges to that of the preceding cohort (i.e., the rate for the 60-64 group would rise to the 2021 rate for the 55-59 age group, etc.) by 2050. 
Source: OECD calculations based on the OECD Long-term Model.

References

OECD (2024), OECD Economic Surveys: Japan 2024, OECD Publishing, Paris. https://doi.org/10.1787/41e807f9-en


How the digital transformation can help Japan secure sustainable growth

By Kei Oguro, Douglas Sutherland and Vincent Koen, OECD Economics Department

The pandemic dealt a heavy blow to the Japanese economy, at a time past reforms were bearing fruit in raising labour force participation and reducing the size of budget deficits. Difficulties in bringing infections under control and the pressure new cases put on hospitals forced the government to declare a succession of states of emergency. The prolonged imposition of sanitary measures in combination with voluntary distancing measures held back growth after the initial bounce-back in economic activity (Figure 1).  However, after a relatively slow start, the share of the fully-vaccinated population is now amongst the highest in the OECD. The government has recently outlined a new sizeable policy package to support the recovery. Thus conditions are in place to underpin a strong pick-up in growth, once the impact of the omicron variant is mitigated.

Figure 1. The pandemic hit economic activity hard

Real GDP

Source: OECD Economic Outlook Database No.110.

The pandemic exposed structural weaknesses, notably the long-standing plight of temporary and non-regular workers, who were more exposed to the economic downturn. But other weaknesses had hitherto been less in focus. The difficulties workers, businesses and government faced in moving to remote working and targeting support to those most in need, highlighted the patchiness of the digital transformation.

The OECD Economic Survey of Japan advocates policies to address these weaknesses. These policies would contribute to sustainability by boosting productivity and resilience to future shocks. In addition, they would reduce inequalities and promote fiscal sustainability.

Addressing structural weaknesses to boost productivity and labour supply

Past reforms have successfully increased labour force participation by women and older workers.  Yet more can be done, particularly by promoting workplace flexibility and addressing other barriers to participation. Continuing Work Style reforms that promote flexibility and cap overtime hours while increasing the provision of childcare places will help boost participation further (Figure 2). Reforms such as promoting equal pay for equal work also promise to reduce inequalities by eroding the differences between regular workers and those workers with temporary jobs or less secure positions. Output can be boosted further by raising productivity growth, which has been very sluggish in recent years. One aspect of this is weak business dynamism hindering the diffusion of new technologies. Policies to enhance entry and exit of firms, such as by increasing competitive pressures and facilitating bankruptcy, could help in this context.

Figure 2. Labour force participation has risen but gender gaps remain sizeable

Source: OECD LFS by sex and age indicators and gender wage gap indicator.

Making the most of digital transformation

Japan is well placed to benefit from greater digitalisation. The digital infrastructure is well-developed and most people are highly skilled. However, while some parts of the economy are at the international frontier, such as in robotics, the diffusion of new technologies is often not widespread. Small firms and those in the service sector in particular often make less use of digital technologies. Furthermore, research and development in the ICT sector is weaker than in the rest of the economy and than in ICT sectors elsewhere in the OECD. Policies that strengthen business dynamism and promote the diffusion of new technologies would help lift productivity. Complementary investments in intangible capital are needed to ensure that the potential benefits are fully exploited.

The government itself can also play a role in promoting the adoption of digital tools. At present, hankos (physical stamps) are still widely required for many official procedures and the use of online forms for government services is amongst the lowest in the OECD (Figure 3) and this has hindered the development of digital service provision. Some parts of government have already taken the initiative to raise e-government supply, to wit the case of the city of Fukuoka, which has identified around 3 800 procedures that can now be completed without a hanko. However, more can be done in this direction and to utilise available data. The newly established Digital Agency can push such developments across government.

Figure 3. Individuals using the Internet for sending filled forms via public authorities’ websites

Source: ICT Access and Usage by Households and Individuals database, Main Science and Technology Indicators.

To capture the full benefits from digitalisation, policy needs to ensure people have the necessary skills. The government has recently ensured that schoolchildren have access to computers, but schools and teachers are often unprepared and need training and support to make best use of them. In addition, comparatively few students graduate in science, technology, engineering and mathematics (STEM) disciplines, particularly women (Figure 4). Reforming STEM curricula to make them more attractive to study and breaking down the barriers, especially for women, could enhance labour supply and deepen the pool of talent in a digital era. Finally, the system of firm-based training and adult learning is weak. Promoting training and job mobility will also help raise skills and productivity and help those workers most at risk from technological shocks remain in employment longer.

Figure 4. Relatively few students graduate in science, technology, engineering or mathematics

Source: OECD Education at a Glance, 2020.

References: OECD Economic Surveys: Japan 2021


Asia & Pacific economies are projected to rebound from COVID-19

by Patrick Lenain and Kosuke Suzuki, OECD Economics Department

While the world is struggling to exit from the coronavirus crisis, the region Asia & Pacific is a notorious exception: many countries in the region have stopped the COVID-19 pandemic after the first wave, and they quickly returned on a path of growth in the second half of 2020 – a rare accomplishment. The OECD projects that the region’s recovery will continue in 2021 and 2022 (Table 1).

The region’s current resilience is in sharp contrast with the late 1990s, when the Asian Financial Crisis hit it very hard (Figure 1). Governments in the region drew lessons from this experience and were better prepared when the Global Financial Crisis arrived. They were also ready when the coronavirus struck: fiscal space was available, monetary policies were sound, exchange rates were flexible, foreign exchange reserves abundant, bank well capitalised, external indebtedness was low – and health systems had been re-organised.

Strong resilience in the face of crises contributes to long-term growth, especially in poor and emerging countries, as shown by a literature launched by Easterly et al. (1993). Thanks in large part to their growing resilience, the 15 countries and territories of Asia & Pacific doubled their share in world GDP from 19% in the early 1990s to 34% currently. The region has become an economic powerhouse and most likely will gain further ground. The Regional Comprehensive Economic Partnership (RCEP) recently signed will provide another boost to long-term growth, as discussed in the recent OECD Economic Survey of Thailand.

Of course, not all countries of the region have the same resilience. To throw light on this disparity, we use a hierarchical cluster analysis (Ward linkage), a statistical procedure that identifies homogenous groups of observations without making a difference between dependant and independent variables. We identify four groups of countries with common factors for each of the three crises. To group the region’s economies, we use the following indicators: 1) the depth of recession, 2) the speed of recovery, and 3) the post-recession scarring of growth. The first two indicators provide a contemporary measure of resilience when faced with a shock, while the third indicator is an ex-post measure of resilience. For the current crisis, we use the number of COVID-19 deaths as a proxy of ex-post resilience, in line with empirical findings that the spread of the coronavirus has damaged economic activity due a combination of government-imposed lockdowns and self-imposed lockdowns (Golsbee and Syverson, 2020).

Our cluster analysis reveals some diversity within the region. The resilience of individual economies has changed rapidly – in both directions (Table 2). Some key findings are:

  • Australia has shown great resilience during the first two crises, but fell into a recession with the coronavirus.
  • While China and India were resilient in the face of the first two crises, they have lost some ground with the COVID-19 pandemic, especially India.
  • Korea and Thailand have seen their resilience improve after each crisis.
  • Vietnam has consistently been the most resilient economy in the region.

Despite this diversity, the region displays overall a strong resilience and is placed to recover rapidly from the COVID-19 crisis, assuming that the pandemic is brought under control and that the large population can be vaccinated soon. If this happens, Asia & Pacific will confirm its new position as a global powerhouse. The return to economic growth should be an opportunity to address socioeconomic problems inherent in several countries, notably high informality and inequality, and make headways on a path of decarbonisation.

References:

Easterly, W., M. Kremer, L. Pritchett, and L. H. Summers (1993), “Good Policy or Good Luck? Country Growth Performance and Temporary Shocks,” Journal of Monetary Economics, 32, pp. 459–483.

Goolsbee A. and C. Syverson (2020), “Fear, Lockdown, and Diversion: Comparing Drivers of Pandemic Economic Decline 2020”, NBER Working Paper No. 27432, June.

OECD (2020), OECD Economic Surveys: Thailand 2020: Economic Assessment, OECD Publishing, Paris, https://doi.org/10.1787/ad2e50fa-en.

OECD (2020), OECD Economic Outlook, Volume 2020 Issue 2: Preliminary version, OECD Publishing, Paris, https://doi.org/10.1787/39a88ab1-en.


Meeting Japan’s intertwined challenges of population ageing and high government debt

By Randall Jones and Haruki Seitani, Japan Desk, OECD Economics Department

With faster growth in the past six years, Japan’s real GDP growth in per capita terms has converged toward the OECD average and job creation has been strong. However, labour productivity and per capita income are well below leading OECD economies (Figure 1), while Japan faces challenges of rapid population ageing and high government debt. The 2019 OECD Economic Survey of Japan explores ways to address those challenges.

Japan’s population is projected to decline by one-fifth to around 100 million by 2050, while the elderly population will reach 79% of working-age population, remaining the highest in the OECD. One important challenge of the demographic change is a shrinking labour force. Assuming constant labour market entry and exit rates, Japan’s labour force would drop by a quarter from 67 million to 51 million by 2050 (Figure 2). Reforms of labour policies and practices to remove obstacles and disincentives to work for men and women of all ages would limit the decline in the labour force.

Demographic change is also having a big impact on the fiscal situation. Public social spending doubled from 11% of GDP in 1991 to 22% in 2018, surpassing the OECD average. Twenty-seven consecutive years of budget deficits have driven up gross public debt from 60% of GDP to 226%, the highest ever recorded in the OECD area. Population ageing is projected to raise social spending by another 4.7% of GDP over 2020-60. An illustrative analysis indicates that fiscal consolidation beyond the government’s FY 2025 primary surplus target is necessary to stabilise government debt (Figure 3).

Those challenges are
intertwined. Weak economic growth, due to low productivity and declining labour
force, makes it difficult to ensure fiscal sustainability. Distortions in tax
and benefit systems impede employment, particularly of women and the elderly. Against
this backdrop, the main messages of this Survey
are:

  • Bold structural reforms, including improved
    corporate governance and policies to make small and medium-sized enterprises
    more dynamic, are needed to boost productivity and promote inclusive growth as
    labour inputs decline.
  • Fundamental labour market reform is a priority
    to enable Japan to make full use of its human resources, thereby mitigating the
    impact of a shrinking labour force.
  • Achieving fiscal sustainability requires a
    detailed consolidation plan that includes measures to control spending in the
    face of rapid population ageing and gradual hikes in revenue, beginning with
    the 2019 consumption tax hike.

Further reading:

OECD (2019), OECD Economic Surveys: Japan 2019, OECD Publishing, Paris.


Japan needs policies to boost productivity for inclusive growth

by Randall Jones, Head of Japan Desk, OECD Economics Department

Labour productivity in Japan is about a quarter below the average of the top half of OECD countries (Figure 1), which is surprising given Japan’s outstanding performance in education and skills and high level of R&D spending. As in other countries, the labour productivity gap between leading and lagging firms has widened in Japan, resulting in greater wage inequality between firms. The 2017 OECD Economic Survey of Japan examines the scope for positive synergy between policies to promote productivity and inclusive growth.

Japan fig 1

The Survey stresses the importance of facilitating the exit of non-viable firms and the entry of innovative start-ups to narrow inter-firm productivity and wage gaps. Japan’s low exit rate, which is only about half of that in other advanced countries (Figure 2), results in a large number of non-viable firms. The widespread use of personal guarantees and the stringency of the personal insolvency regime are important impediments to firm exit. Japan’s growth strategy set a goal of raising both the exit and entry rates to around 10%. Of course, increased exit of non-viable firms would raise the number of displaced workers, making it important to promote their re-employment.

Japan fig 2

Japan’s firm entry rate is also well below other advanced economies (Figure 2, Panel B). Consequently, firms more than ten years old account for three-quarters of Japan’s small enterprises compared to less than half in most OECD countries. The Survey identifies weak entrepreneurship in Japan as a major reason for the low entry rate. Indeed, the number of entrepreneurs in Japan is among the lowest in the OECD (Figure 3). Increasing entrepreneurship requires improving its image; less than a third of Japan’s working-age population views entrepreneurship as a good career choice, the lowest in the OECD. The negative perception in Japan reflects a lack of perceived opportunities (7%, the lowest in the OECD), perceived capabilities (12%, the lowest) and a fear of failure (55%, the second highest).

Japan fig 3

The main messages of this Survey on the nexus between productivity and inclusive growth are:

  • The dispersion in productivity and labour income between firms is relatively large in Japan and has been widening.
  • The firm entry and exit rates in Japan are well below other advanced economies and the number of entrepreneurs is low.
  • Policies to facilitate the exit of non-viable firms and to increase the entry of innovative new firms are a priority to boost productivity and promote inclusive growth.

References

Ministry of Economy, Trade and Industry (2014), 2014 White Paper on Small and Medium Enterprises in Japan, Tokyo.

OECD (2016b), Entrepreneurship at a Glance, OECD Publishing, Paris.

OECD (2017a), OECD Economic Outlook: Statistics and Projections (database).OECD, Paris.

OECD (2017), OECD Economic Surveys: Japan, OECD Publishing, Paris.