The hidden carbon markets: how forests can balance emissions

Positive effects of forests can offset greenhouse gas emissions
How OECD Economic Surveys reveal the drivers of deforestation, and the policy tools to stop it


By Michael Koelle, OECD Economics Department

Tropical forests cover vast swaths of land in many OECD member and accession countries, including more than 75% of Costa Rica’s territory, and over half of Brazil, Colombia, Indonesia and Peru. In these countries, emissions from land use, land use change and forestry (LULUCF), largely driven by forest loss and degradation, account for a large share of total emissions (Figure 1). In fact, land use emissions are in some cases the main driver of national emission trends. But forests can also be part of the solution, as the experiences of Finland and New Zealand, two forest-rich OECD members, teach us.

For many countries, forests are no longer just a conservation issue, they are central to climate mitigation plans. Turning forests into carbon sinks is one of the most cost-effective ways to offset hard-to-abate emissions from agriculture, transport and energy. Finland and New Zealand have long had negative LULUCF emissions thanks to sustainable forest management and afforestation. Costa Rica managed to turn around LULUCF emissions, converting its forests into a carbon sink. Indonesia aims to achieve net negative emissions from LULUCF by 2030 while in Peru and Brazil, LULUCF accounts for 65% and 38% of planned emissions reductions by 2050, respectively. The economic case for protecting forests, through stronger enforcement, property rights, sustainable agriculture, and better incentives, has never been clearer. 

Insights from Economic Surveys: What’s really driving deforestation?

What do Brazil, Costa Rica, Colombia, Finland, Indonesia, New Zealand, and Peru have in common? They are all forest-rich economies, and each has been subject of in-depth analysis in OECD Economic Surveys. These studies go beyond emissions reporting. They dig into the underlying economic drivers of deforestation and discuss what can be done to turn forests into carbon sinks. While each country has its own context, common drivers of deforestation emerge. Forest loss is rooted in economic structures and incentives, from the rapid expansion of agriculture to unclear or unenforced property rights and misalignment between individual incentives and broader societal goals. Developing forest-based activities that generate sufficient economic value while keeping forests intact is far from impossible, given that cleared forest land is often used for low-profitability activities. Moreover, as seen in Finland and New Zealand, afforestation can be one of the least costly ways to reduce net greenhouse gas emissions. Tackling deforestation therefore requires structural policy responses that make choosing forests the economically sensible option, not just environmental regulation.

Fostering sustainable agriculture

Across all countries studied the expansion of the agricultural frontier is the main driver of deforestation. In Peru, OECD research shows that 90% of all deforested land is used for agriculture and livestock-rearing (Garcia Soto and Koelle, 2025). Moreover, 75% of these lands are identified as mixed-use, where farmers combine crop growing and livestock grazing on relatively small plots. In Brazil, cattle is a major pressure; in Indonesia, palm oil plantations continue to push into forest areas. Cattle grazing was also a main driver of deforestation in Costa Rica and Colombia. Most of these activities have low productivity and profitability, making extensive use of underpriced land. As Finland’s experience shows, managing soil emissions from agriculture and forestry can become a crucial issue even when forest stocks have stabilised.

To address this, OECD Economic Surveys recommend:

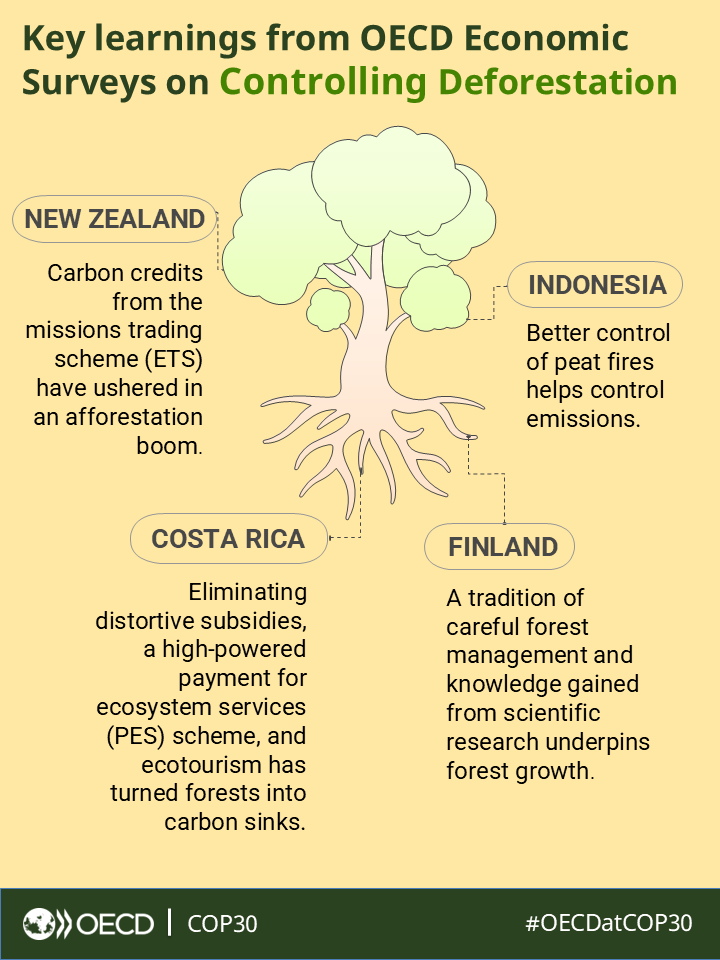
  • Eliminating environmentally harmful agriculture subsidies, such as cattle ranching subsidies, which contributed to successful reforestation in Costa Rica.
  • Improving scientific knowledge of agriculture, soils and forests, which provides the basis for cost-efficient emissions reduction and carbon storage activities in Finland.
  • Boosting productivity on existing land, to reduce pressure to expand the agricultural frontier.
  • Incentivising agroforestry and sustainable land-use practices and enforcing compliance with the law and regulations tied to land rights.

Strengthening property rights

Most deforestation occurs on land that is either publicly owned or of unclear or unenforced property rights. In Peru, state lands without designated purpose are at the highest risk for deforestation. In Colombia, land rights are often unclear and ambiguous after decades of conflict and displacement of rural populations. In Brazil, a strong framework exists, but enforcement is a challenge. Indigenous communities are especially vulnerable in defending their property rights, even if formally recognised.

OECD Economic Surveys recommend:

  • Creating comprehensive land registries using modern technology.
  • Strengthening property rights and law enforcement in remote areas, including based on satellite imagery.
  • Recognising and enforcing indigenous land rights, which are linked to lower deforestation rates.

Aligning incentives with climate goals

Even with secure land rights and strong enforcement, forest conservation must make economic sense. Intact forests need to generate real value for communities and landowners. Payment for ecosystem services (PES) that provide payments to forest owners for forest preservation are an essential policy tool. Costa Rica’s model stands out: funded by an earmarked portion of fuel taxes it covers 40% of all the nation’s forests, even if financing needs to be put on a broader footing. Other countries have significantly underfunded PES systems or rely mostly on international mechanisms like REDD+ and Article 6 of the Paris Agreement that provide a global mechanism for protecting the world’s remaining forests, but implementation is slow and partly untested. The possibility to sell carbon credits through emissions trading schemes (ETS) can provide powerful incentives for reforestation. New Zealand’s pioneering inclusion of forestry in its ETS, where forest owners can earn carbon credits for capturing carbon through tree growth and must surrender credits if they deforest, provides useful lessons on how such schemes should be designed in forest-rich countries. There should be differentiation according to the emissions removal potential of different forest types, and the design should ensure a sufficiently high carbon price to incentivise carbon-efficiency in non-LULUCF sectors.

The OECD Economic Surveys call for:

  • More robust, broader, and sustainably financed payment for ecosystem services schemes and the expansion and integration of emissions trading schemes.
  • Better integration of eco-tourism, agroforestry, pisciculture and sustainable timber industry into regional economic development and planning.
  • Public incentives that complement, not contradict, private-sector logic.

Conclusion

To truly value forests, governments must embed them into national budgets, tax systems and investment frameworks. Forest conservation must be seen as a sensible investment into preserving the nation’s natural wealth and resources. The cost of these investments is often relatively modest but strong leadership and coordination is needed to ensure that institutions and incentives all work in the same direction.  At COP30 in Belem, forest rich countries have a chance to lead, not just in emission reductions, but also in showing how forests can support climate goals and the economy.

Infographic

REFERENCES

OECD Economic Surveys: Costa Rica 2025, https://doi.org/10.1787/048cf07b-en

OECD Economic Surveys: Finland 2025, https://doi.org/10.1787/985d0555-en

OECD Economic Surveys: Peru 2025, https://doi.org/10.1787/76f6eb73-en

OECD Economic Surveys: Colombia 2024, https://doi.org/10.1787/a1a22cd6-en

OECD Economic Surveys: Indonesia 2024, https://doi.org/10.1787/de87555a-en

OECD Economic Surveys: New Zealand 2024, https://doi.org/10.1787/603809f2-en

OECD Economic Surveys: Brazil 2023, https://doi.org/10.1787/a2d6acac-en

Garcia Soto and Koelle (2025): “Deforestation in Peru: Key facts and main drivers”. OECD Economics Department Working Paper No. 1846, https://doi.org/10.1787/e7786877-en


Indonesia: making the economic recovery sustainable and inclusive

by Andrea Goldstein, OECD Economics Department

Despite the recession, the first in 20 years, Indonesia avoided an even larger downturn in 2020 thanks to a credible economic policy response. The latest OECD Economic Survey of Indonesia acknowledges that the size of the support was constrained by low tax revenue and underscores that disbursing the package proved initially difficult and slow. But it was accompanied by economic reforms, showing that meaningful efforts at improving market functioning can be made even in the midst of a severe crisis.

The economy is recovering. GDP shrunk by 2.1% in 2020 and the Survey sees growth of 4.9% for 2021 and 5.4% in 2022. The rebound is sustained by pent-up demand for consumer goods and capital goods and will gain momentum as containment measures are phased out and vaccination progresses to the entire archipelago of 17 000 islands.

  1. Other G20 EMEs include Argentina, Brazil, China, India, Mexico, Russia, Saudi Arabia, South Africa, and Turkey.
    Source: OECD Economic Outlook 108 database updated.

The economic outlook is surrounded by substantial risks and uncertainties

  • Most Indonesians work in the informal sector and their limited savings were used to guarantee basic necessities during lockdowns. The emerging middle class that was celebrated in the 2010s found itself much more vulnerable than expected – how fast will it regain confidence and therefore access finance to resume spending, especially in consumer durables?
  • On the upside, the global recovery could be stronger than expected and boost demand for Indonesian goods and services.
  • On the downside, Indonesia, which will chair the G20 in 2022, is subject to the same investors’ fickleness as other emerging markets and may suffer from contagion effects if a peer, no matter how distant and different, falls into crisis. An additional risk is that international travellers may stay away from far-flung destinations where medical services are deemed poor.

While the economy is fragile, macroeconomic support is needed

  • The independent central bank should maintain its accommodative stance, geared towards supporting the recovery, while providing forward guidance regarding normalisation of monetary conditions.
  • With so many households and firms suffering from the crisis and the risk of long-lasting scarring effects, it is sensible to maintain fiscal support to the economy. Additional efforts can be made to ensure that resources are directed at those most in need. Tax policy reforms should continue, to fight against evasion and erosion and make the system fairer with more people paying their due.

Structural reforms can contribute to make the recovery stronger, fairer and greener

Firms and households flourish and make forward-looking decisions when governments provide the right conditions to take calculated risks and policies are predictable and consistent.

  • Indonesia is still characterised by a high number of restrictions that benefit selected and well-connected groups. This is true for labour market rules that protect employees and not jobs, as well as for product market regulations that make it difficult for new entrants to challenge incumbents. But where conditions are right, the results are impressive. Establishing a start-up is rather easy and affordable: it is no coincidence that Indonesia can boast five unicorns (i.e. high-tech firms valued USD 1 billion and more) versus three in Australia and four in Japan.
  • The Omnibus Bill on Job Creation, approved in late 2020, includes a large number of changes that will hopefully make it easier for domestic and foreign firms to operate and invest in Indonesia. And it will be fundamental that they do so in full respect of the rules of the game and of international best standards. This translates into respect for labour and environmental rights and determination in upholding business integrity.  The government and parliament should play their part too: the post-pandemic period, for instance, will see many public works adjudicated, and there is no need to prefer direct awards over the transparency of open tenders.

The crisis has not been neutralInformal workers who are not covered by social security, women who are either housewives or both work and take care of the family, people with disabilities, youngsters and migrants – these groups have suffered disproportionally from the crisis. But so did children who missed a good part of the school year, at least in terms of in-person education, and will suffer the consequences for the rest of their life. These developments add to pre-existing challenges in providing relevant and adequate skills to a population that remains young but will soon reach the peak of the demographic dividend.

These issues are covered in the Survey’s in-depth chapter on education and skills. There is no easy answer, but a combination of measures that would help. Early childhood education, for instance, has a lasting effect on educational performance, at the same time as it makes it easier for women to combine work and maternity. Vocational education and training should also be reinforced, removing any stigma it has compared to standard education. And foreign investment in tertiary education, as contemplated by the new economic cooperation agreement with Australia, would improve the quality of Indonesian universities.

Reference:

OECD (2021), OECD Economic Surveys: Indonesia 2021, OECD Publishing, Paris – OECD.Kappa 


Asia & Pacific economies are projected to rebound from COVID-19

by Patrick Lenain and Kosuke Suzuki, OECD Economics Department

While the world is struggling to exit from the coronavirus crisis, the region Asia & Pacific is a notorious exception: many countries in the region have stopped the COVID-19 pandemic after the first wave, and they quickly returned on a path of growth in the second half of 2020 – a rare accomplishment. The OECD projects that the region’s recovery will continue in 2021 and 2022 (Table 1).

The region’s current resilience is in sharp contrast with the late 1990s, when the Asian Financial Crisis hit it very hard (Figure 1). Governments in the region drew lessons from this experience and were better prepared when the Global Financial Crisis arrived. They were also ready when the coronavirus struck: fiscal space was available, monetary policies were sound, exchange rates were flexible, foreign exchange reserves abundant, bank well capitalised, external indebtedness was low – and health systems had been re-organised.

Strong resilience in the face of crises contributes to long-term growth, especially in poor and emerging countries, as shown by a literature launched by Easterly et al. (1993). Thanks in large part to their growing resilience, the 15 countries and territories of Asia & Pacific doubled their share in world GDP from 19% in the early 1990s to 34% currently. The region has become an economic powerhouse and most likely will gain further ground. The Regional Comprehensive Economic Partnership (RCEP) recently signed will provide another boost to long-term growth, as discussed in the recent OECD Economic Survey of Thailand.

Of course, not all countries of the region have the same resilience. To throw light on this disparity, we use a hierarchical cluster analysis (Ward linkage), a statistical procedure that identifies homogenous groups of observations without making a difference between dependant and independent variables. We identify four groups of countries with common factors for each of the three crises. To group the region’s economies, we use the following indicators: 1) the depth of recession, 2) the speed of recovery, and 3) the post-recession scarring of growth. The first two indicators provide a contemporary measure of resilience when faced with a shock, while the third indicator is an ex-post measure of resilience. For the current crisis, we use the number of COVID-19 deaths as a proxy of ex-post resilience, in line with empirical findings that the spread of the coronavirus has damaged economic activity due a combination of government-imposed lockdowns and self-imposed lockdowns (Golsbee and Syverson, 2020).

Our cluster analysis reveals some diversity within the region. The resilience of individual economies has changed rapidly – in both directions (Table 2). Some key findings are:

  • Australia has shown great resilience during the first two crises, but fell into a recession with the coronavirus.
  • While China and India were resilient in the face of the first two crises, they have lost some ground with the COVID-19 pandemic, especially India.
  • Korea and Thailand have seen their resilience improve after each crisis.
  • Vietnam has consistently been the most resilient economy in the region.

Despite this diversity, the region displays overall a strong resilience and is placed to recover rapidly from the COVID-19 crisis, assuming that the pandemic is brought under control and that the large population can be vaccinated soon. If this happens, Asia & Pacific will confirm its new position as a global powerhouse. The return to economic growth should be an opportunity to address socioeconomic problems inherent in several countries, notably high informality and inequality, and make headways on a path of decarbonisation.

References:

Easterly, W., M. Kremer, L. Pritchett, and L. H. Summers (1993), “Good Policy or Good Luck? Country Growth Performance and Temporary Shocks,” Journal of Monetary Economics, 32, pp. 459–483.

Goolsbee A. and C. Syverson (2020), “Fear, Lockdown, and Diversion: Comparing Drivers of Pandemic Economic Decline 2020”, NBER Working Paper No. 27432, June.

OECD (2020), OECD Economic Surveys: Thailand 2020: Economic Assessment, OECD Publishing, Paris, https://doi.org/10.1787/ad2e50fa-en.

OECD (2020), OECD Economic Outlook, Volume 2020 Issue 2: Preliminary version, OECD Publishing, Paris, https://doi.org/10.1787/39a88ab1-en.


Fostering formal sector job creation to further improve living standards in Indonesia

By Christine Lewis, Head of Indonesia Desk, OECD Economics Department

The Indonesian economy has grown solidly in recent years, which together with helpful government policies has raised incomes and brought down poverty rates to record lows, as highlighted in the latest OECD Economic Survey of Indonesia (OECD, 2018). Prudent macroeconomic policies have contributed to economic stability, muted inflation and limited government debt. Even with the more challenging external environment, GDP growth is expected to remain around 5¼ per cent in 2018 and 2019.

Indonesia’s youthful population represents an opportunity to lift future growth and living standards. In contrast with higher-income countries, the working-age population share is rising and will likely continue doing so for another decade (United Nations, 2017). OECD estimates suggest that over the next decade this demographic change alone is expected to boost trend GDP growth by around 0.3% on average (OECD, 2018; Guillemette and Turner, 2018).

Indonesia’s favourable demographics could provide a bigger boost to growth if a larger share of employment consisted of high-quality jobs in the formal sector. Informality is usually associated with insecure jobs with lower pay and fewer training opportunities (OECD, 2015; Allen, 2016). Although the rate of informality has fallen in Indonesia, it remains pervasive. The OECD estimates that around half of all dependent employees and 70% of all workers are informally employed, compared to 35% in Brazil or around 55% in Colombia (Figure 1). Growing the share of formal sector jobs would increase incomes and, by raising government revenues, would allow better services to be provided for future generations.

Indo CLewis informality 1

There are different reasons for informal employment so tackling it requires a multi-pronged approach. Stringent employment regulations, including high dismissal costs and minimum wages, limit firms’ ability and incentive to hire formal employees (Figure 2). The Survey recommends trialling easier employment regulations and a discounted wage for youth in special economic zones and extending these reforms if they are successful. Continuing to simplify business regulations and to improve the new online submission system for licensing would help reduce barriers to businesses operating formally.

Indo CLewis informality 2-2018

Low skill levels combined with a relatively high minimum wage also limit the growth of formal sector employment. Only half of all Indonesians aged 25-35 have completed upper secondary school. The OECD PISA test results show that many 15 year-olds still lack basic skills in maths and reading. Improving the quality of education can be difficult but it is crucial for improving the prospects of future generations. Reforms should focus on improving teacher quality in schools and better linking vocational education with employers to ensure students graduate with the skills they need to find good jobs and continue developing over their career.

References

Allen, E. (2016), “Analysis of trends and challenges in the Indonesian labor market”, ADB Papers on Indonesia, No. 16, Asian Development Bank, Manila.

Guillemette, Y. and D. Turner (2018), “The long view: scenarios for the world economy to 2060”, OECD Economic Policy Papers, No. 22, OECD Publishing, Paris, http://dx.doi.org/10.1787/b4f4e03e-en.

OECD (2018), OECD Economic Surveys: Indonesia, OECD Publishing, Paris, https://doi.org/10.1787/eco_surveys-idn-2018-en.

OECD (2015), “Enhancing job quality in emerging economies”, in OECD Employment Outlook 2015, OECD Publishing, Paris, http://dx.doi.org/10.1787/empl_outlook-201h5-9-en.

United Nations (2017), World Population Prospects: The 2017 Revision, DVD Edition;


How best to keep up rapid tourism growth in Indonesia

by Patrice Ollivaud, Economist, Indonesia Desk, OECD Economics Department

Bali, where the 2018 OECD Economic Survey of Indonesia is being released, is emblematic of Indonesia’s success in creating a popular tourism brand. The number of foreign tourists arriving in Bali soared from 2.5 million in 2010 to 5.7 million in 2017. In 2014, the authorities committed to replicate this success in “10 new Balis” with the aim of doubling tourist numbers to 20 million by 2019. To reach that target, the government accelerated transport infrastructure development and stepped up its promotion efforts. In 2017, tourist arrivals reached 14 million and other destinations are becoming popular, such as Borobudur.

tourism bali

However, success in numbers also poses challenges. Environmental infrastructure such as water and waste treatment remains insufficient in most of Indonesia. Growing numbers of foreign tourists are widening the infrastructure gap because their consumption is higher than that of a typical Indonesian. To wit, the increased use of plastic bottles, since tap water is typically not potable. Improperly disposed waste from land largely contributes to Indonesia’s position as the second-largest contributor to plastic marine pollution in the world. Indonesia has also the most plastic-ridden coral reefs in the Asia-Pacific (Lamb et al., 2018). In Bali, the ocean carries waste onto beaches that need to be regularly cleaned.

Addressing infrastructure gaps would allow more sustainable development of tourism, and development of tourism to be sustained. Better planning, especially at the destination level, can help accommodate tourist inflows (OECD, 2018). Focusing more on attracting high-spending visitors could also limit the burden without reducing the economic benefits. The involvement of local government and stakeholders is crucial so that plans address local needs and have the population’s acceptance.

Preserving the environment and developing tourism can be mutually reinforcing. Visitors are attracted by the richness of Indonesia’s environmental assets. Preservation of those assets is essential for sustaining Indonesia’s brand and attracting tourists. For example, forests need protection as deforestation is destroying more than just trees and wildlife but also the economic returns from properly using them for tourism. Protecting more areas would contribute to preserving those assets (OECD, 2018). More of those areas could also be opened to the tourism industry, when it is environmentally viable. Imposing fees will help control the number of visitors and contribute to the cost of maintenance.

References

Lamb, J. et al. (2018), “Plastic waste associated with disease on coral reefs”, Science, Vol. 359/6374, pp. 460-462.

OECD (2018), OECD Economic Surveys: Indonesia 2018, OECD Publishing, Paris.


The business climate has improved in Indonesia, but this is no time for complacency

by Patrice Ollivaud and Petar Vujanovic, OECD Economics Department

The government has put a heavy emphasis on improving the business climate, thereby promoting a competitive, innovative and dynamic private business sector. Traditionally Indonesia has relied heavily on commodities, but the recent focus of policy has been on facilitating economic development and structural change by diversifying the economy, supporting the development of the manufacturing sector and promoting downstream local value added.

Global competitiveness rankings illustrate the challenges faced by Indonesia. In terms of competitiveness, according to the World Economic Forum, Indonesia’s overall ranking in 2016 slipped to 41st and would be even lower (52nd) if market size is excluded from the calculation (Figure 1). As pointed out in the 2016 OECD Economic Survey of Indonesia, poor infrastructure is one factor holding back structural transformation. The government has recently committed a large amount of funding to fill some of the gaps. However a lot remains to be done, for instance regarding labour market regulation and health and education outcomes.

The authorities have released 13 reform packages since September 2015, focusing notably on deregulating and improving the business environment. And the President has set a target of boosting Indonesia to at least 40th place among 189 economies in the World Bank’s Doing Business rankings. Indonesia has recently made good progress in that exercise, moving from 120th to 91st between 2015 and 2017 (World Bank, 2016). The bulk of this improvement came from changes to corporate tax rules. For example, the average number of annual tax payments a firm is required to make fell from 65 in 2015 to 43 in 2017, but it remains well above Singapore (6), Malaysia (9) and Thailand (21) and Indonesia still ranks 160th in this subcategory. In its 12th reform package the government stated its intention to reduce the number of tax payments per year to just 10.

As noted in the Survey, a significant part of the problem resides at the sub-national level, and indeed, in July 2016 3 000 sub-national government regulations that were inconsistent with national legislation were scrapped. If Indonesia is to make more progress in improving its business climate, sub-national governments need to streamline and harmonise their bureaucracy. There is enormous regional variation in these regulations, with some matching international best practice. The lagging regions should be encouraged to emulate the leaders.

The Survey makes recommendations to make further gains:

  • Reduce transaction taxes (including stamp duties, licensing fees and business registration) and the tax on the acquisition of land and buildings by imposing ceilings or replacing them with fixed fees;
  • Improve coordination and information sharing among government agencies, so that businesses are not obliged to notify each agency of having completed administrative tasks in another;
  • Step up monitoring of the implementation of national regulations across the country;
  • Speed up procedures at the land registry office; and
  • Make the business registry electronic.

indonesia-global-comp

References

OECD (2016), OECD Economic Surveys: Indonesia 2016, OECD Publishing, Paris, DOI: http://dx.doi.org/10.1787/eco_surveys-idn-2016-en.

World Bank (2016), Doing Business 2017: Equal Opportunity for All, Washington DC: World Bank, DOI: 10.1596/978-1-4648-0948-4.


Funding priority spending will become increasingly challenging in Indonesia

By Patrice Ollivaud and Petar Vujanovic, Indonesia Desk, OECD Economics Department

As described in the 2016 OECD Economic Survey of Indonesia, economic growth is expected to pick up over the course of 2016 and into 2017. Despite persistently weak external conditions, confidence is returning, with inflation moderating, a stable rupiah and government investment in infrastructure gathering pace. Thanks to the stabilisation of the economy, BI has cut interest rates six times since January 2016, each time by 25 basis points. As recommended in the Survey, if growth disappoints, the authorities should continue to employ a prudent monetary policy to stabilise output without endangering financial stability.

indonesia-2016-ollivaud

Seizing the opportunity resulting from lower oil prices, the government substantially reduced fuel subsidies from about 19% of public expenditure in 2014 to 7% in 2015. The funds were mostly reallocated towards ambitious programmes to alleviate infrastructure gaps and poverty. However, the poverty rate is still relatively high compared to peer countries at a similar level of development. Moreover, a lack of infrastructure, especially in transportation (including maritime), logistics, water treatment and energy supply, is hampering Indonesia’s economic, business and social development.

The recent boost to confidence could be undermined if the government fails to deliver on its promises, notably in terms of infrastructure investment. With lacklustre revenues notably due to low tax compliance, the government’s programme is at risk. For several years, the fiscal deficit has been close to the 3% legal cap (Figure 2). In June and then in August, expenditure cuts (first by 1% and then 6.5% of government expenditure) were announced in the wake of lower revenues and a larger projected deficit. A tax amnesty was launched in July to boost tax collection. With the OECD’s Automatic Exchange of Information regime due to come into force over the next two years, the timing of the amnesty is good, as it provides taxpayers with an early opportunity to regularise past non-compliance. As of 30 September, over 400 000 Indonesians had declared about 3 500 trillion rupiah (USD 280 billion) in assets, generating about 90 trillion rupiah (USD 7 billion) in additional government revenues.

indonesia-2016-ollivaud2

In addition, improving the efficiency of public spending would allow getting the most out of existing resources. To that end, the Survey highlights in particular the need to boost the capacity and skills of civil servants, particularly in some sub-national governments. The “big-bang” decentralisation has proven to be popular and successfully brought government closer to the people. In order to complete it, more tax autonomy at the regional level would help to improve both tax collection and accountability.

References

OECD (2016), OECD Economic Surveys: Indonesia 2016, OECD Publishing, Paris.