Beyond the Strait: What Daily Inflation Indicators Reveal About Commodity Price Pass-Through

The escalation of conflict in the Middle East caused a spike in commodity prices that quickly fed into higher global inflation. A recent moderation in commodity prices has caused some subsequent easing in consumer price inflation in many economies. These dynamics are well captured by high-frequency daily price indicators using web-scraping software.

By Patrice Ollivaud and Ben Westmore, OECD Economics Department


The June OECD Economic Outlook highlighted that disruptions to shipments through the Strait of Hormuz, along with damage to energy and other infrastructure, crimped the global supply of key commodities. Prices of the affected commodities – both energy and non-energy – ratcheted upwards in response. Gas prices in Asia were 64% higher on average in May than in February 2026. Brent oil prices rose by 50% over the same period. The price of various other commodities also rose, with sulphur, urea and phosphate prices increasing by 67%, 33% and 20% respectively. The rise in commodity prices has since partially unwound following the memorandum of understanding between the United States and Iran to end the war in the Middle East.

The war-induced increase in commodity prices was transmitted to consumer price inflation around the world, evident in monthly official consumer price indexes. A key question is whether complementary higher-frequency indicators can give a more timely read on how both the steep increase and recent unwinding of global commodity prices translate into movements in consumer price inflation.

One such measure is the daily price index developed by Cavallo and Rigobon (2016) and available for a sizeable number of advanced and emerging-market economies. To construct these measures, web-scraping software is used to collect daily prices across millions of products mostly from major retailers with a physical as well as online presence. Price changes are then aggregated across items using official CPI weights in each country.  The daily price indexes may provide an early signal before official CPI releases, allow policymakers to distinguish temporary shocks from more persistent inflation, and help assess in close to real-time the extent to which commodity shocks are being transmitted through supply chains to other consumption items.

Aggregating across 27 countries that account for around two thirds of world GDP, the daily price index shows a steep and persistent rise in consumer prices between 27 February and early May 2026, with a similar trajectory to that observed in the early period of the inflation spike in 2022 following Russia’s invasion of Ukraine (Figure 1). This pattern was broadly based across both advanced and emerging-market economies, with the percentage change in the daily price index over March and April significantly higher than the average during the same period across 2010-25.

Based on the monthly weighted average of the daily price indexes, year-on-year global inflation increased from 3.5% in February to 5.0% in April, with the advanced economy aggregate rising from 3.1% to 4.6% and the emerging-market economy aggregate rising from 4.7% to 6.0%. Nonetheless, with a subsequent stabilisation and then moderation of global commodity prices, daily consumer inflation plateaued in May and fell slightly in June, contrasting with the 2022 episode when consumer price inflation continued to move higher.

The increase in inflation in the daily measure from late February largely stemmed from the direct impact of rising fuel prices (Figure 2, Panel A). Globally, the fuel price spike from the daily measure through March and April was even more pronounced than in 2022. However, since late May, daily fuel price inflation has fallen notably. In contrast, there were no signs of increased food inflation following the escalation of conflict, despite the indirect impact of higher energy and fertiliser costs on agricultural producers. Global daily food price increases so far this year have even been slightly more moderate than the average increase over the 2010-25 period (Figure 2, Panel B).

Do the daily consumer price indicators track fluctuations in official measures of consumer price inflation?

The daily price measures miss some of the price movements of consumer items not typically observed online, such as certain services like education and most spending on healthcare. Nonetheless, observed correlations between year-on-year percentage changes in the daily price measure and official measures of headline consumer price inflation are generally high. For those countries with at least 10 years of daily price measure history, the correlation coefficient ranges from +0.54 in Germany to +0.98 in Turkey (Figure 3, Panel A). The reasons for different correlation coefficients across countries warrants further investigation, but it is generally not those countries with a high share of online purchases in total retail sales that display the highest correlation. Granger causality tests across the countries with at least 10 years of daily price data suggest that the daily price indexes can provide an early signal of future official consumer price inflation developments.

Monthly averages of the daily price data highlight the increase in consumer price inflation in many countries between February and May 2026 (Figure 3, Panel B). Based on this measure, inflation increased by 0.9 percentage points in the median economy. The increase was even larger for several of the major economies, including the United States (2.3 percentage points), Italy (2.5 percentage points) and South Africa (3.5 percentage points).

Inflation moderated in June based on the daily price indexes, reflecting the easing in global commodity prices. In several European countries, including Sweden, France, Germany and the Netherlands, year-on-year inflation in June was back below the average rate observed in February 2026 (based on monthly averages of the daily price index; Figure 3, Panel B). The extent to which inflation moderates further partly depends on the durability of the recent memorandum of understanding between the United States and Iran. Given the still-uncertain geopolitical landscape and above target inflation in many economies, monitoring the daily price indexes can be a useful complement to official monthly and quarterly inflation measures. In particular, the daily price data can be a useful real-time tool for policymakers to assess the degree that commodity shocks are feeding through to consumer prices and whether those pressures are proving temporary or persistent.

Figure 3.  A moderation in daily price inflation suggests weaker official inflation for June in many economies

References

Cavallo, A., and R. Rigobon (2016), “The Billion Prices Project: using online prices for measurement and research”, Journal of Economic Perspectives, Vol. 30, No. 2.

OECD (2026), OECD Economic Outlook, Volume 2026 Issue 1: Under Pressure, OECD Publishing, Paris, https://doi.org/10.1787/2d1956f0-en.


The fine print that follows you out the door: non-compete clauses are spreading and holding back growth 

The prevalence of non-compete clauses is surprisingly high, with adverse consequences for economic dynamism, wages and productivity. This brings into closer focus recent attempts to restrict the use of such clauses in some OECD countries.

By Dan Andrews, Andrea Garnero and Sara Holttinen


Somewhere in the contract you signed on your first day, there may be a clause that outlives the job itself. A non-compete clause bars you from joining — or starting– a competing business for a period after you leave. These clauses were meant for a narrow purpose: to stop a departing executive or engineer from walking valuable trade secrets straight to a rival. New evidence from the OECD suggests they have quietly become something much broader, and far more common, than that original justification can bear.

Drawing on new employee and employer surveys developed by the OECD and Bocconi University and fielded by Ipsos across 15 OECD countries — covering more than 30 000 workers and 6 000 companies in all — the latest OECD Employment Outlook offers the first harmonised, cross-country picture of how these clauses are used. The findings are striking.

Not just for the boardroom

Between one-fifth and one-third of private-sector workers across these countries report being bound by a non-compete clause, ranging from around 11‑15% in Poland and 7‑18% in Italy, to close to 30% in Canada and between 29% and 41% in Sweden (Figure 1). (Non-disclosure agreements, a lighter-touch alternative, cover around one-half.) That would be unremarkable if the clauses stayed where they started — among managers, specialists and staff with access to sensitive commercial information.

But the reality is that non-compete clauses now reach well down the wage and skills ladder. Sizeable shares of workers with no more than a lower-secondary education, workers in the bottom tenth of the earnings distribution, and workers on fixed-term contracts report being covered. So do many people who say they have no access to any confidential information at all. They are also more common among young workers — consistent with a practice that has been spreading over time. Rather than being carefully negotiated, the clauses are often applied indiscriminately, dropped into standard contracts as boilerplate.

Broad, uncompensated — and often unenforceable

The clauses are frequently wider than national law would comfortably allow. Many run longer than a year, extend across an entire country or beyond, or reach past the employer’s own line of business. And although compensation is one of the things courts weigh when deciding whether a restriction is reasonable, close to one-half of covered workers report receiving nothing at all in return.

The upshot is that a substantial share of non-compete clauses would probably not survive a court challenge. But here lies the twist: they don’t need to. Most workers never test them. The mere presence of a clause — and the belief that it might be enforced — is often enough to keep people from moving. The clauses exert a chilling effect: they bite through perception as much as through law, which is why even tightly regulated countries do not escape their effects.

Why it matters for the economy

This is where individual contract terms add up to something macroeconomic. When workers stay put out of caution, labour moves less freely to where it is most productive, and the knowledge that travels with people spreads more slowly between firms. Both channels matter for growth at a time when many OECD economies are wrestling with a long productivity slowdown and weak wage growth.

The survey evidence points in a consistent direction. Non-compete coverage is associated with lower job mobility (5% of private-sector employees have been prevented from changing jobs and 3% from starting a business because of a non-compete clause) and slower wage growth, particularly for less-educated workers. It is also associated with weaker productivity: a higher prevalence of non-compete clauses at the industry level is associated with lower productivity, with a 10 percentage-point increase linked to a 1.9% decline in productivity, with the drag somewhat smaller — but still present — where regulation is tighter. These links are suggestive rather than proof of cause and effect, since firms and workers who use such clauses differ in ways that are hard to observe fully. But they align with a growing body of experimental and quasi-experimental research reaching similar conclusions.

What policymakers can do

Some jurisdictions have opted for outright bans — several US states among them — while a proposed federal ban in the United States was ultimately abandoned in the courts. Most OECD countries have taken a more tailored route: barring the clauses below an earnings threshold, exempting particular occupations, requiring employers to pay compensation, capping duration, or mandating advance disclosure so that a restriction reflects genuine agreement rather than default fine print.

Yet regulation on paper is only part of the answer. Because these clauses work through what people believe, transparency and enforcement matter just as much. Clear statements of what the law actually requires, plain-language contracts, accessible public advice, and credible sanctions for overly broad clauses can all help — and today such sanctions remain rare. Competition authorities have a complementary role in pursuing the no-poaching and wage-fixing agreements between employers that suppress mobility from another direction.

Non-compete clauses were built to protect legitimate business interests. The evidence suggests that, as currently used, many do little of that — while quietly weighing on the mobility, wage growth and dynamism that healthy labour markets and well-functioning economies depend on. Getting the fine print right is not a small matter.

For further information see the dedicated web page: Non-compete and related agreements: Hoarding talent, holding back growth?

This post draws on the chapter “Non-compete and related agreements: Hoarding talent, holding back growth?” in the OECD Employment Outlook 2026.


References:

OECD (2026), OECD Employment Outlook 2026: Geographic Disparities in Jobs and Incomes, OECD Publishing, Paris, https://doi.org/10.1787/7e710f54-en.


From classroom to career: Strengthening youth engagement in Italy 

Italy’s ageing population is shrinking the workforce, yet many young people still struggle to enter stable employment. Helping young people succeed at school and work is now essential for the country’s long-term growth.

by Emilia Soldani and Tim Bulman, OECD Economics Department

Versione italiana


This June, around half a million youth will complete their final year of mandatory schooling in Italy. Based on recent patterns, only around two-thirds will obtain a high school diploma and less than half of them will go to university. As the number of young people declines, Italy needs to make the most of its youth, better integrating them into the economy and society.

Population ageing in Italy is expected to reduce the number of working age individuals by over one-third by 2060. Although young people are becoming an increasingly scarce resource in Italy (Figure 1), the 2026 OECD Economic Survey of Italy identifies their potential to contribute more to the economy, along with other groups that are underrepresented in the labour market, such as women.

Many young people struggle to transition from school into the workforce, and nearly one in five are out of work, education or training (NEET), while many others emigrate in search of better working conditions (the so-called “brain drain”).

Italy’s future growth depends on making better use of the available talent. The 2026 OECD Economic Survey of Italy highlights two main pillars for action: improving the education system and making the labour market work better for young people. Helping young people succeed at school and work will be essential for the country’s long-term growth and wellbeing.

Equipping young people with the skills to succeed

School and university reforms should aim at better engaging students, reducing drop-out rates and balancing general education with work-relevant skills.

There has been progress. Over the decade to 2024, the school drop-out rate decreased from 15% to 9% and the NEET rate in the age group 15-29 fell from 27% to around 16%, while the share of 25- to 34 year-olds with a university degree rose from 24% to 32% (Figure 2).

However, school-to-work transitions remain difficult and many students leave the education system with weak competencies. In the latest OECD PIAAC survey of adult skills, for instance, individuals aged 16- to 24-years of age generally performed worse than their peers across the OECD, especially in adaptive problem-solving tasks. 

Students’ performance can be improved by investing in the quality of education, for instance by better linking teachers’ salaries, which are currently well below those of most other tertiary educated workers, and their careers prospects to performance.

Dropping out of school early is often a signal of vulnerability and can become the first step into social and economic marginalisation. Early identification of young people at risk of dropout and marginalisation can ensure they can receive appropriate support: formal integrated systems that monitor attendance, achievement and behaviour can help in this regard. At the same time, expanding summer activities in schools can strengthen students’ engagement in the community and their sense of belonging.

Strengthening the role of practical experience and learning by doing can improve students’ engagement in school and help them choose across different career opportunities or fields of further studies. At the same time, it can support the development of transferrable soft skills like teamwork, time and conflict management, and problem solving, ultimately improving their entry into the labour market. To ensure students pursue such opportunities, Italy made Italy curricular internships mandatory in 2015 for all students in grades 11 to 13.

Change takes time and the benefits of education reform can only be expected to emerge in several years. In 2022, the latest PISA survey found over four-in-five 15-year-old-students had never participated in an internship, well above the OECD average (Figure 3). Further expanding the duration of curricular internships and strengthening their quality will aid the transition from school to employment as students gain technical knowledge, practical skills and a greater awareness of their career possibilities and preferences.

Reforms to strengthen vocational education and training, including the expansion of the network of ITS technical tertiary schools, and to increase university-industry collaborations would help young Italians leave the education system endowed with the skills and abilities that employers seek, helping to build more secure careers and supporting the country’s economic future.

Despite progress, participation in technical and vocational pathways remains below most other EU and OECD economies, including due to the perceived gap in quality between general education and vocational pathways and the limited offer of vocational tertiary education courses. Furthermore, geographical inequalities pile up: many of the same areas where average educational outcomes are lower and job opportunities scarcer have fewer places in ITS academies.

Giving young people a chance in the labour market

In the decade to 2023, over 6% of young people aged between 18 and 34 left the country in search of better opportunities abroad, amounting to the loss of 400 000 young people. Many of these are high skilled and appear unlikely to return to work in Italy. This “brain drain” weakens Italy’s long-term growth potential, aggravates skill shortages, and reduces the return on public investment in education.  Multiple factors contribute to the brain drain, including wages, career prospect and labour market duality.

Wages for young people are often lower than those available in other economies and rise more slowly with experience than elsewhere. A symptom of this is the share of young workers at risk of poverty, which is higher than in most other EU countries. Labour market reforms can help attract and retain young workers through better pay and working conditions.

While reducing the incidence of income taxes and social contributions on low wage earners would help improve their living standards subject to fiscal space, reviving slow productivity growth remains the main challenge to supporting wage growth for all workers.   

Training and job-to-job mobility can lead to wage increases, yet few workers in Italy have access to career guidance services or to training, especially in smaller firms with weaker managerial practices. Strengthening managerial training and improving access to subsidised adult training for lower educated workers and for those in SMEs would support workers’ ability to advance their career. These efforts can be supported by the ongoing strengthening of the network of public employment services, which can help the unemployed as well as the employed secure better paid jobs.

The Italian labour market is characterised by stark dualism: older workers tend to hold secure permanent contracts, while younger workers and those who do not have citizenship more often have precarious and lower-paid jobs. This divide can delay financial independence, family formation and long-term career development. At the same time, unstable employment creates a cycle of insecurity that becomes difficult to escape and can erode workforce skills, both through movements out of the labour force or out of the country and through obsolescence for those who remain.

Stable employment relationships not only improve workers’ conditions but also encourage firms to invest in training, including in areas like digital and managerial skills, ultimately promoting productivity growth and helping Italian firms remain competitive. 

High uncertainty about the costs of severing permanent job contracts often induce employers to prefer temporary contracts, which are easier, quicker and much cheaper to dissolve and offer lower protection and fewer training opportunities to workers. Reducing the uncertainty of worker dismissal costs could help transform some of the temporary job contracts into permanent hires.

Engaging youth to support the labour market

Italy’s ageing population makes engaging youth in the economy more urgent than ever. For the students completing their education in the coming years, improving the schools, university and training systems will help secure a better future and contribute to economic prosperity.  Chapter 2 of the 2026 OECD Economic Survey of Italy describes how better school-to-work pathways, stronger vocational education and more stable labour market conditions could unlock significant economic and social benefits and help reduce the economic burden associated with population ageing.


References

OECD (2026), OECD Economic Surveys: Italy 2026, OECD Publishing, Paris, https://doi.org/10.1787/539538b2-en.


Dai banchi di scuola al lavoro: come rafforzare il coinvolgimento dei giovani in Italia

L’invecchiamento demografico riduce la forza lavoro, eppure molti giovani continuano a incontrare difficoltà nell’accedere a un’occupazione stabile. Aiutarli ad avere successo nel percorso scolastico e nel mondo del lavoro è oggi fondamentale per la crescita di lungo periodo del Paese.

di Emilia Soldani and Tim Bulman, OECD Economics Department

English version


In questi giorni, circa mezzo milione di giovani sta completando l’ultimo anno dell’istruzione obbligatoria in Italia. Sulla base delle tendenze recenti, di questi solo due terzi circa otterranno un diploma di scuola superiore, e meno della metà proseguirà all’università. Con l’invecchiamento demografico che pesa sul numero di giovani, per l’Italia valorizzare al meglio i propri giovani, integrandoli più efficacemente nell’economia e nella società, è quanto mai urgente.

Entro il 2026 l’invecchiamento della popolazione potrebbe ridurre di oltre un terzo il numero di persone in età lavorativa. Sebbene i giovani stiano diventando una risorsa sempre più scarsa in Italia (Figura 1), lo Studio economico dell’OCSE sull’Italia, pubblicato ad Aprile 2026, evidenzia come potrebbero contribuire all’economia, insieme ad altri gruppi sottorappresentati nel mercato del lavoro, come le donne.

Molti giovani faticano a passare dalla scuola al mondo del lavoro e quasi uno su cinque non lavora, né studia né è inserito in percorsi di formazione (NEET), mentre molti altri emigrano alla ricerca di migliori condizioni lavorative (la cosiddetta “fuga dei cervelli”).

La crescita futura dell’Italia dipende dalla sua capacità di utilizzare meglio il talento disponibile. L’Indagine economica dell’OCSE sull’Italia 2026 individua due principali pilastri d’azione: migliorare il sistema educativo e rendere il mercato del lavoro più favorevole ai giovani. Aiutare i giovani ad avere successo nello studio e nel lavoro sarà fondamentale per la crescita e il benessere a lungo termine del Paese.

Dotare i giovani delle competenze necessarie per il loro successo

Le riforme della scuola e dell’università dovrebbero mirare a coinvolgere maggiormente gli studenti, ridurre i tassi di abbandono e bilanciare l’istruzione generale con competenze rilevanti per il lavoro.

Ci sono stati significativi passi in avanti. Nei dieci anni tra il 2014 e il 2024, il tasso di abbandono scolastico è diminuito dal 15% al 9% e il tasso di NEET nella fascia d’età 15-29 anni è sceso dal 27% a circa il 16%, mentre la quota di giovani tra i 25 e i 34 anni con una laurea è aumentata dal 24% al 32% (Figura 2).

Tuttavia, il passaggio dalla scuola al mondo del lavoro rimane difficile e molti studenti escono dal sistema educativo con competenze deboli. Nell’ultima indagine OCSE PIAAC sulle competenze degli adulti, ad esempio, i giovani tra i 16 e i 24 anni hanno generalmente ottenuto risultati inferiori rispetto ai loro coetanei in altri Paesi, in particolare nei compiti di problem solving adattivo.

Le prestazioni degli studenti possono essere migliorate investendo nella qualità dell’istruzione, ad esempio collegando meglio gli stipendi degli insegnanti — attualmente ben inferiori a quelli della maggior parte degli altri lavoratori in possesso di un titolo di studio universitario — e le loro prospettive di carriera ai risultati ottenuti.

L’abbandono scolastico precoce è spesso un segnale di vulnerabilità e può rappresentare il primo passo verso la marginalizzazione sociale ed economica. L’identificazione precoce dei giovani a rischio di abbandono e marginalizzazione può garantire un supporto adeguato: sistemi formali integrati che monitorano la frequenza, i risultati e il comportamento possono essere utili a questo scopo. Allo stesso tempo, ampliare le attività estive nelle scuole può rafforzare il coinvolgimento degli studenti nella comunità e il loro senso di appartenenza.

Rafforzare il ruolo dell’esperienza pratica e del learning-by-doing può migliorare il coinvolgimento degli studenti a scuola e aiutarli a scegliere tra diverse opportunità di carriera o ambiti di studio successivi. Allo stesso tempo, può favorire lo sviluppo di competenze trasversali trasferibili come il lavoro di squadra, la gestione del tempo e dei conflitti e la risoluzione dei problemi, migliorando in ultima analisi il loro ingresso nel mercato del lavoro. Per garantire che gli studenti intraprendano tali opportunità, l’Italia ha reso obbligatori i tirocini curricolari nel 2015 per tutti gli studenti degli ultimi tre anni della scuola secondaria superiore.

Il cambiamento spesso richiede tempo e possono volerci anni perche`i benefici delle riforme educative diventino visibili. Nel 2022, l’ultima indagine PISA ha rilevato che oltre quattro studenti quindicenni su cinque non avevano mai partecipato a un tirocinio, un valore ben superiore alla media OCSE (Figura 3). Un ulteriore ampliamento della durata dei tirocini curricolari e il rafforzamento della loro qualità faciliteranno la transizione dalla scuola al lavoro, consentendo agli studenti di acquisire conoscenze tecniche, competenze pratiche e una maggiore consapevolezza delle proprie opportunità e scelte professionali.

Le riforme volte a rafforzare l’istruzione e la formazione professionale, compresa l’espansione della rete degli Istituti Tecnici Superiori (ITS) di livello terziario, e ad aumentare le collaborazioni tra università e industria aiuterebbero i giovani italiani a uscire dal sistema educativo dotati delle competenze e capacità richieste dai datori di lavoro, contribuendo a costruire carriere più solide e a sostenere il futuro economico del Paese.

Nonostante i progressi, la partecipazione ai percorsi tecnici e professionali rimane inferiore rispetto alla maggior parte delle economie dell’UE e dell’OCSE, anche a causa della percezione di un divario qualitativo tra l’istruzione generale e i percorsi professionali e della limitata offerta di corsi terziari professionalizzanti. Inoltre, si aggiungono disuguaglianze territoriali: molte delle aree in cui i risultati educativi medi sono più bassi e le opportunità di lavoro più scarse dispongono anche di un numero inferiore di posti negli ITS.

Offrire ai giovani un’opportunità nel mercato del lavoro

Nel decennio tra il 2013 ed il 2023, oltre il 6% dei giovani tra i 18 e i 34 anni ha lasciato il Paese alla ricerca di migliori opportunità all’estero, una perdita di circa 400.000 giovani. Molti di loro, altamente qualificati, appaiono poco inclini a tornare a lavorare in Italia. Questo fenomeno di “fuga dei cervelli” indebolisce il potenziale di crescita economica, aggrava la carenza di competenze e riduce il rendimento degli investimenti pubblici nell’istruzione. Diversi fattori contribuiscono a questo fenomeno, tra cui i salari, le prospettive di carriera e la dualità del mercato del lavoro.

Rispetto ad altri Paesi, i salari dei giovani sono spesso inferiori e crescono più lentamente con l’esperienza. Un segnale di ciò è rappresentato dalla quota di giovani lavoratori a rischio di povertà, più elevata rispetto alla maggior parte degli altri Paesi dell’UE. Le riforme del mercato del lavoro possono contribuire ad attrarre e trattenere i giovani lavoratori attraverso migliori retribuzioni e condizioni di lavoro.

Ridurre l’incidenza delle imposte sul reddito e dei contributi sociali sui lavoratori a basso reddito contribuirebbe a migliorare i loro standard di vita, compatibilmente con gli spazi fiscali disponibili; tuttavia, il principale ostacolo alla crescita dei salari per tutti i lavoratori resta la bassa crescita della produttività (Bulman & Soldani, 2026).

La formazione e la mobilità occupazionale possono portare a un aumento dei salari, ma pochi lavoratori in Italia hanno accesso a servizi di orientamento professionale o a percorsi formativi, soprattutto nelle imprese più piccole e in quelle con pratiche manageriali meno sviluppate. Rafforzare la formazione manageriale e migliorare l’accesso ai corsi di formazione sovvenzionati, in particolare per i lavoratori meno qualificati e per quelli impiegati nelle piccole e medie imprese, migliorebbe le prospettive di carriera. Questi sforzi possono essere coadiuvati dal processo, tuttora in corso, di rafforzamento della rete dei servizi pubblici per l’impiego, che può aiutare disoccupati e lavoratori ad ottenere lavori meglio retribuiti.

Il mercato del lavoro italiano è caratterizzato da una forte dualità: i lavoratori più anziani tendono ad avere contratti permanenti e sicuri, mentre i giovani e le persone prive di cittadinanza più frequentemente hanno lavori precari e peggio retribuiti. Questa duialità può ostacolare l’indipendenza finanziaria, la formazione di una famiglia e lo sviluppo di carriere stabili. Allo stesso tempo, l’occupazione instabile crea un circolo vizioso di insicurezza difficile da spezzare e può erodere le competenze della forza lavoro, sia attraverso l’uscita dal mercato del lavoro o dal Paese, sia attraverso l’obsolescenza delle competenze per chi vi rimane.

Relazioni di lavoro più stabili non solo migliorano le condizioni dei lavoratori, ma incentivano anche le imprese a investire nella formazione, anche in ambiti come le competenze digitali e manageriali, promuovendo in ultima analisi la crescita della produttività e aiutando le imprese italiane a rimanere competitive.

L’incertezza sugli effettivi costi di licenziamento nei contratti a tempo indeterminato induce spesso i datori di lavoro a preferire contratti temporanei, che sono più facili, rapidi ed economici da interrompere ma offrono minori tutele e opportunità di formazione ai lavoratori. Ridurre questa incertezza potrebbe contribuire a trasformare una parte dei contratti temporanei in assunzioni a tempo indeterminato.

Coinvolgere i giovani per sostenere il mercato del lavoro

L’invecchiamento della popolazione italiana rende il coinvolgimento dei giovani nell’economia più urgente che mai. Per gli studenti che completeranno il loro percorso di istruzione nei prossimi anni, migliorare i sistemi scolastici, universitari e di formazione contribuirà ad assicurare un futuro migliore e a sostenere la prosperità economica. Il Capitolo 2 dello Studio economico dell’OCSE sull’Italia descrive come percorsi più efficaci di transizione scuola-lavoro, un’istruzione professionale più solida e condizioni del mercato del lavoro più stabili possano generare significativi benefici economici e sociali e contribuire a ridurre l’onere economico legato all’invecchiamento della popolazione.


Fonti

OECD (2026), Studi economici dell’OCSE: Italia 2026, OECD Publishing, Paris, https://doi.org/10.1787/fea691db-it.


Next Phase of Estonia’s Digital Transformation: making the most of Artificial Intelligence

Estonia is entering a new phase of digital transformation, seeking to turn its world-leading digital government and strong ICT sector into broader productivity gains across the economy. Artificial intelligence offers major opportunities, but realising its potential will require wider adoption by businesses, stronger skills, and continued innovation in the public sector.

By Zuzana Smidova, OECD Economics Department


Estonia is widely recognised as a global pioneer in digital government, and the ICT sector accounts for over 9% of value added in the economy, one of the highest shares in the OECD (Figure 1). Early investments in digital infrastructure, interoperable public services and data have created accessible digital public services, and the private ICT investment continues to remain strong.

Building on these strong foundations, the country is now entering a new phase in which the key challenge is to translate digital capabilities into broader productivity gains across the economy. While average productivity growth has been strong over the past two decades, it has decelerated before the pandemic, and more recent developments have been affected by the downturn amid high inflation. At the aggregate level, labour productivity reached around 89% of the EU average in 2021 but fell to 79% in 2025 (OECD, 2026).

Recent OECD research suggests that potential aggregate productivity gains from AI can be significant, adding on average 0.4 to 0.9 percentage points of annual growth in labour productivity (Filippucci, Gal and Schief, 2024).

Estonia’s public sector has embraced advanced digital tools, including Artificial Intelligence (AI). More than 130 AI-related projects have been implemented across public institutions, ranging from automated transcription in courts and Parliament to AI-enabled monitoring of environmental conditions.

The public sector has become an important testbed for AI solutions, helping to demonstrate the potential of these technologies. One example is the Bürokratt, a network of AI-powered virtual chatbots used across the government websites that allows citizens to ask questions, identify relevant public authorities, and explain procedures step-by-step. In the future, it should become a single interface for most of the governmental services.

In education, the AI Leap programme represents one of Estonia’s most ambitious efforts to integrate AI into teaching and learning at scale. Launched in 2025, the initiative aims to equip both students and teachers with the resources needed to build AI literacy and effectively incorporate AI tools into learning processes.

Building on Estonia’s earlier “Tiger Leap” programme in the mid-1990s —which played a key role in establishing basic digital skills and infrastructure in schools—the AI Leap programme focuses on practical integration into teaching and learning. Rather than treating AI as a standalone subject, the programme provides access to AI-based educational tools and supports teachers in embedding these technologies into everyday classroom practice.

Early implementation has already reached a substantial scale, with tens of thousands of upper-secondary students gaining access to AI tools and thousands of teachers receiving training. The programme includes the development an Estonian version of ChatGPT that is designed not to provide direct answers, but to guide students in problem-solving, critical thinking, and independent learning. The programme also places strong emphasis on teacher support and capacity building, recognising that successful adoption depends on educators’ ability to use AI confidently and effectively.

Despite these achievements, challenges remain. AI adoption and digital innovation are still concentrated in specific use cases and sectors, such as ICT, and other knowledge-intensive sectors (Figure 2). Unlocking further gains will require scaling up these efforts and embedding digital technologies more deeply across public administration and the wider economy. Several policy priorities emerge for Estonia’s next phase of digital transformation.

First, strengthening support for enterprise adoption of digital technologies and AI across all sectors is essential. While many firms use digital tools for administrative functions, adoption in production and core operations remains limited. Expanding demonstration programmes and supporting firms in integrating digital tools into business processes can help unlock productivity gains.

Second, strengthening digital and AI skills across the workforce and the public sector is a key priority. While Estonia has strong foundational skills and the AI Leap program demonstrates current focus on the education system, demand for advanced ICT and AI capabilities is growing. Expanding upskilling and reskilling programmes, particularly for the existing workforce, will be essential to support wider adoption.

The experience of Estonia highlights that digital transformation an ongoing process. The country’s strong digital foundations provide a solid basis for leveraging AI as a part of its next phase of digital transformation.

References:

Filippucci, F., P. Gal and M. Schief (2024), Miracle or Myth? Assessing the macroeconomic productivity gains from Artificial Intelligence, OECD Economics Department Working papers, OECD Publishing.

OECD (2026), Economic Surveys: Estonia, 2026, OECD Publishing


Can Korea’s semiconductor super-cycle help build an intergenerational fiscal contract?

Korea’s new semiconductor-fuelled age of plenty provides a window of opportunity to strengthen fiscal institutions and share fiscal burdens fairly between generations.

by Jon Pareliussen, OECD Economics Department


Korea is booming despite the fallout from the evolving conflict in the Middle East, as demand for advanced semiconductors is skyrocketing. Although this demand shock can potentially go on for a long time, it is temporary by nature, as prices and profits will eventually normalise when investment catches up and new production capacity comes online. When this happens, currently surging tax revenues will also fall back to normal levels. The fiscal and labour market consequences of Korea’s rapid ageing are just starting, but will intensify. The OECD Economic Survey of Korea 2026 illustrates the fiscal challenge of ageing and proposes directions to achieve savings and raise revenue. Booming tax revenues linked to the semiconductor super-cycle could be used to underpin an intergenerational contract aligning current tax and spending decisions with long-term fiscal sustainability.

Semiconductor exports drove GDP growth at an annual rate of 7.5% in the first quarter of 2026. Companies producing advanced chips are at the core of a historic stock market rally and workers in each of the two dominant producers secured annual bonuses totalling roughly 1% of Korea’s GDP. The semiconductor super-cycle also raises tax revenues to new highs. So far these revenues have supported increasing spending in annual and supplementary budgets, while negative shocks since the pandemic have largely led to fiscal deficits. This means that when averaged over good times and bad times, Korea is running structural fiscal deficits. With one of the lowest debt-to-GDP ratios in the OECD, Korea is under no immediate pressure to balance the books, but sustained fiscal deficits will add to the already heavy fiscal pressures related to ageing that current young and future generations will need to address.  

In a stylised scenario where spending pressures go completely unabated, fiscal pressures from ageing would add ten percentage points to annual public borrowing by 2060, by which time public debt would be 220% of GDP. Servicing this debt would require that a shrinking labour force consisting of today’s young and currently unborn generations work harder, pay more taxes and receive less in return. This would be unfair and most likely untenable on current trends.

Few economic shocks are so profound, yet so anticipated, as Korea’s ageing. Fertility has dropped from six children per woman in 1960 to well below one every year since 2018, while life expectancy has risen steadily and is now over two years above the OECD average. As a result, the labour force will fall as a share of the total population within the next few years, for the first time in living memory. At the same time, fiscal pressures from pensions, health and long-term care will mount. The OECD Economic Survey of Korea 2026 shows that by starting to address the issues systematically today, a combination of spending prioritisation, further pension reform, an increase in tax revenue and structural reforms to boost employment and productivity can stabilise public debt while growth performance is upheld and the tax burden remains reasonable (Figure 1).

Strengthened fiscal institutions can help successive governments systematically make the fiscal choices today that are compatible with long-term sustainable public finances and a fair burden-sharing between generations. A durable, long-term fiscal framework needs to be founded on expert analyses and anchored across the political spectrum and with key stakeholders. This broad coalition should agree on an intergenerationally fair fiscal trajectory and a mechanism to align annual budgeting with medium term fiscal objectives. An independent fiscal institution with a clear mandate to assess compliance could help build trust and ensure transparency.  

Such a framework needs to provide clear guidance without being overly restrictive. It should allow for countercyclical fiscal policy and provide flexibility for severe crises, for example, by defining compliance over the cyclically-adjusted annual budget balance and building in an escape clause for severe crises. A structured process to adapt the fiscal framework could be envisaged to regularly adjust it to changing circumstances, as is done, for example, in Sweden over an eight-year cycle.

It is potentially easier to agree on sharing of burdens in an age of plenty. Korea’s new intergenerational fiscal contract should therefore be built today while tax revenue is soaring.  The framework can then prove its worth by putting the public finances on a firm footing by the time fiscal constraints really start to bind when demographic headwinds intensify.

Reference

OECD (2026), OECD Economic Surveys: Korea 2026, OECD Publishing, Paris, https://doi.org/10.1787/6b87f585-en.


How large should central bank balance sheets be?

Since the global financial crisis, the size of central bank balance sheets has varied widely, both over time and across countries. Balance sheet size has major implications in many domains, including the operation of the payments system, the transmission of monetary policy and the cost of public debt.

by Masatoshi Ando and Álvaro Pina, OECD Economics Department


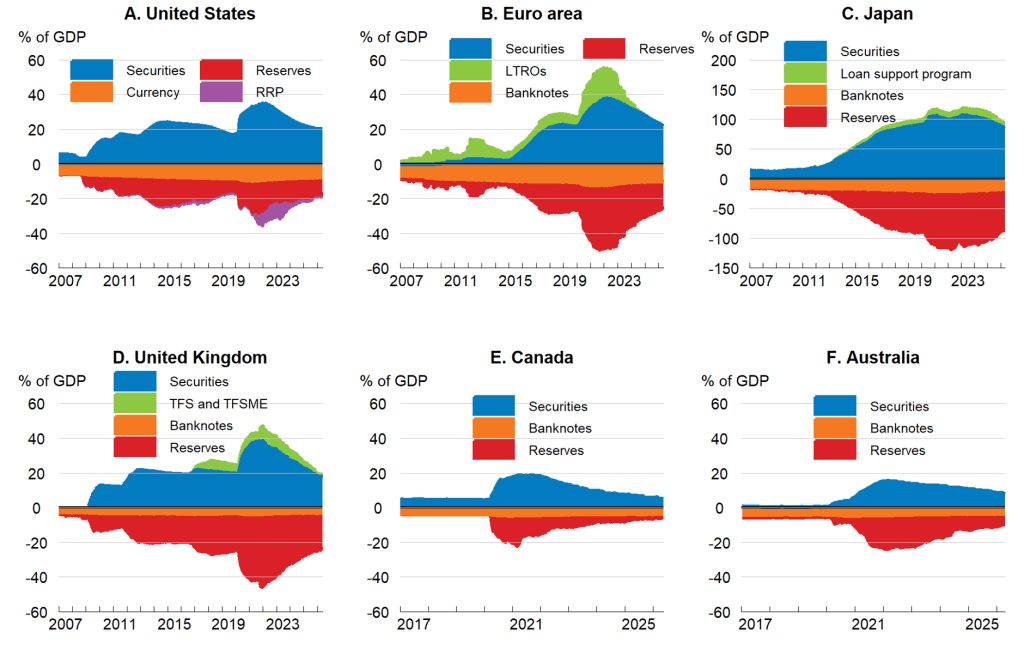
The value of total assets and liabilities of many central banks in advanced economies has varied widely since the global financial crisis (see Figure 1). Following the global financial crisis quantitative easing (QE), with the large-scale purchase of securities (mainly government bonds), led to a significant increase in the size of the balance sheets of the Federal Reserve and the Bank of England from 2009, and of other central banks, such as the European Central Bank (ECB), in subsequent years. During the pandemic, these and other central banks resorted again to QE to address strains in financial markets and provide support to economic activity. At their post-pandemic peaks, balance sheets were (relative to GDP) 3 to 9 times larger than in 2007 and displayed substantial cross-country variation, ranging from 25% of GDP in Canada to around 130% in Japan.

Central banks began quantitative tightening (QT), the downsizing of bond holdings, in 2022-23 (the Federal Reserve had previously done this in 2017-19). In several economies the size of balance sheets relative to GDP has now returned to or is close to pre-pandemic levels. Against this background, some central banks have brought QT to a halt while others are still pursuing it, and a lively debate has emerged about the appropriate size and composition of central bank balance sheets in the longer run (Bailey, 2024; Schnabel, 2025; Logan et al., 2026).

The balance sheet of the central banks which conducted QE is mainly composed of government bonds on the asset side and reserves on the liability side. Thus, as discussed in the latest OECD Economic Outlook (OECD, 2026a), the decision about the appropriate balance sheet size essentially depends on an assessment of the trade-offs that arise as bond holdings and reserves increase or decrease. These trade-offs can evolve over time, depending on the wider economic situation and on financial market conditions.

Figure 1. Quantitative easing and quantitative tightening have been the main drivers of changes in central bank balance sheet size

Bar graphs comparing the percentage of GDP attributed to various financial assets for the United States, Euro area, Japan, United Kingdom, Canada, and Australia from 2007 to 2025.

Note: Only major components of the central bank balance sheets are shown. Assets are displayed as positive and liabilities as negative. For the United States, RRP stands for Reverse Repurchase Agreements. For the euro area, data refer to the actual membership at each point in time, reserves include the amount of deposit facility, and longer-term refinancing operations (LTROs) include targeted longer-term refinancing operations (TLTROs) and pandemic emergency longer-term refinancing operations (PELTROs). For the United Kingdom, securities are proxied by loans from the Bank of England to the Asset Purchase Facility (APF), net of Term Funding Scheme (TFS) drawings.
Source: OECD Economic Outlook 119 database; Bank of Canada; Bank of England; Bank of Japan; Board of Governors of the Federal Reserve System; European Central Bank; Eurostat; Reserve Bank of Australia; Office for National Statistics; and OECD calculations.

Larger or smaller? Trade-offs arise for both bond holdings and reserves

One argument for smaller balance sheets and lower central bank government bond holdings is that this would reduce price distortions in sovereign debt markets, leading to a more efficient allocation of resources. Furthermore, large holdings of government bonds can complicate central bank communication, particularly if they are perceived to constrain monetary policy due to the risk of fiscal dominance. Returning to lower bond holdings also preserves policy space to reintroduce QE as a response to future crises, if needed (Anderson et al., 2026).

However, it is uncertain that central banks can reduce their holdings of government bonds significantly at a time of large budget deficits and substantial debt issuance. Any reduction in central bank holdings requires greater public debt absorption by private sector investors, who tend to be more price‑sensitive and are sometimes highly leveraged. This entails the risk of higher yields and greater volatility in sovereign bond markets at times of stress (Ando et al., 2026; OECD, 2026b). In the event of serious bond market volatility, central banks could need to temporarily resume or enhance securities purchases to help preserve financial stability, as in the United Kingdom in September-October 2022. In a currency union, tensions in sovereign debt markets could also lead to financial fragmentation. This would threaten the smooth and effective transmission of monetary policy across the whole area and potentially require central bank intervention (Cipollone, 2025).

Important policy trade-offs also apply to the liability side of central bank balance sheets. From the perspective of the private sector, reserves held at the central bank are safe, and liquid assets which serve as an essential means of settlement. Although a reduction in the amount of reserves could lead to better functioning of money markets, with a pickup in trading volumes, there is a risk that liquidity shortages in money markets could raise interest rate volatility at certain junctures, forcing the central bank to intervene. Events in September 2019 in the United States are an example, when the repo rate spiked sharply amid ongoing QT at the same time as high tax payments and Treasury settlements.

Ensuring that balance sheet reductions do not lead to liquidity stress is difficult given uncertainty about the demand for reserves. There is a broad consensus that demand for reserves has increased over the past two decades, partly due to changes in financial regulation (Anderson et al., 2026; BIS, 2025). For instance, reserves have come to be regarded as the prime asset for compliance with liquidity requirements. In addition, financial institutions may hold more reserves as a buffer to avoid the reputational risks from using a central bank liquidity backstop (Anderson et al., 2026; Logan et al., 2026). More broadly, the demand for reserves varies according to the reserves regime. Demand is higher when central banks seek to control short-term interest rates by remunerating reserves while supplying ample liquidity to the market (an ample reserves regime), in contrast to the regime of scarce reserves prior to the global financial crisis (Borio et al. 2024).

Balance sheet size also matters for the cost of public debt

Bond holdings and reserves both affect central bank profits and thus the costs of public debt. QE effectively shortened the average maturity of public debt in the consolidated balance sheet of the general government and the central bank, replacing long-term fixed-rate bonds by short-term floating-rate reserves (OECD, 2023). This increased the speed of transmission of changes in policy rates to public debt costs, making the latter more volatile. Very low policy rates in QE years reduced effective debt costs via higher central bank profits, transferred to governments as dividends. Conversely, higher policy rates in recent years have increased reserve remuneration costs, inducing central bank losses. A smaller balance sheet would reduce the volatility of public debt costs, although such an objective could also be achieved by tilting central bank bond holdings towards shorter-term securities (Schnabel, 2025).

References

Anderson, A.G., A. Barbarino, A.M. Diercks, and S. Miran (2026), “A user’s guide to reducing the Federal Reserve’s balance sheet”, Finance and Economics Discussion Series 2026-019, Board of Governors of the Federal Reserve System, Washington, March.

Ando, M., B. Conigrave, Á. Pina and C. Roulet (2026), “The investor base for sovereign debt: recent developments and potential implications”, OECD Ecoscope blog, February.

Bailey, A. (2024), “The importance of central bank reserves”, Lecture in honour of Charles Goodhart, London School of Economics, May.

BIS (2025), BIS Quarterly Review, September, Bank for International Settlements.

Borio, C., P. Disyatat and A. Schrimpf (2024), “The double-faced demand for bank reserves and its implications”, VOXEU CEPR Column, Centre for Economic Policy Research, February.

Cipollone, P. (2025), “Striking the right balance: the ECB’s balance sheet and its implications for monetary policy”, Speech at an MNI Connect webcast, February.

Logan, L. and S. Schulhofer-Wohl (2026), “Options for reducing the size of the Fed’s balance sheet”, Dallas Fed Economics in Depth, Federal Reserve Bank of Dallas, Texas, April.

OECD (2026a), OECD Economic Outlook, Volume 2026 Issue 1: Under Pressure, OECD Publishing, Paris.

OECD (2026b), Global Debt Report 2026: Sustaining Debt Market Resilience Under Growing Pressure, OECD Publishing, Paris.

OECD (2023), OECD Economic Outlook, Volume 2023 Issue 1: A long unwinding road, OECD Publishing, Paris.

Schnabel, I. (2025), “Towards a new Eurosystem balance sheet”, Speech at the ECB Conference on Money Markets 2025, November.


Norway: Maintaining the edge

Norwegian town on the water

Norway remains highly prosperous and egalitarian, but modest growth and sovereign wealth fund risks underscore a need for fiscal and structural reform.

By Hansjörg Blöchliger, OECD Economics Department


Norway remains among the world’s most prosperous countries, bolstered by a sound macroeconomic framework, a highly skilled workforce and well-anchored wage settlements. And it is among the most egalitarian, thanks to high labour force participation and compressed wages.

Yet its lead over most other OECD countries is narrowing. Overall growth remained modest at 1.1% in 2025. While momentum is gaining ground, downside risks persist, notably the possibility of a sudden and sustained decline in the value of the sovereign wealth fund.

Strengthening the fiscal rule could help tame public spending

The latest OECD Economic Survey of Norway calls for bold reforms. Better fiscal policy should be on top of the list. Public spending as a share of GDP has continuously risen over the past two decades. Withdrawals from the sovereign wealth fund now finance 27% of public expenditure – it was only 3% in 2001. The non-oil budget deficit is at a record 12% of mainland GDP. Complementing the current well-established fiscal rule with a medium-term spending plan could limit spending growth, contain spending excesses and smooth spending over time.

Inflation persists above target. It fluctuates at around 3%, with domestic cost pressures being the main culprit. In May 2026 the policy rate was raised to 4.25% as inflation pressures were mounting in the wake of rising energy and import prices.

Monetary policy needs to remain appropriately restrictive until inflation is durably anchored at target. In this context, the forthcoming renewal of Norges Bank’s mandate should reaffirm—and possibly, reinforce—the primacy of price stability within the flexible inflation‑targeting framework. Preserving the central bank’s operational independence will be essential to underpin policy credibility.

Education and foundational skills: a wake-up call

Norway’s PISA scores have dropped sharply over the past decade, which could jeopardize long-term economic growth and well-being. Differences between high- and low-performers within schools are among the largest in the OECD. The government should reboot the education system by:

  • Better taking account of individual student needs;
  • Improving teaching quality;
  • Granting more autonomy to schools and municipalities in classroom management;
  • Streamlining the curriculum and strengthening core competencies;
  • Using more standardised testing and grading.
Deepening trade relations to manage global value chain disruptions

As an exporter of key commodities, Norway is better placed to deal with global value chain disruptions than most other countries. Yet recent geopolitical and economic tensions have raised the prominence of economic security. To strengthen the security of its supply chains, Norway should maintain inventories of critical goods, while abandoning self-sufficiency targets. It should also extend and deepen international trade agreements.

Unleashing business dynamism

Norway’s business climate is generally good, but not perfect. The firm entry rate has declined and the expansion of existing firms is limited. This is likely due to regulatory burdens, which are higher in Norway than in the average European country. To boost productivity and innovation, Norway should:

  • Reduce administrative reporting burdens and compliance costs;
  • Apply risk-proportionality in licensing requirements;
  • Conduct a broad review of regulations;
  • Support successful firm restructuring, in particular for small businesses.

Norway has the capacity to maintain its edge, but it needs to modernize the policy framework. The right reforms are an opportunity to do so.

For more charts and data from the publication launch visit the Norway Economic Snapshot page

Reference:

OECD (2026), OECD Economic Surveys: Norway 2026, OECD Publishing, Paris,


The Hormuz supply shock – beyond energy

The Middle East conflict has disrupted more than just energy exports. With the flow of goods through the Strait of Hormuz slowing to a mere trickle, the world’s supply chains, from fertilisers to chemicals, have been under strain, pushing up prices and weighing on global growth.

by Christine Arriola, Seung-Hee Koh, Catherine MacLeod, OECD Economics Department


The importance of the Persian Gulf economies for the supply of oil and natural gas is well known. Collectively, the economies produced 27% of global crude oil in 2024, and 40% of global liquid natural gas. But, as shown in the June  OECD Economic Outlook, the Persian Gulf economies are also globally important exporters of many key industrial chemicals and materials as well (Figure 1, Panel A). Given abundant resources of petroleum and natural gas, they are also important exporters of by-products from oil and gas processing (such as methanol and sulphur), and manufactured products that benefit from cheap natural gas, including fertilisers and fertiliser inputs such as urea and ammonia.

The number of vessels carrying goods such as petrol, sulphur and urea from the Persian Gulf to the rest of the world fell from 57 a day in February to just 14 in March and April before recovering to 23 in May 2026, with the Middle East conflict restricting traffic through the only viable water transit route for many products, the Strait of Hormuz (Figure 1, Panel B).  This severely restricts the exports of these key goods to other countries.

Figure 1. The Persian Gulf’s supplies of key world goods exports have been severely constrained

The range of supply chains affected by these disruptions is potentially very broad, stretching from cars to copper mining, and from maize to medical equipment. The Gulf supplies 35% of the world’s helium exports, which is used to produce semiconductors and medical imaging instruments such as MRIs.  Just over half of global sulphur exports and a third of urea exports come from the Gulf. Both products are important for fertiliser and food production, whilst sulphur, once converted to sulphuric acid, is needed for a range of processes, including to process nickel for electric vehicles and process low-grade copper ores. The region exports just over 20% of the world’s traded polyethylene and polypropylene chemical compounds, with polypropylene used for packaging, pipes, medical goods and car parts, and polyethylene used for packaging, bottles and electrical insulation.

The exposure of individual countries to disrupted supply from the Persian Gulf varies considerably. Countries such as India and Singapore are heavily dependent on the Gulf for their supply of key non-energy imports (Figure 2). More broadly, all major importers of Gulf products tend to have a high dependence on the Gulf. The Gulf economies supply between 50 to 90% of the imports of sulphur, methanol and rare gases in their major export markets. A similar pattern holds true for urea and ammonia. For petrochemical compounds, phosphate fertilisers and aluminium, the top five export markets typically have 20‑40 per cent of their imports provided by the Gulf economies.

The overall importance of Gulf production for global supply caused global prices for these goods to rise sharply between February and May (Figure 3, Panel A). The shock to prices was pronounced, reflecting the lack of alternative transport routes from the Gulf – many of these products become economically unviable if transported via air or road. Alternative suppliers are not always easy to find at short notice. In addition, in the short term it can be difficult for end users to use alternative products when equipment is highly specialised – for example, there are alternatives to polypropylene, which is used widely for car interiors, but existing machinery cannot easily switch to using other inputs. In the absence of sufficient inventories, these price increases push up input costs and ultimately selling prices, adding to inflationary pressures. Delays in securing alternative supplies can also increase supply chain pressures, which have risen since the escalation of the Middle East conflict (Figure 3, Panel B).

Figure 3. Price increases and supply constraints raised supply chain pressures

What can governments do?

Countries need to find ways of engaging co-operatively to cope with global supply shocks. Efforts to support free trade and safe passage through key transport corridors are needed to support the flow of goods disrupted by the conflict.  Export restrictions should be avoided, as they tend to exacerbate global shortages and price increases.

Inventories are helping to mitigate the current shock, at least in the short term. National stocks of key products can also help when private costs are prohibitively high. However, lessons from the pandemic show that efforts to accumulate inventories in times of crisis can also exacerbate global supply shortages (OECD, 2023). International co-ordination to align stockpiling strategies as well as long-term planning can help to mitigate these risks (OECD, 2023).

Over the longer term, governments should support efforts to reduce critical dependencies by developing alternative technologies to better ensure resilience. Continuing to encourage firms to diversify both suppliers and buyers will help to improve overall resilience to shocks.

References

OECD (2026), OECD Economic Outlook, Volume 2026 Issue 1: Under Pressure, OECD Publishing, Paris, https://doi.org/10.1787/2d1956f0-en.

OECD (2023), Ready for the Next Crisis? Investing in Health System Resilience, OECD Health Policy Studies, OECD Publishing, Paris.

Pilgrim, G., Y. Dorville and A. Mourougane (2026), “Monitoring global trade by products, using Big Data”, OECD Statistics Working Papers, No. 2026/02, OECD Publishing, Paris.


How exposed is the global economy to Persian Gulf energy supply?

Current tensions in the Middle East have renewed concerns about global energy security and its impact on the global economy. OECD analysis shows that dependence on Persian Gulf energy extends far beyond direct oil imports, creating vulnerabilities that could weigh on inflation, growth and supply chains if the disruptions persist.

by Christine Arriola, Seung-Hee Koh, Catherine MacLeod, OECD Economics Department


Why do events in the Persian Gulf matter?

As tensions in the Middle East continue to raise concerns about energy markets, policymakers are again assessing the risks associated with dependence on Persian Gulf oil and gas. One indicator of exposure is provided by the importance of imports of energy from the Gulf economies. But this provides only a partial picture, given the broader exposures that arise via supply-chain linkages. To understand the scale of these exposures, the OECD Inter-Country Input-Output tables can be used to trace how imported Persian Gulf energy flows through production and supply chains across the global economy. The results highlight the significant direct and indirect exposures that all economies have to a disruption in energy supplies from the Gulf economies.

Who relies on Persian Gulf energy?

Direct dependence on Persian Gulf energy imports for production varies significantly across economies. Asian and European economies, including Thailand, Korea, India and Greece, tend to rely more heavily on imports of crude oil and refined petroleum from the region compared to countries in the Americas (Figure 1). By contrast, the United States and other commodity producers have lower direct exposure, benefiting from greater domestic energy production. Countries with greater direct dependence are particularly likely to feel the effects of supply disruptions and price increases quickly, unless these are cushioned by the use of available energy inventories or other government policy actions.

The overlooked role of supply chains

Direct imports tell only part of the story. To capture total exposure to Persian Gulf energy, it is also necessary to account for how it is used throughout domestic and international supply chains. As industries purchase inputs from suppliers that depend on Gulf energy, exposure can compound across production stages.

As shown in the latest  OECD Economic Outlook, overall exposure to Persian Gulf energy increases significantly across many economies once these indirect supply chain linkages are considered (Figure 2). In many cases, indirect exposure exceeds direct dependence. This is especially evident in Asia, where intra-regional trade and production networks increase indirect exposure in countries such as Thailand, Korea, India, Japan and Chinese Taipei. But there are also important indirect effects across a wide range of non-Asian economies.

This means that disruptions in the Persian Gulf region can spread far beyond countries that import large quantities of oil or gas directly from the Gulf countries. A prolonged disruption to energy supplies from the Gulf could therefore affect the price and availability of a wide range of manufactured goods, transport services and industrial inputs, as well as energy costs.

Which sectors are most exposed to Persian Gulf energy?

The effects of disruptions to Persian Gulf energy supplies are likely to vary across sectors because industries differ in their reliance on energy inputs and in the structure of their production networks. Not surprisingly, the coke and refined petroleum sector has the highest total exposure to Persian Gulf energy in both the OECD and in smaller dynamic Asian economies (DAE) (Figure 3, Panel A). This primarily reflects the importance of crude oil imports from the Gulf for the production of refined products, with indirect exposure through inputs such as electricity, chemicals, transport and machinery that themselves depend on Gulf energy. Sectors such as transport services, chemicals (including petrochemicals) and basic metals also emerge as highly exposed once supply chain linkages are taken into account. Even industries with relatively limited direct use of Persian Gulf energy may be affected through their production networks; for example, agriculture may be affected indirectly through its use of fertiliser, machinery, and transportation services. The overall exposure to Persian Gulf energy is generally higher across most sectors in the dynamic Asian economies, reflecting their greater dependence on energy imports from the region.

The exposure to energy inputs may be even greater than shown if there are broader disruptions to the global supply of oil and gas or diversions of planned energy suppliers from other producers.  Many sectors in both OECD and dynamic Asian economies have a high aggregate exposure to imported energy from all sources (Figure 3, Panel B). This suggests that although dependence on Persian Gulf energy varies across regions, a broader disruption to global energy markets could affect a much wider range of sectors through higher energy costs and supply chain linkages.

How can economies reduce their exposure to energy disruptions?

Energy disruptions can be cushioned in the short term through international coordination of strategic energy stocks. However, the longer supply interruptions persist, the greater the risk that shortages affect production and economic activity more broadly. Over the longer term, reducing vulnerability will require diversifying energy supplies – not only from across source regions, but also by avoiding undue reliance on a particular set of energy sources, such as fossil-fuel imports. Improving energy efficiency is also critical, particularly in regions where energy use remains high compared to international benchmarks.

As the current crisis demonstrates, strengthening resilience to future shocks requires reducing dependence on critical transport corridors and better understanding the supply chain linkages through which disruptions can spread across the global economy.

References:

OECD (2026), OECD Economic Outlook, Volume 2026 Issue 1: Under Pressure, OECD Publishing, Paris, https://doi.org/10.1787/2d1956f0-en.