If it’s not one thing it’s another: supply and demand factors driving rising inflation

By Geoff Barnard and Seung-Hee Koh, OECD Economics Department
The rise in inflation over the past two years in economies around the world has created major challenges for policymakers. One key uncertainty in addressing these challenges has been whether the surge in inflation has primarily reflected demand factors or negative supply shocks. That question cannot be answered with a high degree of precision or certainty, but some techniques exist for estimating the contributions of demand and supply factors. The latest OECD Economic Outlook (OECD, 2022) reports on an exercise to do this for eight OECD countries.
The approach applied in that exercise is based on that of the Federal Reserve Bank of San Francisco, which uses US monthly price and volume personal consumption expenditures (PCE) data to distinguish between items where price and volume shocks move in the same direction and those where they go in opposite directions (Shapiro, 2022a and 2022b). Shocks to prices and volumes in a given month are identified by running vector autoregressions (VARs) for the 10-year period ending in that month for prices and volumes of each item and inspecting the residuals of the respective regressions1. The presumption is that price and volume residuals with the same sign reflect demand – greater demand pushes up both prices and volumes and vice versa for lower demand – while residuals with opposite signs correspond to supply shocks – lower supply means a reduction in volume but an increase in price.
In addition to items where price changes are identified as clearly demand-driven or supply-driven, an intermediate range, labelled “ambiguous”, where price and/or volume residuals are too small to be considered significant, is also identified – a threshold is set that results in approximately 20% of movements on average being classified as ambiguous. The contributions of the three categories – demand-driven, supply-driven and ambiguous – sum to total headline PCE inflation.
Other OECD countries do not have matching disaggregated monthly price and volume data for total personal consumption, although several have information for a subset of consumer spending – typically retail trade. An alternative approach is to use detailed quarterly national accounts data for total household consumption expenditure by consumption purpose (COICOP). The degree of quarterly expenditure disaggregation is highest in the United States, where the PCE data have 136 categories, but lower in the other cases: the number of categories available in the quarterly national accounts data for the other seven countries for which this exercise was undertaken in the Economic Outlook varies from 11 for Denmark to 110 for the United Kingdom.
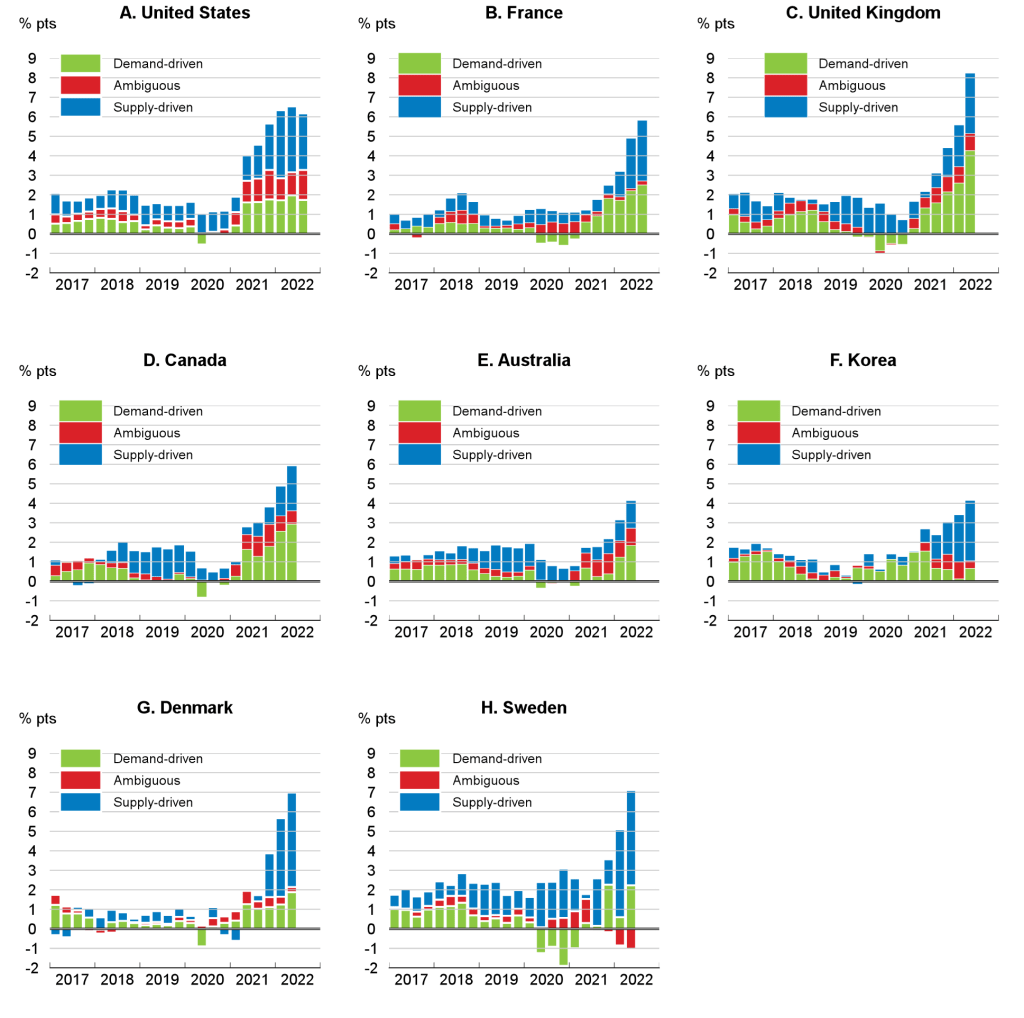
In all countries, both supply and demand factors are found to have pushed inflation up since mid 2020 (Figure 1), highlighting the current difficulties faced by policymakers in assessing the drivers of higher inflation. The proportion of annual headline inflation accounted for by demand-driven items in the second quarter of 2022 ranges from less than one-quarter in Korea to around half in the United Kingdom and Canada. Supply driven inflation is estimated to account for roughly half of total inflation on average in the eight countries shown, but well over half in Denmark, Korea and Sweden. In general, both supply- and demand-driven contributions have increased in recent quarters, with Korea being an exception: there the demand-driven component peaked in the second quarter of 2021 and has subsequently declined. The United States has had a broadly stable demand-driven contribution to year-on-year inflation for several quarters, which is in line with the picture portrayed by the monthly estimates by the San Francisco Fed.
Compared to the immediate pre-pandemic period, when headline inflation was close to central bank objectives in all these economies, the rise of inflation has generally reflected both supply-driven and demand-driven factors. The increase in the contribution of supply-driven inflation has been relatively small in Canada and the United Kingdom. For demand-driven inflation, the increase in the contribution relative to 2019 was largest in the United Kingdom (around 4 percentage points), and also relatively large in Canada and France.
There are several caveats to bear in mind when considering the results of this exercise. First, the method used identifies the price change for each item in a given period as being primarily demand- or supply driven, but in most cases a mix of supply and demand factors will be operating, even when the exercise allocates the item to the demand-driven or supply-driven category. Also, the pandemic period is clearly atypical, with special factors at play which may make the results less reliable. Finally, the difference in the degree of disaggregation in the available data may limit the extent to which valid conclusions can be drawn from cross-country differences.
Figure 1. Contributions of supply- and demand-driven inflation to headline inflation in selected OECD economies
Decomposition of contributions to year-on-year headline inflation
1. A two-equation VAR of prices and quantities: pi,t= Zi, t-1γ+εi,t^p and qi,t= Zi,t-1γ+εi,t^q was estimated where pi,t and qi,t are the logs of the price and quantity indices respectively of category i in quarter t, Zi,t-1 is a vector of 4 lags of the log price and quantity indices of category i in quarter t and εi,t^p and εi,t^q are the price and quantity residuals for category i in quarter t. The equations were estimated over a 10-year rolling window for the period 2005Q4-2022Q2 or 2022Q3. The supply-driven, demand-driven and ambiguous contributions to year-on-year inflation are computed as a weighted sum of the latest four quarterly contributions.
References:
OECD (2022), OECD Economic Outlook, Volume 2022 Issue 2, OECD Publishing, Paris.