Addressing high public debt: selective expenditure restraint matters

By Álvaro Pina, Mauricio Hitschfeld and Martin Borowiecki, OECD Economics Department

In dealing with significant fiscal challenges posed by ageing and the climate transition and the risk of rising future debt burdens, countries can draw on the lessons from past episodes of large and sustained reductions in debt-to-GDP. Work in the November 2023 OECD Economic Outlook found that there have been 34 sustained debt reduction episodes in OECD countries since the late 1970s, with 25 countries having experienced at least one such episode during this time. Reductions in the debt-to-GDP ratio have mainly hinged on achieving and sustaining a primary surplus over several years, largely via expenditure restraint, as well as favourable cyclical conditions and low interest rates. Expenditure restraint has often been accompanied by growth-friendly shifts in the composition of public spending.

What has made debt-to-GDP ratios fall?

Debt reduction episodes are defined as ones that persist for a minimum of five years and bring down the gross debt-to-GDP ratio by at least 10 percentage points. All episodes start in the year after the debt ratio peaks and end when the debt-to-GDP ratio bottoms out. The analysis spans from the late 1970s to 2019, though data availability is limited for some countries.

Accounting decompositions of changes in the debt-to-GDP ratio typically consider three components (Rawdanowicz et al., 2021): the primary balance-to-GDP ratio (hereafter the “primary balance”), the interaction of debt and the differential between interest rates and GDP growth (the so‑called “snowball effect”), and a residual stock-flow adjustment that summarises changes in gross debt unaccounted for by the budget balance. In turn, the average primary balance over each debt reduction episode can be decomposed into the initial balance when the debt ratio peaks and the average primary balance change over the length of the episode relative to the initial balance. Likewise, the aggregate snowball effect can be split to show separate impacts from real interest rates (with inflation measured by the GDP deflator) and real GDP growth.

The final decomposition of each debt reduction episode is shown in Figure 1. This highlights two key factors:

  • In all but three episodes the primary balance is on average in surplus, helping to reduce the debt ratio. In around 80% of the episodes, this is due to improvements in the primary balance during the episode itself.
  • In about two thirds of the episodes, and in all but one of the 14 episodes that have begun since the year 2000, the snowball effect contributes positively to the debt reduction. Cyclical conditions have almost always improved relative to those when the debt ratio peaked, and the real interest rate has often been only marginally positive or even negative. 

Figure 1. Decomposition of the average annual change in the debt-to-GDP ratio during debt reduction episodes

Note: Episodes are ordered chronologically by starting year. See Annex 1.B. in OECD (2023) for further details.
Source: OECD Economic Outlook 113 database; and OECD calculations.


Expenditure restraint and shifts in the composition of public spending

Improvements in the primary balance during debt reduction episodes have mainly occurred due to declines in the primary expenditure-to-GDP ratio. This has taken place in over 80% of the 34 episodes considered. In contrast, the primary revenue-to-GDP ratio has risen in fewer than half of the episodes, mostly for ones that began in the 1980s and 1990s.

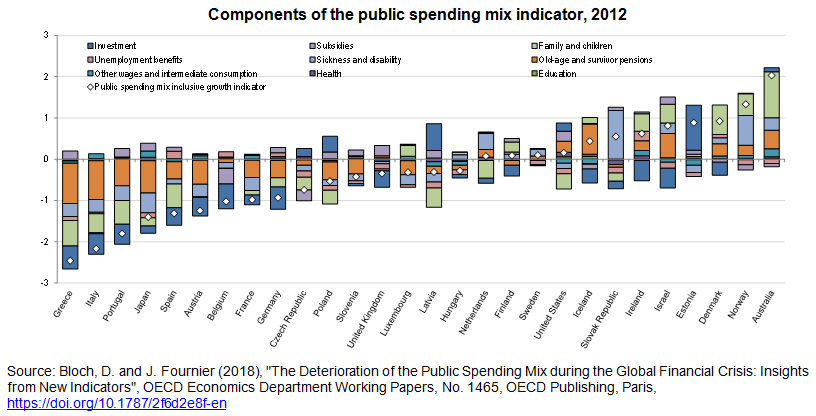
Expenditure restraint has often been accompanied, and likely made more sustainable, by relatively growth-friendly shifts in expenditure composition. Public investment as a share of GDP declined in about two-thirds of the episodes (23 out of 34; Figure 2), but these declines were often smaller than declines in other expenditure items, in contrast to the large public investment cuts often seen in consolidation episodes (Pina, 2016). Spending on education, health and family and children, generally regarded as growth- and equity‑friendly (Cournède et al., 2014; Fournier and Johansson, 2016), has generally been better preserved than spending on pensions and the bulk of non-education, non-health wages and intermediate consumption. Declines in the GDP share of the remainder of public expenditure, including subsidies, unemployment, sickness and disability benefits, other current transfers, and capital transfers have typically been the largest factor behind spending restraint. Many of these items are not growth-enhancing, though some can be very important for poorer households.

A positive differential between GDP growth and interest rates cannot be relied upon to decrease the debt-to-GDP ratio in the coming years, and attaining primary surpluses via expenditure restraint may prove difficult (Arslanalp and Eichengreen, 2023). This reflects the multiple future spending pressures governments face. Reductions in the debt ratio may thus be harder to achieve in the coming decade than in the past. However, past debt reduction episodes illustrate that it is possible to make significant savings in spending items which often harm growth, such as subsidies and certain transfers. In the current context, where the composition of public expenditure needs to change to address new challenges, that lesson remains highly relevant. However, such changes need to be accompanied by improvements to the overall targeting and design of spending programmes to maintain support for those who need it most.

Figure 2. Growth-friendly expenditure has typically been spared during debt reduction episodes

Changes in ratios to GDP, percentage points, average over each debt reduction episode

Note: The chart decomposes the average annual change in primary expenditure as a share of GDP over the length of each episode relative to its initial value into several expenditure components as defined in the OECD Public Finance Dataset (Bloch et al., 2016). In some earlier episodes not all components can be identified due to data limitations. Episodes are ordered chronologically by starting year. See Annex 1.B. in OECD (2023) for further details.
Source: OECD Economic Outlook 113 database; OECD Public Finance Dataset; and OECD calculations.


References

Arslanalp, S. and B. Eichengreen (2023), “Living with High Public Debt”, paper presented to Jackson Hole Conference, August 2023.

Bloch, D., Fournier, J.-M, D. Gonçalves and Á. Pina (2016), “Trends in Public Finance: Insights from a New Detailed Dataset”, OECD Economics Department Working Papers, No. 1345, OECD Publishing, Paris, https://doi.org/10.1787/4d3d8b25-en.

Cournède, B., A. Goujard and Á. Pina (2014), “Reconciling Fiscal Consolidation with Growth and Equity”, OECD Journal: Economic Studies, vol. 2013/1, https://doi.org/10.1787/eco_studies-2013-5jzb44vzbkhd.

Fournier, J. and Å. Johansson (2016), “The Effect of the Size and the Mix of Public Spending on Growth and Inequality”, OECD Economics Department Working Papers, No. 1344, OECD Publishing, Paris, https://doi.org/10.1787/f99f6b36-en.

OECD (2023), OECD Economic Outlook, November 2023, https://doi.org/10.1787/7a5f73ce-en.

Pina, Á. (2016), “Making Public Finances More Growth and Equity-friendly in the Euro Area”, OECD Economics Department Working Papers, No. 1316, OECD Publishing, Paris, https://doi.org/10.1787/5jlv2jgl4kbr-en.

Rawdanowicz, Ł., Turban, S., Haas, J., D. Crowe and V. Millot (2021), “Constraints and Demands on Public Finances: Considerations of Resilient Fiscal Policy”, OECD Economics Department Working Papers, No. 1694, OECD Publishing, Paris, https://doi.org/10.1787/602500be-en.


South Africa: Improving productivity and the efficiency of public spending to bolster living standards

By Falilou Fall, OECD Economics Department

South Africa needs bold structural reforms to lift economic growth. The coronavirus crisis, flooding in Kwa-Zulu Natal and widespread electricity cuts have weakened an already fragile economy (Figure 1). GDP growth is projected to slow to 1.8% and 1.3% in 2022 and 2023, respectively. The war in Ukraine is creating additional risks: on the one hand, rising commodity prices are prolonging the commodity boom cycle, but, on the other hand, higher inflation is denting purchasing power. The social distress relief grant, put in place during the pandemic and covering up to 10.5 million individuals, has helped mitigate the effects of the crisis and inflation on poverty, but may not be sufficient if the economy does not grow faster: unemployment stood at 34.5% in the first quarter of 2022.

Figure 1. Electricity availability has fallen dramatically

Yearly hours of load shedding by stages and total annual supply in TWh

Note: Loadshedding is implemented in stages with more frequent power cuts at higher stages. At every stage of loadshedding, Eskom rations the country by a further 1 000MW of power. Stage 1 = 1 000 MW, Stage 2 = 2 000 MW, Stage 3 = 3 000 MW, Stage 4 = 4 000 MW, Stage 5 = 5 000 MW, Stage 6 = 6 000 MW.
Source: Eskom; Council for Scientific and Industrial Research, South Africa; Statistics South Africa; OECD calculations.

Weak growth performance has deep roots. South Africa’s growth underperformed during the past decade: GDP per capita was already lower in 2019 than in 2008, and over the period 2009–2019, GDP growth averaged only 1.1%. Weak economic growth is mostly explained by declining productivity due to deteriorating infrastructure, weak telecommunication networks and low investment. Failing electricity generation has become the main bottleneck to production and concern for investors. Skills shortages remain a constraint in several sectors. Adding to the issue, there is limited fiscal space to cope with high public spending pressures, notably for infrastructure projects, electricity generation, education and also social transfers. The debt-to-GDP ratio stands now at 70% of GDP.

The 2022 OECD Economic Survey of South Africa highlights three areas to boost potential growth and improve medium-term fiscal sustainability. The government should:

  • Improve the efficiency of public spending and of the tax system: Government exposure to state-owned enterprises remains high and, in terms of state guarantees, amounts to around 16% of GDP. The financial performance of SOEs worsened with the pandemic, increasing the pressure on public finances. Restoring the finances of the main SOEs and privatising those intervening in competitive markets would reduce the fiscal burden. Better enforcement of sanctions for corruption offences is needed to restore public confidence and the proper functioning of public services. Reducing the size of the government’s wage bill also remains essential. Finally, even though South Africa’s tax-to-GDP ratio, standing at 26% of GDP, is higher than many emerging economies, there is room to increase tax revenues, while reducing inequality and making the tax system less distortive to growth. There is a wide range of tax provisions and exemptions that reduce effective tax rates significantly below statutory tax rates. The corporate income tax rate of 28%, for instance, is relatively high but tax liabilities are reduced by generous assessed losses.
  • Reduce labour market rigidities: The pandemic has worsened labour market outcomes and further increased inequality. Unemployment is higher than the OECD average and peer countries, particularly for the youth. Wage bargaining remains confrontational and labour-employer relations have been ranked among the weakest by the World Economic Forum. The wage bargaining system suffers from a relatively high level of bargaining, at the industry level, declining representativeness of bargaining councils. Agreements are extended to non-members and often inadequate for SMEs. More wage negotiations at the firm level should be encouraged. For instance, agreements with representative unions at the firm level could be accepted as substitute to agreements at the sector level.
  • Boost productivity growth: South Africa’s productivity is comparatively low, and it has been falling over time (Figure 2). Improved infrastructure, enhanced competition and better skills are required to lift productivity, potential growth and living standards. Low and inefficient public investment, with insufficient cost-benefit analyses, are weighing on the quality of transport, telecommunications, and energy infrastructure. Maintenance is not conducted as regularly and early as needed. The funding of infrastructure projects from the general government budget should be augmented based on cost-benefit analysis. The economy suffers from lack of openness and competition. New broadband frequencies should be allocated rapidly to increase speed and lower subscription fees. Entry into professional services should be facilitated. Aligning competition policies of sectors regulators with the Competition Commission would open business opportunities and ease the entry and growth of SMEs. The country suffers from shortages of skilled workers and skills mismatches more generally. Efforts to increase the quality of education should continue and include increasing the quality of primary and secondary schools, further developing vocational training and adult learning. Changing the financing formula of universities would reduce the cost per student and allow enrolling more students in tertiary education.

Figure 2. Productivity is lagging behind

GDP per hour worked in constant USD PPPs, 2021 or latest

Source: OECD productivity database.

Reference:

OECD (2022), OECD Economic Surveys: South Africa 2020, OECD Publishing, Paris, https://doi.org/10.1787/d6a7301d-en


Does public spending foster inclusive growth in your country?

by Debbie Bloch, Public Economics Division, Economics Department

Governments today need to balance the policy goals of boosting economic growth and improving equity when making budget decisions.  How can public spending choices promote inclusive growth?  What can be learned from previous spending decisions in times of crisis?

As it becomes increasingly important for policymakers to look at public finances in terms of both growth and income equality, a new set of indicators has been developed to help governments assess how public spending can be geared toward achieving these twin goals.

A first set of indicators combines information on the mix of public spending. Each spending item share is multiplied with an estimated coefficient from growth and inequality equations to build both a growth and an income distribution component, which is then summed up to an aggregate inclusive growth indicator.  The outcomes show that public investment and family and child benefits help butress inclusive growth, while old age pensions and government subsidies hurt the most. The indicator below shows that the public spending mix is least conducive to inclusive growth in Greece and most conducive in Australia.

publicspending-components-blog debbie

Taking the analysis further, a second set of indicators adds information on the size and effectiveness of governments to the public spending mix analysis, providing an overall indicator on the effects of public spending on inclusive growth.  This indicator shows that countries with large but efficient governments, such as Nordic countries, along with those favouring inclusive-growth friendly spending items do well in the indicator ranking, while those with less-effective governments, and with high old-age pension spending tend to do worse.


public-spending-components blog debbie2
Policymakers need to be aware of these effects when facing hard choices, particularly during times of economic crisis.  Analysis based on these new indicators have shown there is a striking link between the growth component of the public spending mix indicator and the output gap: the capacity of the public finances to support inclusive growth deteriorated markedly in the countries hardest hit during the recent crisis, as governments slashed budgets with little regard to which items would underpin inclusive growth.

What can we take away from this?  Countries facing pressure to reduce spending during an economic downturn need to consider which spending items would be most – and least – condusive to inclusive growth, to ultimately help them come out stronger after a crisis.  Increasing public investment and family benefits, for example, while targetting reductions in less productive spending items should help assure healthier, fairer economies.

Reference:

Bloch, D. and J. Fournier (2018), “The Deterioration of the Public Spending Mix during the Global Financial Crisis: Insights from New Indicators”, OECD Economics Department Working Papers, No. 1465, OECD Publishing, Paris, https://doi.org/10.1787/2f6d2e8f-en.

Further reading:

Fournier, J. and Å. Johansson (2016), “The Effect of the Size and the Mix of Public Spending on Growth and Inequality”, OECD Economics Department Working Papers, No. 1344, OECD Publishing, Paris, https://doi.org/10.1787/f99f6b36-en.

Johansson, Å. (2016), “Public Finance, Economic Growth and Inequality: A Survey of the Evidence”,OECD Economics Department Working Papers, No. 1346, OECD Publishing, Paris,https://doi.org/10.1787/094bdaa5-en.

Bloch, D. et al. (2016), “Trends in Public Finance: Insights from a New Detailed Dataset”, OECD Economics Department Working Papers, No. 1345, OECD Publishing, Paris,https://doi.org/10.1787/4d3d8b25-en.


Towards a more prosperous and inclusive Brazil

By Jens Arnold and Alberto González Pandiella

Over the past two decades, strong growth combined with remarkable social progress has made Brazil one of the world’s leading economies. However, Brazil remains a highly unequal country, recent corruption allegations have revealed significant challenges in economic governance and the situation of its fiscal accounts is challenging with high and rising public debt (OECD, 2018). This calls for wide-ranging reforms to sustain and continue progress on inclusive growth. The government has started to put in place significant reforms, including a fiscal rule and a financial market reform that aligns directed lending rates with market rates. The long and deep recession is over and growth is projected to accelerate significantly this year. But more needs to be done to improve the living standards of all Brazilians.

The overall budget deficit is close to 8% of GDP driven by rising expenditures. Gross public debt has increased by approximately 20 percentage points of GDP over the last 3 years and stands around 75% of GDP.  Implementing the planned fiscal adjustment and achieving fiscal targets is crucial for restoring the credibility of fiscal policy and avoiding a fiscal crisis. A comprehensive social security reform has become the most urgent element of the fiscal adjustment, as much of the worsening of the deficits is due to rising pension spending. A pension reform is also an opportunity to make growth more inclusive through better targeting of benefits. Aligning Brazil’s pension rules with those practiced in OECD countries could be done in a way to preserve the purchasing power of pensioners while significantly improving the sustainability of the pension system. For example, in OECD countries people retire on average when they become 66 years old, while the effective retirement age in Brazil is 56 years for men and 53 for women. Establishing a formal minimum retirement age would help, in addition to rethinking the current benefit indexation mechanisms. Without reform, pension expenditure will more than double by 2060 (OECD, 2017), which would lead to unsustainable fiscal dynamics (Figure 1).

6_Public-debt-trajectory_blog


Improving the effectiveness of public spending, and in particular public transfers, will also be crucial for further social progress. At present a large and rising share of social benefits is paid to households that are not poor, which reduces their impact on inequality and poverty. Already, poverty is more than three times higher among children and youths than among those aged above 65 (Figure 2). Limiting future increases in those social benefits that do not reach the poor would be a first step. That would instead allow shifting more resources towards transfers that do reach the poor, such as Bolsa Família, which is highly regarded across the world and reaches the poor like hardly any other social programme in Brazil. This would help particularly children and youths. Currently Bolsa Família only represents 0.5% of GDP out of the 15% of GDP that Brazil spends on social transfers (OECD, 2018). There is also scope to reduce transfers to the corporate sector, which have increased markedly over recent years. These transfers, often granted in the form of tax exemptions or subsidised lending, have not been associated with visible improvements in productivity or investment, but they benefitted primarily the more affluent, besides creating fertile ground for corruption and political kick-backs.

9_Poverty

Further advances in living standards will also hinge on finding a new inclusive growth strategy, ensuring that the benefits of growth will be broadly shared across the population. Productivity will have to become the principal engine of growth in the future, because the demographic bonus that has supported growth in Brazil is reversing. But raising productivity will require significantly higher investment and trade. Brazil has one of the lowest investment rates among OECD and emerging market economies and it is also less integrated into global trade. Boosting investment and trade would raise productivity, helping Brazilians to access higher wages and living standards.

References:

OECD (2018), OECD Economic Surveys:Brazil, OECD Publishing, Paris.

OECD (2017), “Pension Reform in Brazil, OECD Policy Memo“, April 2017, https://www.oecd.org/brazil/reforming-brazil-pension-system-april-2017-oecd-policy-memo.pdf.