Statistical Insights: An x-ray view of inflation

Stat-Insights-200_fw

By Pierre-Alain Pionnier, Francette Koechlin, Anne-Sophie Fraisse and Elena van Eck.

Inflation may be present in some parts of an economy but not others. Contributions to annual inflation show how much different product groups contribute to overall inflation in a given year.

The measure is a useful tool to understand where inflation is occurring in different countries, analyse trends in inflation over time, and identify volatile and stable components of inflation. It may also help explain why consumers’ perceptions of inflation sometimes differ from official figures.

This Statistical Insight uses figures for Germany, Japan and the United States (US) to illustrate the usefulness of data on contributions to inflation.

Analysing inflation by component

In addition to aggregate national Consumer Price Indices (CPIs), the OECD provides data on the contributions to annual inflation of 12 standard product groups and special aggregates.

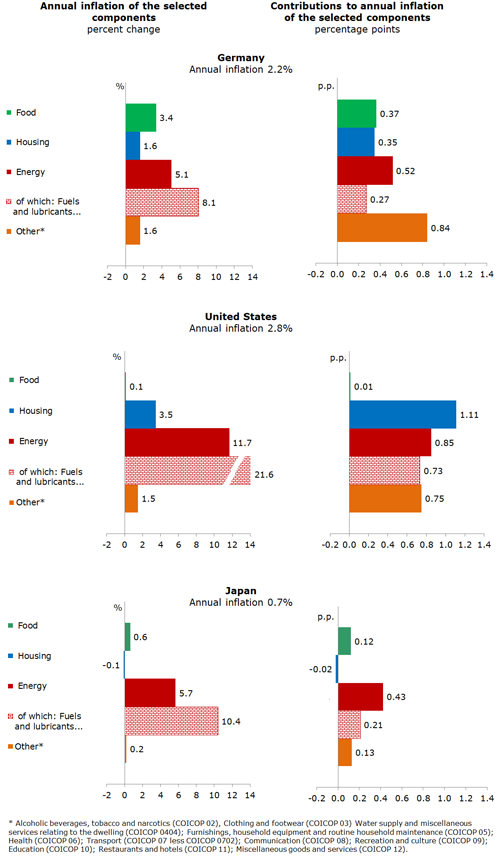
Figure 1 shows that in Germany, Japan and the US, aggregate inflation hides wide variations in price movements across product groups. In Germany, while overall prices increased by 2.2% in the year to May 2018, food and housing prices increased by 3.4% and 1.6% respectively. In the US, energy prices increased by 11.7%, and gasoline prices by 21.6%, while overall prices only increased by 2.8%.

The contribution of a given product group to overall inflation depends both on the price change of the relevant product group and on its share in consumers’ expenditures. The shares vary between countries. For example, households spend around 20% of their incomes on housing in Germany and Japan, but over 30% in the US. The high share of housing costs in US households’ budgets meant that price changes in those costs contributed most to overall US inflation in the year to May 2018, even though energy prices rose much faster than housing prices. In fact, energy prices shot up everywhere, but only in Japan was energy the largest contributor to overall inflation.

It may also be the case that consumers are more sensitive to movements in the prices of items they purchase frequently. For example, they may feel that inflation is high if the prices of food items are rising quickly, even though food products and non-alcoholic beverages represent less than 10% of households’ expenditures in the US, around 10% in Germany, and less than 20% in Japan.

Figure 1. Annual inflation rate (%) and contributions of selected components
May 2018, Germany, United States and Japan

Contribution-inflation-Fig1

Recent trends in overall and core inflation (2012-2018)

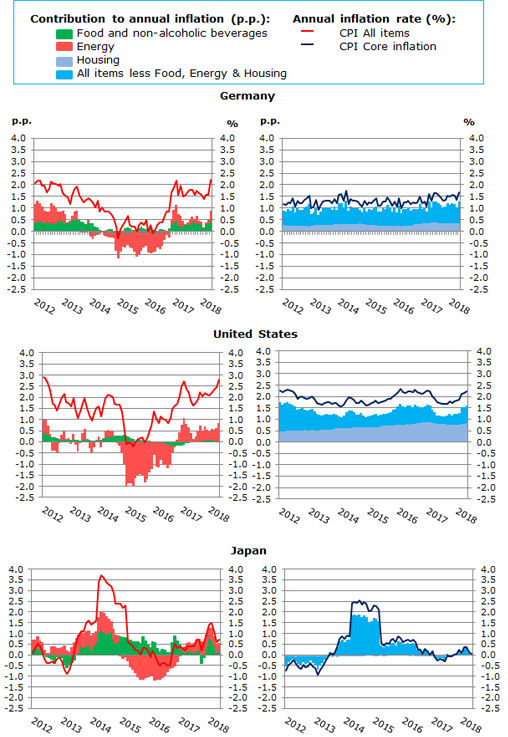
Because food and energy make volatile contributions to inflation, economists often focus on a consumption basket that excludes them in order to better understand and forecast long-term developments in inflation. The resulting numbers are called underlying, or core, inflation.

Figure 2 shows that energy contributed to the bulk of inflation fluctuations between 2012 and 2018. Changes in energy prices are dominated by movements in world crude oil prices, but exchange rate fluctuations also play a role because oil prices are usually fixed in US dollars. In 2015, for example, oil prices fell but at the same time the euro and the yen depreciated against the US dollar, so that oil prices in those currencies did not fall as much as they did in dollars. This meant that falling oil prices did not reduce inflation as much in Germany and Japan as in the US.

Even after excluding volatile food and energy prices, core inflation rates vary significantly across countries. Figure 2 shows that core inflation in Japan has long been lower than in Germany and the US, except for a blip in 2014-15 caused by a hike in value-added tax. Since 2016, core inflation in the US has also been consistently higher than in Germany. The major contributor to these differences is housing prices, which have risen faster in the US than in Germany, and faster in Germany than in Japan. Note that housing prices correspond to housing rentals (including imputed rentals for owner-occupied dwellings) and maintenance costs. This ignores the purchase prices of houses and apartments, which are considered as investments rather than consumption and are covered by separate price indices.


Figure 2. Annual inflation rates (%) and contributions of selected components (percentage points)
2012-2018, Germany, United States and Japan


Contribution-inflation-Fig2

The measure explained

Contributions to annual inflation represent the contributions to overall inflation in percentage points by different product groups. The contribution of each product group depends both on the price change in the relevant product group and its weight in households’ expenditures.

The OECD calculates contributions to inflation based on national data for all countries except Austria, Chile, Finland, Mexico, the Netherlands, Poland, Sweden, and the United Kingdom, whose National Statistics Offices provide the data directly. For further information please see OECD CPI FAQs.

Where to find the underlying data


Could current inflation targeting frameworks be improved?

by Makoto Kasai and Łukasz Rawdanowicz, OECD Economics Department[1]

EOcov

As discussed in the latest OECD Economic Outlook, the prolonged undershooting of inflation targets, despite massive monetary policy stimulus and stronger economic growth and lower unemployment, raises issues about the appropriateness of current inflation targeting frameworks in advanced economies. While the frameworks differ in detail and implementation, they are principally based on medium-term inflation objectives of 2%.

Various modifications of, and alternatives to, inflation targeting frameworks have been advocated to make monetary policy more effective and credible. While none of them is without drawbacks, and it is not clear if they would provide substantial improvements from those used at present, periodic reviews of current frameworks would be useful.

Raising the inflation target

Based on theoretical models with forward-looking expectations, raising the inflation target has been suggested as a way to boost inflation expectations and in turn inflation outcomes (Blanchard et al., 2010; Ball, 2014; Baker et al., 2017).

Higher inflation targets, if effective in raising actual inflation, are estimated to lower the probability of hitting an effective zero lower bound (ZLB) and thus reduce the potentially large economic costs of stagnations (Kiley and Roberts, 2017; Dorich et al., 2018; Ball, 2014). Although, in principle, the economic costs caused by the ZLB could be mitigated by adopting unconventional measures, the overall effectiveness of these measures remains debatable.

However, higher target and actual inflation could also entail economic costs, though estimating the level of inflation where costs start to dominate is difficult. Moreover, if a central bank changes its inflation target once, further revisions may be expected, leading to de-anchoring of inflation expectations and undermining the effectiveness of the inflation targeting framework.

While low inflation targets helped to reduce inflation in the 1990s (and its subsequent stabilisation), it is uncertain if the opposite would work. Indeed, Japan’s experience with increasing the inflation target from 1% to 2% in 2013 followed by massive quantitative and qualitative monetary policy easing, after the prolonged period of subdued inflation, demonstrates the practical challenges. Even if realised and expected inflation have indeed increased, they have remained below the target.

Price level targeting

Under price level targeting, a period of lower inflation should be followed by a period of higher inflation so as to neutralise the impact on the price level. In the current context, it is equivalent to committing temporally to a higher inflation target, but with the benefit of avoiding the cost of permanently higher inflation. As with raising inflation targets, the benefits of this framework depend on the ability of central banks to affect inflation expectations and outcomes. If this is the case, the framework will help to raise inflation expectations and avoid the ZLB in the future. If this is not the case, or if the economy experiences persistent positive supply-side shocks, it could result in prolonged periods of very easy monetary policy with risks to future financial stability.

Symmetric operation of inflation targeting

Central banks’ commitment to symmetric operation of monetary policy around their inflation targets is in a sense a milder variant of price level targeting. While the major central banks have symmetric price stability objectives in the medium term, some of them are perceived to have a bias in operating their monetary policy to maintain inflation close to but below their targets (Evans, 2017). This bias might have weakened their ability to raise inflation expectations and to achieve the target. This concern arguably prompted the US Federal Reserve and the ECB to emphasise the symmetric inflation goal in their communication (Draghi, 2016).

Nominal GDP level targeting

Nominal GDP level targeting, if effective, shares the advantages of price level targeting while it can avoid central banks’ overreacting to supply shocks (Bean, 2013). In spirit, it is similar to the dual mandate of the US Federal Reserve. It is expected to work well in the situation where maintaining short-term price stability is not enough to achieve stable growth of the economy in the medium to long run. Nominal GDP level targeting, however, shares drawbacks with the above propositions, and adds complications as nominal GDP is even more difficult to control than inflation. Moreover, GDP data tend to be revised substantially and are not available at a high frequency.

Inflation target range

An inflation target range with the upper band above 2% would have some similarity to the arrangements discussed above in the current context. This is especially the case with respect to the symmetric operation of inflation targeting, by signalling that higher inflation could be tolerated.

However, a framework with a target range allows the authorities to operate monetary policy more flexibly, reflecting the fact that monetary authorities have only a limited ability to predict inflation and control inflation expectations and outcomes (Andersson and Jonung, 2017). This flexibility is useful when the persistence and size of idiosyncratic shocks are uncertain or when changes in the monetary policy stance could aggravate financial stability risks. As long as inflation is expected to stay within the range, monetary authorities would not need to change their stance, while – as with point inflation targeting – they would be expected to act when inflation risks deviating from the range.

With a relatively narrow and low range, this framework could still be consistent with the price stability objective and would not involve negative welfare effects, justifying a less active monetary policy stance. Consequently, it might help to lower the risk of hitting the ZLB, as central banks over time could keep their powder dry. This framework could also improve central banks’ credibility, as there will be a higher probability of inflation staying within a range rather than at a point target. With the current frameworks, even small deviations of inflation from the target point tend to be interpreted as a failure of monetary policy and raise expectations of monetary authorities’ reacting.

On the other hand, the inflation targeting framework based on a range could potentially lower central banks’ influence on inflation expectations as it could be perceived as weakened commitment to price stability. The target range could make it difficult to understand the reaction function of central banks. Indeed, a point inflation target may be easier to communicate and may be more effective in influencing inflation expectations of households and businesses.

References

Andersson, F. N. G. and L. Jonung (2017), “How Tolerant Should Inflation-Targeting Central Banks Be? Selecting the Proper Tolerance Band – Lessons from Sweden”, Lund University Department of Economics Working Paper, No. 2017: 2.

Baker, D. et al. (2017), “Prominent Economists Question Fed Inflation Target”, letter to the Federal Reserve Board of Governors, The Center for Popular Democracy, June 2017. http://populardemocracy.org/sites/default/files/Rethink%202%25%20letter.pdf

Ball, L. (2014), “The Case for a Long-Run Inflation Target of Four Percent”, IMF Working Papers, No 14/92.

Bean, C. (2013), “Nominal Income Targets – An Old Wine in a New Bottle”, speech at the Institute for Economic Affairs Conference on the State of the Economy, London, February.

Blanchard, O., G. Dell’Ariccia and P. Mauro (2010), “Rethinking Macroeconomic Policy”, Journal of Money, Credit and Banking, 42(1), 199-215.

Dorich, J., N. Labelle, V. Lepetyuk and R. R. Mendes (2018), “Could a Higher Inflation Target Enhance Macroeconomic Stability?”, Bank of Canada Staff Working Paper, 2018-17.

Draghi, M. (2016), “Delivering a Symmetric Mandate with Asymmetric Tools: Monetary Policy in a Context of Low Interest Rates”, speech at the ceremony to mark the 200th anniversary of the Oesterreichische Nationalbank, Vienna, June.

Evans, C. L. (2017), “Low Inflation and the Symmetry of the 2 Percent Target”, Speech at UBS European Conference, London, November.

Kiley, M. T. and J. Roberts (2017), “Monetary Policy in a low interest rate world”, Brookings Papers on Economic Activity, March 2017.

OECD (2018), OECD Economic Outlook, Volume 2018 Issue 1: Preliminary version, OECD Publishing, Paris.

[1]. The opinions expressed and arguments employed are those of the authors and not necessarily of their respective institutions. Makoto Kasai currently works for the Bank of Japan.


Will the inflation genie escape the bottle? New evidence on globalisation, competition and inflation

By Dan Andrews, Peter Gal and William Witheridge, Economics Department

Markets and commentators are speculating that there may be a sustained pick-up in inflation in the United States, after years of subdued price pressures. Along with continued solid US jobs growth and low unemployment, there are tentative signs of higher wage growth and the fiscal stimulus will also boost short-term growth. Global growth is also getting stronger (OECD, 2018a).

As well as these recent developments, longer-term worldwide trends which have kept inflation generally low since the mid-1990s may also be reversing. In particular, globalisation appears to have stalled since the crisis, aggregate demand in strengthening and output gaps have closed or are generally close to zero in most major countries. Moreover, there is mounting evidence of rising market power in services sectors. Together, these trends risk letting the inflation genie out of the bottle.

Declining inflation in many countries over the past few decades at the same time as rising global competition has led to a debate on the importance of globalisation for domestic inflation. Auer, Borio and Filardo (2017) at the BIS have argued that rising GVC integration has accentuated the importance of global factors – particularly global economic slack – for domestic inflation. However, recent research at the ECB (Tagliabracci, Osbat and Koester, forthcoming) and at the US Federal Reserve (Yellen, 2017) has disputed this conjecture.

Figure 1 shows that global value chain (GVC) integration expanded significantly from 1995 until the crisis, while inflation remained relatively subdued. In the post-crisis period, GVCs flattened off and remained around the pre-crisis peak, while producer price inflation has fallen dramatically and remains very low on average across industries for our sample of countries.*

Figure 1

Motivated by this pattern, our new analysis of prices and globalisation (Andrews, Gal and Witheridge, 2018) goes beyond existing research by using recently released cross-country OECD data on prices and GVCs by industry, rather than at the country level, which allow us to control for time-varying country-specific and global shocks. We find that stronger Backward GVC Participation – that is, domestic producers relying more on foreign value added content – is associated with lower producer price inflation at the industry level. For example, we estimate that the rise in GVCs from the mid-1990s up to the crisis reduced annual producer price inflation by 0.15 percentage points on average, but this effect is more than double in some OECD countries (Figure 2).

Figure 2.JPG

Confirming the existence of a cost-reduction and wage moderation channel, we also show that higher backward GVC participation is associated with lower wages and rising productivity in the importing countries and industries, especially when low-wage countries are integrated in their supply chains. This channel is likely to have contributed to lower inflation in recent years as the structure of the source (i.e. supplying) countries in GVCs has moved increasingly towards low-wage countries (Figure 3), despite a stall in the overall level of GVC integration (Figure 1). Therefore, inflation in advanced economies could remain low if the composition of GVCs continues to shift towards low-wage countries.

Figure 3.JPG

Moreover, we find that a high level of GVC integration can also dampen producer price inflation by accentuating the impact of global economic slack on domestic inflation. This provides new industry-level evidence to support the finding of Auer et al (2017) who use aggregate data covering the pre-crisis period. We show this by using a similar approach combining bilateral industry-level GVC and national output gap data to measure changes in global slack over time.

This implies that weak global demand has a larger disinflationary impact when GVC participation is higher. For example, given our sample of countries facing an average global output gap of -1.5 per cent in 2014, we estimate that annual producer price inflation was on average 0.25 percentage points lower in 2014 than for 1996 GVC levels. This figure is more than 0.5 percentage points, however, for countries that experienced a particularly large rise in GVC participation. But with slowing expansion of GVCs since the crisis, coupled with stronger aggregate demand and output gaps closing in most countries, this could lead to greater inflationary pressures in the medium term.

The third longer-term trend posing an upside risk to inflation is declining competition and market contestability. We exploit harmonised cross-country firm-level data to show an increasing trend in mark-ups, which suggests rising market power in services sectors (Figure 4). This upward trend in mark-ups is consistent with other estimates for the United States (De Loecker and Eeckhout, 2017) and other OECD countries (Calligaris et al, 2018). In turn, in these market services sectors we find a significant positive correlation between producer price inflation and mark-ups within industries since the early 2000s. This leads us to conjecture that if market power continues to rise it may pose a further risk to letting the inflation genie out of the bottle.

Figure 4.JPG
This analysis suggests that the expansion of GVCs facilitated by trade liberalisation and advances in technology has put downward pressure on producer prices, with potential implications for monetary policy. Looking forward, a continuation of the stalling globalisation observed since the crisis poses an upside risk to future inflation. This provides a further reason to resist the rising threat of trade protectionism in the global economy.

In addition, if more intense competition in product and labour markets contributed to global disinflation in over recent decades (Rogoff, 2003), then it follows that waning structural reform ambition (OECD, 2018b) – against the backdrop of strengthening global growth – could lead to inflationary pressures. Given the growing importance of ICT-based activities in the economy, as well as evidence of increasing market power in those industries, policy efforts to adapt anti-trust and pro-competitive market regulations to the digital age will not only bring benefits to long-run productivity growth but will also be desirable from a monetary policy perspective.

References:

Andrews, D.,  P. Gal and W. Witheridge (2018), “A Genie in a Bottle? Globalisation, Competition and Inflation”, OECD Economics Department Working Papers, No. 1462.

Auer, R., C. Borio and A. Filardo (2017), “The globalisation of inflation: The growing importance of global value chains”, BIS Working Papers, No. 602, January.

Calligaris, S., C. Criscuolo and L. Marcolini (2018), “Digital and market transformations”, OECD Science, technology and industry working papers, forthcoming.

De Loecker, J. and J. Eeckhout (2017), “The Rise of Market Power and the Macroeconomic Implications”, NBER Working Papers No. 23687.

* The sample of countries are: Austria, Belgium, Czech Republic, Denmark, Finland, France, Germany, Greece, Italy, Japan, Luxembourg, Latvia, Mexico, Netherlands, Norway, Poland, Portugal, Slovenia, Slovak Republic, Sweden, Switzerland and the United States.