The G20’s Enhanced Structural Reform Agenda: Some progress, but more reforms needed

by Agnès Cavaciuti, Tomasz Kozluk, Dorothée Rouzet, Nicolas Ruiz and William Witheridge, OECD Economics Department

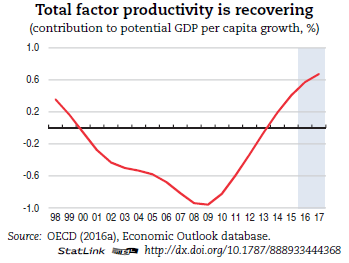
As G20 Finance Ministers and Central Bank Governors meet in Washington, there are signs that the growth prospects for their economies are improving. Recent indicators point to rising business confidence and industrial production in many countries, and fiscal initiatives in major economies are helping to support activity.

A pick-up for the global economy in 2017 would be very welcome after five years of sluggish growth, but we have not yet decisively escaped the low-growth trap. Productivity and wage growth remain weak, and inequality and political uncertainties are high. Financial vulnerabilities and policy risks could derail the recovery. In short, the G20 has yet to achieve its objective of strong, sustainable, balanced and inclusive growth.

In a push to address these challenges, under the Chinese Presidency in 2016 the G20 agreed to an Enhanced Structural Reform Agenda. This comprised G20 priority areas and guiding principles for structural reform, and a system of quantitative indicators to track the evolution of policy settings and outcomes. The OECD was tasked to assess progress and has just delivered the first report under the G20’s Enhanced Structural Reform Agenda to Ministers and Governors. It provides an overview of collective G20 progress and individual notes assessing progress for each G20 member country since the onset of the crisis.

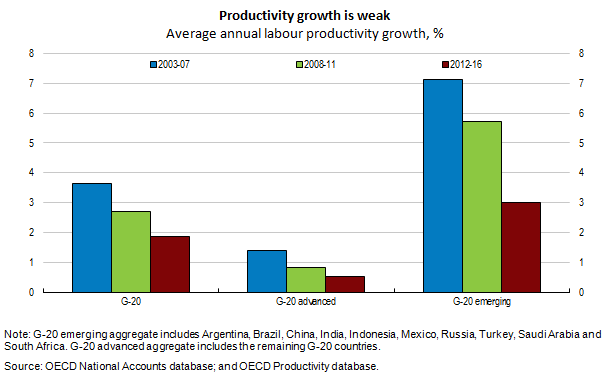
The report shows that the G20 has made progress recently in a number of areas. Emerging economies have undertaken significant reforms to boost productivity by promoting trade and competition, improving infrastructure and encouraging innovation. In advanced economies, policy actions have generally focused on boosting employment and skills after labour markets were hit by the crisis. Employment outcomes are mixed, with the share of people in work having fallen since the crisis in China, India, Japan and the US, but increased in Germany, Indonesia, Turkey and the UK. However, overall productivity performance for the G20 has been disappointing, with labour productivity growth falling significantly since the crisis.
 

20blo

While inequality has been decreasing for the G20 collectively, it has increased within many G20 countries. Poor outcomes and stagnation for people with low and middle incomes, particularly in advanced economies, raise concerns that many are not sharing in the gains from growth. Some progress has been made on environmental sustainability, but G20 countries have yet to act in order to achieve the long-term objectives set out in the Paris agreement.

In addition, we should be concerned about a waning of ambition on structural reform –for example, the OECD’s recent Going for Growth 2017 report shows that the pace of reforms has slowed in recent years. In particular, the G20’s policy actions can be stepped up on promoting trade and investment openness, reforming tax structures and improving public spending efficiency. Much more can also be done to achieve greater inclusiveness through pro-growth structural reforms and reform packages that reduce inequalities.

The specific structural reform priorities under the G20’s Enhanced Structural Reform Agenda differ across countries, but each G20 country can pursue more ambitious policy packages to boost productivity and inclusiveness together. By identifying the areas where progress is needed, this report helps countries to develop and deliver ambitious Growth Strategies for the Hamburg Summit in July. Doing so would help to ensure a strong recovery and put the global economy on a higher and more inclusive growth path.

References

OECD Technical Report on Progress on Structural Reform Under the G-20 Enhanced Structural Reform Agenda, April 2017.

OECD Going for Growth 2017, March 2017.


Reforming Brazil’s old-age pension system to ensure its sustainability

By Jens Arnold, Head of Brazil Desk at the OECD Economics Department and Hervé Boulhol, Head of Pensions and Population Ageing at the OECD’s Directorate for Employment, Labour and Social Affairs

Pensions have been successful in reducing old-age poverty well below the population-wide average, and below the OECD average (Figure 1). At present, all pension recipients – and this includes around 90% of those aged 65 and above – receive at least the minimum wage, which is more than 5 times as much as the poverty line of BRL 170 (equivalent to USD 55).

However, Brazil’s old-age pension system already costs more than 10% of GDP, despite the country’s young – but rapidly ageing – population.  The combined annual shortfall of the pension schemes is close to 4.5% of GDP, contributing substantially to the budget deficit. If the current parameters of the system remain unchanged, spending on pensions for private-sector workers alone would increase by almost 3% of GDP by 2030, and by almost 5% of GDP by 2040. Taking into account the public sector amplifies imbalances, which will make the system financially unsustainable.  An in-depth reform is necessary and inevitable.

Brazil pov by age

Several policy measures could contribute to containing pension expenditures. Raising Brazil’s low average retirement ages of 56 years for men and 53 years for women appears urgent, by introducing a binding minimum retirement age. Many OECD countries are now gradually moving their normal retirement ages beyond 65 years for men and women. In contrast to Brazil’s pension system, all public pension schemes in OECD countries include a minimum retirement age.

Brazil also stands out for high pension benefits relative to working-age incomes, in particular for low-wage earners, paid at low retirement ages (Figure 2). In the OECD, an average-wage full-career worker will get a pension paying 53% of pre-retirement earnings at the age of 65.5 years, compared to 70% for men and 53% for women in Brazil at age 55 and 50, respectively. Moreover, the minimum pension benefit is equal to the minimum wage, which has led to real increases in the minimum pension of almost 90% over the last 10 years. The minimum pension is available after 35 years of contribution or from age 65 after only 15 years of contribution.

Brazil net repla

References

OECD (2017). Pension Reform in Brazil. OECD Policy Memo, Paris: OECD, available at http://www.oecd.org/eco/surveys/reforming-brazil-pension-system-april-2017-oecd-policy-memo.pdf


Mexico’s reforms are paying off, but there is much left to do

By Sean Dougherty, Mabel Gabriel, Patrick Lenain, and Julien Reynaud, OECD Economics Department

The overall economic and social situation has improved in recent years, but important challenges remain, such as high levels of poverty, extensive informality, low female participation rates, insufficient educational achievement, financial exclusion, weak rule of law, and persistent levels of corruption and crime. To address these problems, the government has rolled out major structural reforms since 2012 aimed at improving growth, well-being and income distribution. The initial wave of reforms, kicked-off by the multi-partisan political commitments in the Pacto por México, led to notable progress across a range of areas and put Mexico at the forefront of reformers among OECD countries. Key laws and constitutional amendments were approved, and secondary laws or regulations passed.

blog-reform-mexico

Reforms have already brought short-term benefits, especially on productivity growth, and helped to mitigate exteproductivityrnal headwinds such as lower oil prices and rising US interest rates. The OECD estimated in the last Economic Survey that a subset of the Pacto por México reforms could add one percentage point to GDP growth after five years. An additional set of selected reforms could add another percentage point to GDP. Strong progress has been made to open sectors such as energy and telecoms to more competition. Institutional designs have been improved with a new National Productivity Commission, a strengthened competition authority, and expanded sectoral regulators. Initial progress has been made with education and poverty alleviation, although parts of these plans ran into difficulties that are now being addressed.

growth-disparaties

Nonetheless, large differences prevail across sectors, states, and firms – a situation not unlike that in many OECD countries. Mexico’s most productive firms are performing well, such as in the sector of transportation equipment manufacturing, but the majority of firms are still struggling to perform better, leading to a growing dispersion in productivity,  with a few leading sectors pulling ahead. Inequalities continue to grow across states and sectors, emphasising the divergence of a modern Mexico – highly productive, competing globally, mostly located at the border with the United States, in the central corridor and in tourism areas; and a traditional Mexico, less productive, with small-scale informal firms, mostly located in the South. As a result, growth has not been inclusive enough to achieve better living conditions for many Mexican families.

Addressing this divergence is the main focus of the new Economic Survey (OECD, 2017).

References:

OECD (2017), Economic Surveys of Mexico, OECD Publishing, Paris.

OECD (2015), The Future of Productivity, OECD Publishing, Paris.


Structural reforms can be inclusive; it all depends on the details

By Orsetta Causa,  Mikkel Hermansen and Nicolas Ruiz, Structural Surveillance Division, OECD Economics Department

Structural reforms are regularly assessed based on their ability to boost GDP per capita. This emphasis relies on the assumption that higher GDP per capita is systematically associated with rising living standards for the vast majority of citizens. This view is increasingly being challenged. The worrying evolution of income inequality in many countries suggests that distributional considerations need to be more systematically taken into account in policy making. In a nutshell, what are the policy options for making pro-growth policies inclusive?

New research by Causa et al. (2016) sheds some light on this question by adopting a more granular approach to the evaluation of pro-growth policies. First, the analysis delivers the effect of reforms on household incomes at the bottom, the middle and the top of the distribution. This helps to better understand the distributional implications from pro-growth reforms. In particular, it allows for distinguishing reforms that boost incomes across the whole distribution but relatively more among the rich than among the poor from those that boost incomes in the middle class and among the rich but have no effect or depress incomes among the poor. Second, the analysis considers the channels of macroeconomic growth by decomposing the policy effect into growth in employment and growth in labour productivity. This provides a better understanding of the mechanisms through which policies benefit household incomes at different points of the income distribution.

This new research conveys policy relevant messages for the growth and inequality nexus:

  • Most pro-growth policies are good for the middle class inasmuch as they tend to lift all incomes around the middle of the distribution.
  • By contrast, a number of pro-growth policies that are good for the middle class can in fact hurt the poorest. This is mostly the case of reforms to social protection and labour market policies. In particular, reductions in the generosity of unemployment benefits and social assistance are found to leave poor households behind even when such reforms generate aggregate employment gains. Policy packages can in this case be designed to mitigate trade-offs between raising work incentives and ensuring income adequacy for vulnerable households, that is, through well-targeted job-search assistance and training programmes with a view to raising employability and pay prospects among those with low skills and the long-term unemployed.
  • Other reforms can also have the opposite effects, raising income for everybody but more so for the poor than for the middle class. Such is the case of increasing public spending on education (Chart 1, Panel A), in particular on childcare and early childhood education, as this boosts growth and at the same time enhances women labour market inclusion, resulting in a decline of income inequality.

causa-ssd

Whether pro-growth reforms act via boosting productivity, employment, or both matters: this shapes their distributional implications by compounding their final effects. For example, spurring productivity by easing barriers to firm entry and competition in product markets produces strong macroeconomic gains which accrue to households at large and are fairly equally shared. Yet this reflects two distributionally-offsetting effects: higher labour productivity, which tends to benefit the most affluent households disproportionately, and higher employment, which tends to benefit the less affluent households disproportionately (Chart 1, Panel B).

So, making reforms for inclusive growth is about exploiting synergies, and designing policy packages to mitigate trade-offs. It is thus all about details. At the current juncture there is a crucial need for more growth but also to make it more inclusive. This is not out of reach as countries exhibit large room for packaging structural reforms to target both growth and equity objectives.

References

Causa, O., M. Hermansen and N. Ruiz (2016), “The Distributional Impact of Structural Reforms”, OECD Economics Department Working Papers, No. 1342, OECD Publishing, Paris, http://dx.doi.org/10.1787/5jln041nkpwc-en .


Yes, finance fuels income inequality


by
Boris Cournede,
Senior Economist, Public Economics Division
OECD Economics Department

The Great Financial Crisis has prompted a lively debate, where the financial sector has been accused of not only triggering crises but also concentrating income in the hands of a few. The Occupy Wall Street movement in New York coined the slogan “we are the 99%”, that is to say the bottom 99% in the income distribution. The OECD in Paris has extensively probed the data to examine how finance influences the distribution of income.

The main conclusion is that, indeed, financial expansion exacerbates income inequality. Econometric investigations uncover that more finance, in the form of more bank credit or larger stock markets, goes hand in hand with higher income inequality across OECD economies (see Chart). Further expansion in bank credit from the levels observed in OECD countries is associated with slower household income growth, but the negative effects are particularly acute at the bottom of the distribution, while simulations suggest that the top 10% benefit. Stock market expansion is linked with stronger household income growth, but the benefits are concentrated at the top and the very bottom of the income distribution is simulated to lose out. These effects, which have been identified on average across OECD countries, might not apply at lower levels of development.

The effects of credit and stock market expansion vary a lot across income levels
A. Simulated effect of a 10% of GDP expansion of financial
sector credit on household income growth
credit
 B. Simulated effect of a 10% of GDP expansion of stock market
capitalisation on household income growth
stockmarket
Note: Household income growth is household disposable income growth per capita. Stock market capitalisation is the value of all shares listed in a stock market. The horizontal line indicates the change in household income growth for the economy as a whole.

The estimates suggest the strong expansion of private credit over 1990-2010 contributed 0.8 Gini points to the 3.1 Gini-point widening of household disposable income inequality observed during the period (in the OECD countries for which the data are available). In other words, by growing much faster than GDP, private credit accounted for a quarter of the increase in income inequality: a non-negligible driving force.

OECD empirical work highlights three key mechanisms (while not excluding other ones) behind this link:

  1. Financial sector workers are very concentrated at the top of the income distribution.

Financial sector employees are concentrated high up in the income distribution. In Europe, financial sector employees make up only 4% of the workforce but 20% of the top 1% earners. In Luxembourg and the United Kingdom, more than 30% of employees in the top 1% work for financial firms. The high number of financial sector workers among top earners is justified as long as very high productivity underpins their earnings. However, detailed econometric investigations find that financial firms pay wages well above what employees with similar profiles earn in other sectors. Even worse, the premium is especially large for top earners.

  1. High income earners can and do borrow more.

The distribution of credit is twice as unequal as the distribution of household income in euro area countries (where detailed, internationally comparable data are available). More than 45% of total household credit goes to the top 20% of the income distribution in Austria, Finland, France, Germany and Italy. Credit expansion fuels income inequality, because the well-off gain more than others from the investment opportunities that they can identify.

  1. Much of the benefits of stock market expansion go to affluent households.

Stock holdings are disproportionately concentrated in the hands of high-income people. In the euro area, stock market wealth is four times more unequally distributed than household income. As a consequence, larger stock markets, which generate more dividends and capital gains, widen the income distribution.

As a result, more finance means more income inequality.

Find out more:

Cournède, B., O. Denk and P. Hoeller (2015), “Finance and Inclusive Growth”, OECD Economic Policy Papers, No. 14, OECD Publishing, Paris.

Denk, O. (2015), “Financial Sector Pay and Labour Income Inequality: Evidence from Europe”, OECD Economics Department Working Papers, No. 1225, OECD Publishing, Paris.

Denk, O. and A. Cazenave-Lacroutz (2015), “Household Finance and Income Inequality in the Euro Area”, OECD Economics Department Working Papers, No. 1226, OECD Publishing, Paris.

Denk, O. and B. Cournède (2015), “Finance and Income Inequality in OECD Countries”, OECD Economics Department Working Papers, No. 1224, OECD Publishing, Paris.