Statistical Insights: The ADIMA database on Multinational Enterprises

by Graham Pilgrim, OECD Statistics and Data Directorate

Multinational Enterprises (MNEs) have been at the forefront of changes in the global economy over the last few decades, as trade and investment barriers have been removed and transportation and communication costs have declined. In a world of global value chains, understanding MNEs – where they are, how they operate, and where they pay taxes – has never been more important. However, surprisingly few official statistics are currently available on individual MNEs.
To fill this gap the OECD has begun to develop a new database – the Analytical Database on Individual Multinationals and Affiliates (ADIMA) – using a number of open “big data” sources that can provide new insights on individual MNEs and their global profiles.

What is ADIMA?

ADIMA has four components:

Physical Register: Offering a comprehensive view of each MNE and its subsidiaries.

Digital Register: Showing all websites belonging to each MNE.

Indicators: Providing harmonised data at the global level for each MNE.

Monitor: Identifying events like large company restructurings that can give early warnings of potential significant impacts on trade, GDP and FDI data.

This information already covers 100 of the world’s largest MNEs, and more will be added in future releases.

What does ADIMA tell us on taxes?

At an aggregate level, ADIMA shows that in 2016 the 100 MNEs covered in the the database (ADIMA-100) generated nearly $10 trillion in revenues (almost 20% of global GDP), earned $730 billion in profits and paid $185 billion in taxes. But you can also drill down and get more targeted information. For example, although the average Effective Tax Rate (ETR) of the ADIMA-100 was about 25%, it was significantly lower for MNEs producing computers and electronics, and pharmaceuticals, who have substantial intangible assets that they can locate in lower-tax economies (Figure 1).
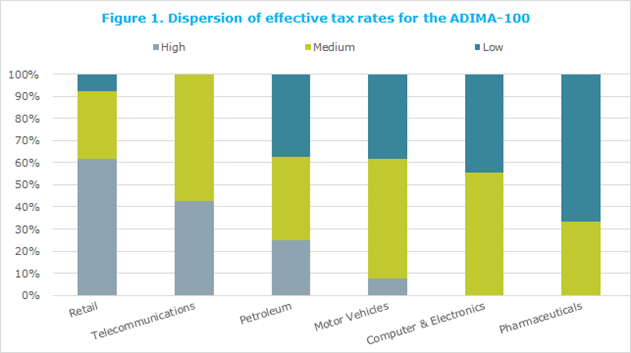
Note: Low refers to ETR values less than 23%, Medium refers to ETR values between 23% and 33%, and High refers to ETR values greater than 33%. These values were chosen so that a third of the ADIMA-100 population was present in each classification.

Where are firms physically located?

The physical register provided by ADIMA describes how MNEs structure their physical operations across countries. Here ADIMA’s innovative tools and variety of data sources go beyond the information typically available in company reports (Figure 2), enabling deeper analysis and a mechanism to help profile firms and their affiliates in national and international statistical business registers. For example, companies’ annual reports show that 74 of the ADIMA-100 have a physical presence in the United Kingdom, with an additional 11 MNEs identified using complementary sources (e.g. Legal Entity Identifier, Website Hyperlink Graphs, Server Security Certificates and WikiData), bringing the number of ADIMA-100 MNEs operating in the United Kingdom up to 85.

What about MNEs’ digital presence?

Physical presence may not reflect digital presence, that is, and in particular for firms whose only penetration into markets is through country-specific websites (i.e. no physical presence). This matters, especially for statistics on highly digitalised MNEs, as the provision of digitised services blurs the traditional line between companies with a foreign presence and those that trade across borders which may affect the comparability of international data on trade and national income.

Digital channels are comparable in scale to physical channels: the ADIMA Digital Register captures 20,000 websites while the ADIMA Physical Register captures 26,000 subsidiaries. In smaller countries the digital presence is often more important: for example, only 10 of the ADIMA-100 are physically present in Estonia but a further 19 mainly “digitalised” companies have an electronic presence (Figure 2).
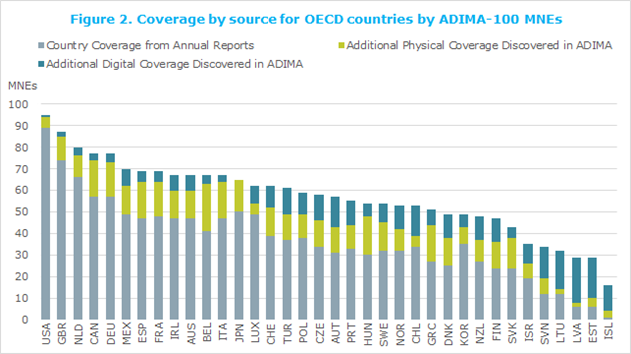
Looking at another interesting example, annual Reports for Alphabet, Google’s parent company, show subsidiaries in two OECD countries but ADIMA’s physical and digital registers record subsidiaries and/or national websites in all OECD countries. For any given domain name, advertising revenue may be recorded as either a domestic or a cross-border transaction. The choice may depend on whether the country-specific site has been legally registered in that country.

Next Steps

The OECD plans to collaborate with interested official statistical agencies to improve both national statistics on MNEs and ADIMA data. The collaborations should also consolidate the tools developed in ADIMA, extend its coverage of MNEs, improve its methods and incorporate new data sources.

The measure explained

The OECD Analytical Database on Individual Multinationals and Affiliates (ADIMA) is a new data framework offering information on both the physical and digital presence of MNEs by country. It combines information from traditional sources such as companies’ Annual Reports with newly emerging sources such as the Legal Entity Identifier, Website Hyperlink Graphs, WikiData, OpenStreetMap and Server Security Certificates.

Where to find the underlying data?

Further reading


Will the inflation genie escape the bottle? New evidence on globalisation, competition and inflation

By Dan Andrews, Peter Gal and William Witheridge, Economics Department

Markets and commentators are speculating that there may be a sustained pick-up in inflation in the United States, after years of subdued price pressures. Along with continued solid US jobs growth and low unemployment, there are tentative signs of higher wage growth and the fiscal stimulus will also boost short-term growth. Global growth is also getting stronger (OECD, 2018a).

As well as these recent developments, longer-term worldwide trends which have kept inflation generally low since the mid-1990s may also be reversing. In particular, globalisation appears to have stalled since the crisis, aggregate demand in strengthening and output gaps have closed or are generally close to zero in most major countries. Moreover, there is mounting evidence of rising market power in services sectors. Together, these trends risk letting the inflation genie out of the bottle.

Declining inflation in many countries over the past few decades at the same time as rising global competition has led to a debate on the importance of globalisation for domestic inflation. Auer, Borio and Filardo (2017) at the BIS have argued that rising GVC integration has accentuated the importance of global factors – particularly global economic slack – for domestic inflation. However, recent research at the ECB (Tagliabracci, Osbat and Koester, forthcoming) and at the US Federal Reserve (Yellen, 2017) has disputed this conjecture.

Figure 1 shows that global value chain (GVC) integration expanded significantly from 1995 until the crisis, while inflation remained relatively subdued. In the post-crisis period, GVCs flattened off and remained around the pre-crisis peak, while producer price inflation has fallen dramatically and remains very low on average across industries for our sample of countries.*

Figure 1

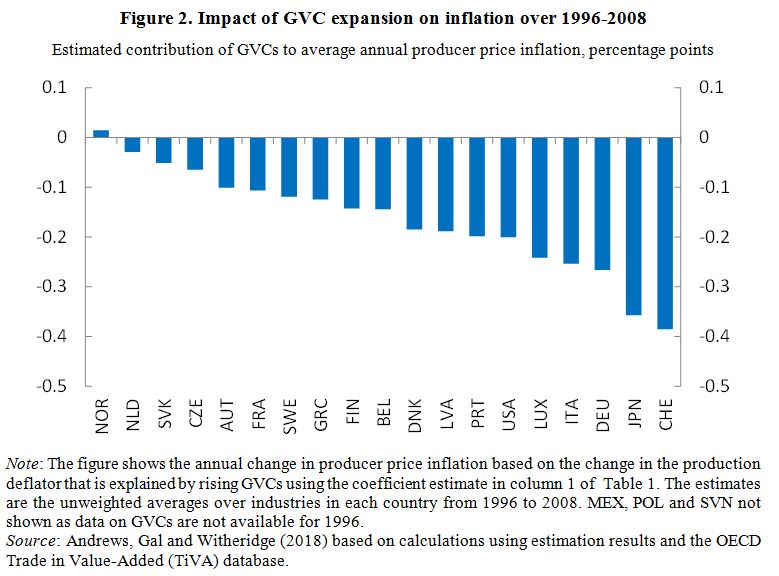
Motivated by this pattern, our new analysis of prices and globalisation (Andrews, Gal and Witheridge, 2018) goes beyond existing research by using recently released cross-country OECD data on prices and GVCs by industry, rather than at the country level, which allow us to control for time-varying country-specific and global shocks. We find that stronger Backward GVC Participation – that is, domestic producers relying more on foreign value added content – is associated with lower producer price inflation at the industry level. For example, we estimate that the rise in GVCs from the mid-1990s up to the crisis reduced annual producer price inflation by 0.15 percentage points on average, but this effect is more than double in some OECD countries (Figure 2).

Figure 2.JPG

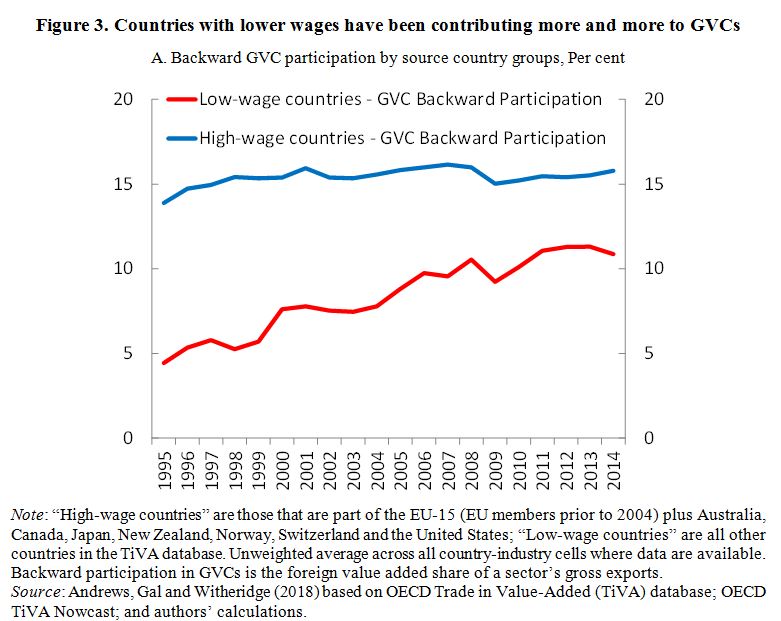
Confirming the existence of a cost-reduction and wage moderation channel, we also show that higher backward GVC participation is associated with lower wages and rising productivity in the importing countries and industries, especially when low-wage countries are integrated in their supply chains. This channel is likely to have contributed to lower inflation in recent years as the structure of the source (i.e. supplying) countries in GVCs has moved increasingly towards low-wage countries (Figure 3), despite a stall in the overall level of GVC integration (Figure 1). Therefore, inflation in advanced economies could remain low if the composition of GVCs continues to shift towards low-wage countries.

Figure 3.JPG

Moreover, we find that a high level of GVC integration can also dampen producer price inflation by accentuating the impact of global economic slack on domestic inflation. This provides new industry-level evidence to support the finding of Auer et al (2017) who use aggregate data covering the pre-crisis period. We show this by using a similar approach combining bilateral industry-level GVC and national output gap data to measure changes in global slack over time.

This implies that weak global demand has a larger disinflationary impact when GVC participation is higher. For example, given our sample of countries facing an average global output gap of -1.5 per cent in 2014, we estimate that annual producer price inflation was on average 0.25 percentage points lower in 2014 than for 1996 GVC levels. This figure is more than 0.5 percentage points, however, for countries that experienced a particularly large rise in GVC participation. But with slowing expansion of GVCs since the crisis, coupled with stronger aggregate demand and output gaps closing in most countries, this could lead to greater inflationary pressures in the medium term.

The third longer-term trend posing an upside risk to inflation is declining competition and market contestability. We exploit harmonised cross-country firm-level data to show an increasing trend in mark-ups, which suggests rising market power in services sectors (Figure 4). This upward trend in mark-ups is consistent with other estimates for the United States (De Loecker and Eeckhout, 2017) and other OECD countries (Calligaris et al, 2018). In turn, in these market services sectors we find a significant positive correlation between producer price inflation and mark-ups within industries since the early 2000s. This leads us to conjecture that if market power continues to rise it may pose a further risk to letting the inflation genie out of the bottle.

Figure 4.JPG
This analysis suggests that the expansion of GVCs facilitated by trade liberalisation and advances in technology has put downward pressure on producer prices, with potential implications for monetary policy. Looking forward, a continuation of the stalling globalisation observed since the crisis poses an upside risk to future inflation. This provides a further reason to resist the rising threat of trade protectionism in the global economy.

In addition, if more intense competition in product and labour markets contributed to global disinflation in over recent decades (Rogoff, 2003), then it follows that waning structural reform ambition (OECD, 2018b) – against the backdrop of strengthening global growth – could lead to inflationary pressures. Given the growing importance of ICT-based activities in the economy, as well as evidence of increasing market power in those industries, policy efforts to adapt anti-trust and pro-competitive market regulations to the digital age will not only bring benefits to long-run productivity growth but will also be desirable from a monetary policy perspective.

References:

Andrews, D.,  P. Gal and W. Witheridge (2018), “A Genie in a Bottle? Globalisation, Competition and Inflation”, OECD Economics Department Working Papers, No. 1462.

Auer, R., C. Borio and A. Filardo (2017), “The globalisation of inflation: The growing importance of global value chains”, BIS Working Papers, No. 602, January.

Calligaris, S., C. Criscuolo and L. Marcolini (2018), “Digital and market transformations”, OECD Science, technology and industry working papers, forthcoming.

De Loecker, J. and J. Eeckhout (2017), “The Rise of Market Power and the Macroeconomic Implications”, NBER Working Papers No. 23687.

* The sample of countries are: Austria, Belgium, Czech Republic, Denmark, Finland, France, Germany, Greece, Italy, Japan, Luxembourg, Latvia, Mexico, Netherlands, Norway, Poland, Portugal, Slovenia, Slovak Republic, Sweden, Switzerland and the United States.


Reaping the benefits of global value chains to rebalance the Turkish economy

By Volker Ziemann, Economist, Turkey Desk, Country Studies Branch, OECD Economics Department

The growing role of global value chains (GVCs) in international production processes is of critical importance for Turkey’s development. Participation in GVCs is one of the key drivers of successful productivity diffusion in a globalised world. Despite major progress, Turkey still lags behind most comparable countries in terms of exported value added per capita.

Backward integration, that is the use of foreign inputs to produce final and intermediate goods exported by Turkish firms, often entails import competition, in particular in manufacturing and services, and accelerates the reallocation of domestic resources towards the most competitive firms. Backward integration also facilitates the diffusion of knowledge either indirectly through learning from suppliers or directly via knowledge spillovers from foreign direct investment.

Forward integration, that is the production of intermediate inputs used in other countries’ exports, increases and diversifies the potential market, leverages the use of Turkey’s human, capital and natural resources, and, as a result, contributes to rebalancing the Turkish economy. Increased production for foreign markets requires convergence of product standards toward international best practices and triggers virtuous feedback loops between productivity, innovation, human capital endowment and living standards.

While Turkey incorporates an increasing share of foreign value added in its own exports (backward participation), its capacity to provide intermediate inputs to other countries’ exports (forward participation) is still limited (see Figure).

Turkey GVC 2016

Source: OECD/WTO (2016), “Trade in value added”, OECD-WTO: Statistics on Trade in Value Added (database). DOI: http://dx.doi.org/10.1787/data-00648-en.

The 2016 OECD Economic Survey of Turkey argues that Turkey’s participation in GVCs remains below potential owing to institutional features that hamper efficient allocation of capital and labour, obstacles inherent in bilateral trade agreements and entry regulations, underdeveloped human capital and insufficient investment in innovation, R&D and knowledge-based capital. The Survey further identifies substantial room for progress in corporate governance and managerial skills, as well as the use of ICT tools in production and management processes.

Progress along these dimensions would make Turkish firms more competitive, strengthen Turkey’s backward and forward trade linkages and contribute to rebalancing growth. The adjustment process towards a more export-oriented economy operating on a level playing field needs to be flanked by dedicated industrial, social and environmental policies to alleviate adverse consequences on displaced firms and workers and the ecosystem.

Find out more:

OECD (2016), OECD Economic Surveys: Turkey 2016, OECD Publishing, Paris.