Building on recent reform progress In Brazil

By Falilou Fall, Priscillia Fialho, and Jens Arnold, OECD Economic Department

Brazil’s economy has recovered strongly from the consecutive shocks of the last years says the latest OECD Economic Survey of Brazil. This year, buoyed by good weather and a record-high harvest, the economy is expected to grow at 3%, which is far above its long-term growth trend over the last decade. Unemployment is at its lowest level since 2015, while inflation has returned to the central bank’s target after having risen to almost 12% in mid-2022. Even if in the next years growth will fall short of the exceptional performance of 2023, the current OECD projections of 1.8% in 2024 and 2.0% in 2025 are strong in historical comparison, and are largely driven by expanding domestic demand.

The time has now come to re-focus on the pressing structural challenges that Brazil is facing. These include limited fiscal capacity that hampers necessary investments, weak productivity performance, and the need to end deforestation in the Amazon, after visible increases during 2018-2022.

Building fiscal space will help to focus on policy priorities

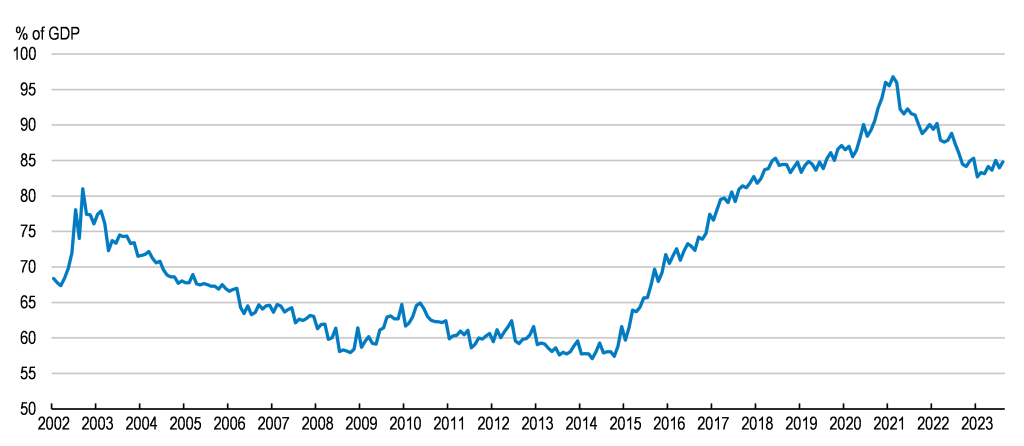
With gross public debt exceeding 80% of GDP (Figure 1), rebuilding fiscal buffers is important to ensure that the public sector can undertake the necessary investments in education, social protection and infrastructure in the future. This will require credible deficit targets that guide fiscal policy over the next years. A recently legislated new fiscal framework is expected to become an essential tool in this context, as it combines a clear path for fiscal outcomes with safeguards for public investment, which has all too often fallen victim to fiscal adjustments in the past.

Figure 1. Rebuilding fiscal space is important
Evolution of public debt
Source: CEIC; Central Bank of Brazil.

Making the most out of scarce fiscal space will also require more agile budgeting processes. These are currently characterised by widespread revenue earmarking and mandatory spending floors that commit 91% of the budget. This limits the government’s ability to address priority policy challenges.

Further important fiscal reforms are either ongoing or planned. A fundamental overhaul of Brazil’s notoriously complex system of consumption taxes has just been approved by Congress. Moving from a fragmented system of consumption taxes towards a unified value-added tax system will make tax compliance much easier for firms and reduce a number of tax-induced distortions that hold back growth. Beyond consumption taxes, there is scope to reform personal income taxes, including with a view towards making them more progressive.

Raising productivity and growth inclusiveness

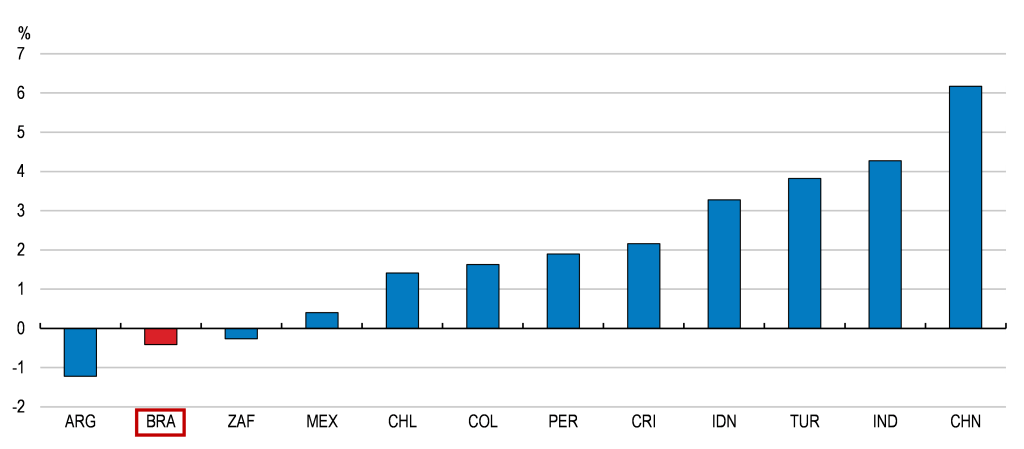
Productivity has been on a declining trend since 2010, and compared to other emerging market economies, Brazil’s per capita growth has been substantially weaker (Figure 2). This is particularly worrying in light of rapid population ageing. A young population has underpinned economic growth in the past, as more and more people were joining the labour force. Over the next 25 years, however, population ageing  is expected to reverse the entire growth dividend that Brazil has reaped from more favourable demographics since the turn of the millenium.

Figure 2. Weak productivity performance and infrastructure competitiveness are impeding stronger growth
Average annual GDP per capita growth, 2012-2021
Source: World Bank; and OECD calculations.

Years of insufficient infrastructure investment have given rise to logistics bottlenecks and high transportation costs, which are one factor behind Brazil’s weak productivity performance. But scarce resources are not the only challenge. Improvements in planning and project execution could substantially improve the performance of many infrastructure projects. As a result of challenges in project management, public infrastructure investment has delivered results that have often fallen short of expectations. 

Competition, another key driver of productivity growth, has been held back by complex regulations and administrative burdens, some of which shield incumbent firms from potential new market entrants. Recent regulatory reforms have led to improvements in this area, but market entry barriers in services sectors remain above the OECD average. Further regulatory reforms in professional services, including the abolition of exclusive rights for certain ancillary tasks, can stimulate competition in crucial markets. Manufactured goods remain subject to elevated trade barriers, with average import tariffs approximately eight times higher than in Mexico. Lowering these trade barriers can facilitate access to foreign markets and foster a deeper integration into global value chains.

Mobilising currently underutilised labour resources and improving education outcomes is equally essential for sustaining stronger long-term economic growth. Womens’ labour force participation and employment rates lag approximately 20 percentage points behind those of men. The pandemic has exacerbated educational disparities by leaving a stronger mark on children from disadvantaged backgrounds. Prioritising investments in the early years of schooling and expanding access to early childhood education, especially for children from disadvantaged backgrounds, have the potential to reduce gender inequality and equip children with better opportunities later in life.

Making growth more sustainable

Deforestation, the largest contributor to greenhouse gas emissions, has increased since 2018, but policy priorities have changed and early indicators now suggest a decline in 2023. Strengthening enforcement of the Forest Code, coupled with allocating more resources to enforcement agencies, will aid in tackling deforestation. Emissions from agriculture, the second-largest source of greenhouse gas emissions, primarily arise from livestock (Figure 3). Better regulations and stronger incentives for more sustainable production hold significant potential for reducing these emissions. Energy emissions are already fairly low given the significant share of hydroelectric energy sources, but also solar and wind energy, where Brazil’s still untapped potential could turn into a major competitive advantage in the future. The planned introduction of carbon pricing mechanisms will be a milestone in the transition towards a lower-carbon economy.

Figure 3. Deforestation and agriculture are the main sources of greenhouse gas emissions
Million tonnes of CO2 equivalent, 2021 or latest

Source: OECD environment database; Estimativas Anuais de Emissões de Gases de Efeito Estuda no Brasil (6ª Edição), Ministério da Ciência, Tecnologia e Inovação; and OECD calculations.

References

OECD (2023), OECD Economic Surveys: Brazil 2023, OECD Publishing, Paris, https://doi.org/10.1787/a2d6acac-en


Do central bank losses matter?

coins with downward arrow

By Nobukazu Ono and Álvaro Pina, OECD Economics Department

After recording sizeable gains from quantitative easing (QE) over most of the past decade, several central banks have recently reported financial losses. Further losses are likely in the coming years. As discussed in the latest OECD Economic Outlook (OECD, 2023), these losses have long been anticipated, as past gains and current losses are two sides of the same coin. This is also the case for the adverse impact of losses on the public finances, which comes after several years of significant central bank remittances to Treasuries. Nonetheless, losses and the potential need for recapitalisation from the government can still undermine the credibility and perceived independence of central banks. This calls for transparency and clear communication in the presentation of losses.

Why are central banks making losses?

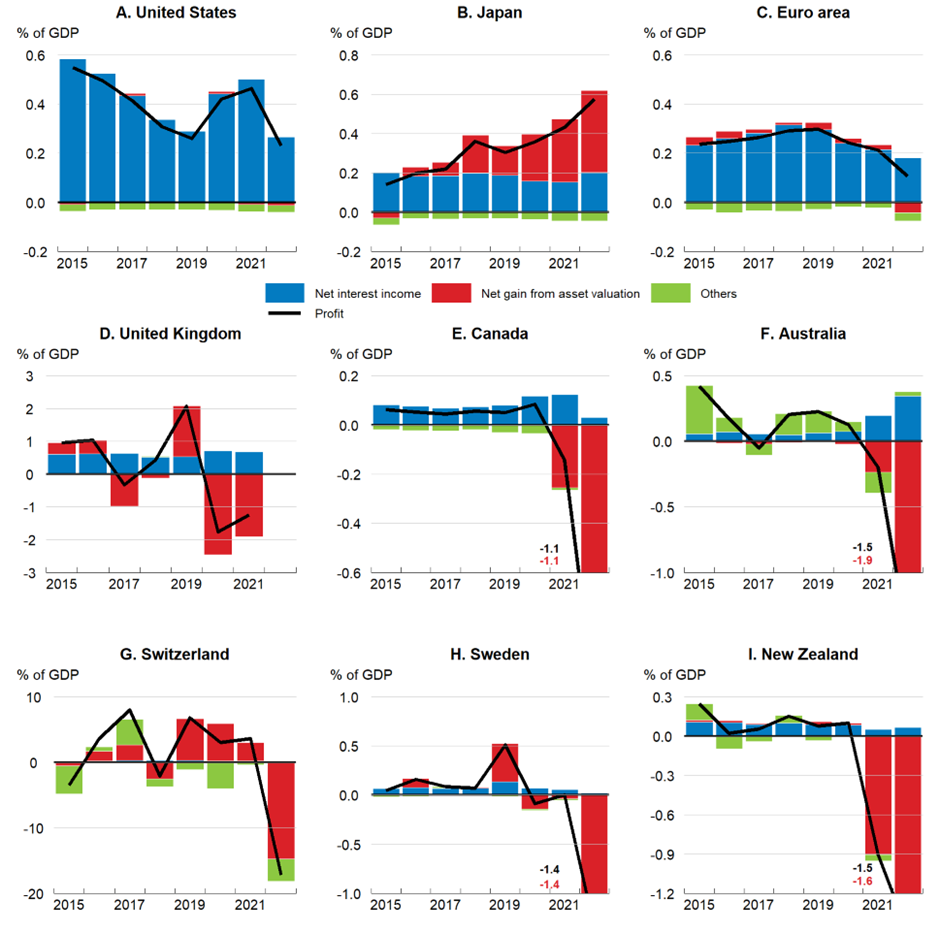
Losses largely reflect the large balance sheets built up during an extended period of QE and the effects of the recent rises in policy interest rates. QE created a sizeable mismatch in the maturity of central bank assets and liabilities. On the liability side, central bank reserves (mainly commercial bank deposits) rose sharply. The remuneration on these is closely linked to policy interest rates, and has thus risen rapidly, to the benefit of commercial banks. In contrast, on the asset side, QE purchases were mostly long-term fixed-rate bonds that generate a relatively stable stream of income. When policy interest rates were at or close to the zero lower bound, the balance of these two sets of payments generated gains for central banks. Even as policy rates were raised through 2022, their impact on whole-year net interest income was still relatively mild (Figure 1), especially where most rate increases took place towards the end of the year, as in the euro area. However, larger impacts are likely in 2023 and 2024 (Anderson et al., 2022; De Nederlandsche Bank, 2022).  

Higher interest rates also reduce the market value of securities. Valuation losses may thus arise, though this depends on the accounting frameworks and asset sales decisions of central banks. For instance, the Federal Reserve and the Bank of Japan account for securities held for monetary policy purposes using amortised cost. This means that valuation changes do not affect profits unless securities are sold, which has not been the case so far. Eurosystem accounting guidelines, also followed by Sweden, allow central banks to value securities held for monetary policy purposes at either amortised cost or the current market price. While euro area national central banks have generally opted to use amortised cost, the Riksbank has adopted market pricing, making a significant loss apparent in 2022. Mark-to-market accounting brings forward loss recognition, as also illustrated by Australia, Canada, New Zealand, Switzerland and the United Kingdom. In Switzerland, the central bank loss was unusually large in 2022, at 17 per cent of GDP, but these losses stemmed largely from changes in the domestic currency value of foreign exchange reserves, including foreign securities.

 Do losses hamper fiscal or monetary policy?

Central bank losses affect the public finances by reducing or ending central bank payments to the Treasury in the form of income taxes or remittances. Moreover, reverse cash flows (i.e., payments from the Treasury) may occur if central banks are entitled to be compensated by the government for certain losses, such as QE-related losses. For instance, in the United Kingdom, the Bank of England Asset Purchase Facility (APF), through which QE asset purchases were conducted, is fully indemnified by the Treasury.

The annual impact on the general government fiscal balance should in general be modest: over 2015-21, revenues from the central banks considered in Figure 1 rarely exceeded, and were often far below, 0.5% of GDP per year. However, even if small, the negative effect on fiscal balances could be protracted, as losses may persist for several years. Even after the central bank returns to profit, some time may elapse before remittances to the Treasury resume.

Central bank losses are not an indication of a policy error and need not hamper the effectiveness of monetary and financial policies. The policy mandates of central banks include price stability and financial stability, but not profit maximisation. Their current losses, as well as their earlier gains from QE, are a by-product of policy actions designed to help achieve their mandates. Moreover, central banks are not subject to capital adequacy requirements or bankruptcy procedures and can operate effectively even with negative equity, as the central banks of Chile, the Czech Republic, Israel and Mexico have done over several years (Bell et al., 2023).

However, losses or negative equity can pose communication challenges. For instance, some policy decisions, such as retaining rather than selling government bonds, could be misinterpreted as being motivated by a desire to contain losses rather than as actions to pursue specific policy mandates. This would reduce central bank credibility. Likewise, financial flows from government, including actions to strengthen central bank capital positions, could be misperceived as being inconsistent with central bank independence. This underscores the importance of clear communication about the reasons for losses and of a transparent framework for financial flows between the central bank and the government.

Figure 1: Several central banks now report negative profits

Note: Accounting approaches and financial years differ across countries and data should therefore be compared with caution. ‘Net gain from asset valuation’ includes realised gains/losses and, in some countries, unrealised ones. For the euro area, the chart shows the consolidated result of national central banks. The euro area figure for 2022 is based on the 17 member banks who had published results by 29 June 2023. For the United Kingdom, the chart shows the consolidated result of the Bank of England and the Asset Purchase Facility. See Box 1.3 in OECD (2023) for further details.
Source: Board of Governors of the Federal Reserve System; Bank of Japan; national central banks in the euro area; Bank of England; Bank of Canada; Reserve Bank of Australia; Swiss National Bank; Sveriges Riksbank; Reserve Bank of New Zealand; OECD Quarterly National Accounts database; and OECD calculations.

References

Anderson, A., P. Marks, D. Na, B. Schlusche, and Z. Senyuz (2022), “An Analysis of the Interest Rate Risk of the Federal Reserve’s Balance Sheet, Part 2: Projections under Alternative Interest Rate Paths,” FEDS Notes, Washington; Board of Governors of the Federal Reserve System, 15 July, https://doi.org/10.17016/2380-7172.3174.

Bell, S., M. Chui, T. Gomes, P. Moser-Boehm, and A. P. Tejada (2023), “Why are Central Banks Reporting Losses? Does it Matter?,” BIS Bulletin No 68, February, https://www.bis.org/publ/bisbull68.pdf.

De Nederlandsche Bank (2022), “Letter regarding DNB’s capital position – September 2022,” 9 September, https://www.dnb.nl/media/p4igu5fc/letter-regarding-dnb-s-capital-position-september-2022.pdf.

OECD (2023), OECD Economic Outlook, Volume 2023 Issue 1, OECD Publishing, Paris, https://doi.org/10.1787/ce188438-en.


Employment in Sweden: aiming high

Image from the 2023 Economic Survey of Sweden cover

by Hyunjeong Hwang, OECD Economics Department

Cover of the economic survey of Sweden 2023

Sweden has a very high labour force participation rate and one of the highest employment rates in the OECD, but cannot afford to be complacent. Maintaining high employment is a prerequisite for the sustainability of the Swedish welfare state and to counter the ageing-related contraction of the labour force and its negative fiscal impacts. The 2023 OECD Economic Survey of Sweden delves into some challenges holding back labour supply and proposes measures to make the Swedish labour market stronger, more inclusive, and conducive to sustained economic growth.

Long-term unemployment, notably among the foreign-born, remains a significant challenge. With lower educational attainment and lower Swedish language skills than natives, foreign-born people may struggle to get a job in a labour market characterised by a compressed wage distribution that demands high skills and productivity. Additionally, foreign-born women often face strong gender and family norms. Re-skilling and activation policies are key for these groups. A recent reform of the Public Employment Service, introducing a purchaser-provider model with outcome-based payments for employment services could help, but needs to be carefully monitored and calibrated to align providers’ incentives with the objectives of the reform and to secure sufficient competition. Carefully reviewing social assistance with the aim to strengthen work incentives while ensuring decent living standards for people in need could also help.

Taxes on work are high, particularly among above-average income earners in Sweden (Figure 1). The top personal income tax rate is among the highest in the OECD and it applies from a low threshold. As a result, a relatively large share of taxpayers faces the top marginal tax rate. Meanwhile, tax rates on dividends and capital gains are relatively low. The large difference between taxes on labour income and capital income creates incentives for high-wage earners to reclassify their income as capital income in order to minimise their tax obligations. Furthermore, housing taxation is both low and regressive. Shifting taxation away from labour and towards property and capital income would thus help create a more balanced and equitable tax structure, promoting labour supply and inclusive growth while preserving fiscal sustainability.

Lengthening working lives as life expectancy increases is essential to strengthen public finances and to ensure sufficient pension income. Reforms in the 1990s made Sweden’s pension system the envy of countries around the world, with in-built sustainability and incentives to lengthen working lives, and many policies have been put in place since to extend working lives. However, recent reforms to boost basic pensions and to introduce a new tax-funded income pension supplement go in the direction of reducing incentives to remain in work for many older workers and weaken the long-term sustainability of the system. The stated purpose of these changes was “to ensure a reasonable standard of living for pensioners who receive a low level of earnings-related pensions”. However, on average, Swedish pensioners are relatively well-off compared internationally and compared to younger generations in Sweden. Sweden should therefore change direction by holding back the uprating of tax-funded pensions for some time to come.

Relaxing strict rent controls, which would improve labour mobility and increase the supply of rental dwellings, should be considered. Waiting times for rental housing can stretch from years to decades in major cities in Sweden, perpetuating the scarcity of rental options. This pushes those with limited queuing time and limited means to buy housing, particularly youth and immigrants, into overcrowded housing, sublet or black markets with significantly higher rents. Greater flexibility in rental housing would facilitate the matching of skills with job vacancies and boost productivity by more efficiently allocating talent to where it is most needed.

Further reading:          

OECD Economic Survey of Sweden (2023), OECD Economic Surveys: Sweden 2023, OECD Publishing, Paris.


Canada: five messages from the latest OECD Economic Survey

By Ben Conigrave and Philip Hemmings, OECD Economics Department

Canada’s economy has proved resilient to testing global conditions in the wake of Russia’s invasion of Ukraine. Amid a strong post-pandemic recovery in output and revenues, the federal government stepped up action to improve housing affordability and expand access to low-cost childcare. While Canada’s recent social policy progress is impressive, a major reform challenge remains – to lift tepid growth in productivity and average incomes while also eliminating net greenhouse gas emissions by 2050. Projected economic growth of 1.3% in 2023 and 1.5% in 2024, while avoiding recession, would not close gaps in living standards to better-performing economies. The latest Economic Survey of Canada sets out recommendations aimed at boosting Canada’s growth potential and driving down carbon emissions.

Inflation has fallen from peak levels but is still above target. The main drivers of last year’s surge in consumer prices have abated. Energy price falls and easing tensions in world supply chains have helped reduce headline inflation. Higher borrowing costs have also started to cool domestic demand after a series of large interest rate rises by the Bank of Canada. Still, underlying price pressures remain elevated. Labour market conditions are tight, with the jobless rate near record lows and workers demanding larger-than-usual wage increases. Policymakers face the tricky task of returning inflation to target without creating an economic downturn.

Figure 1. Inflation has passed its peak but remains high

Headline consumer prices, annual increase, %

Note: The Bank of Canada aims to keep inflation close to the 2% midpoint of a control range from 1 to 3% over the medium term.
Source: OECD (2022), Main Economic Indicators (database).

Living cost pressures have increased. High inflation has eroded real incomes and is weighing on consumer spending. Governments have stepped in to ease the cost of living. Some measures rightly target support to vulnerable households. For instance, the federal government has temporarily increased goods and services tax (GST) credit payments aimed at those on lower incomes. In contrast, provinces have in some cases introduced across-the-board subsidies to reduce utility bills or cut fuel taxes. Untargeted measures of this sort can be costly, fail to focus support on under-pressure households, and weaken incentives to save energy. A major federal-provincial initiative separately promises to improve access to cheap childcare. Properly implemented, the scheme should help lift employment, particularly among women, supporting higher living standards. At the same time, significant socio-economic gaps still separate Indigenous people and the rest of Canada’s population. Support for Indigenous self-determination needs to continue as part of efforts to close these gaps.

Budget repair has been faster than expected. Commodity export price rises contributed to revenue growth in a high-inflation environment just as pandemic support was ending. Deficits and debt burdens have shrunk despite the federal government extending living-cost relief and launching new programmes to improve the affordability of housing and childcare. But as multi-year spending commitments mount, and revenue tailwinds die down, governments will find it harder to sustain budget improvements. Better spending efficiency could reduce long-term fiscal challenges. Tax system reform will also be important, both for fiscal sustainability and unlocking higher potential output. Shifting the tax mix towards greater use of indirect taxes, and less use of distortive taxes on income, would reduce drags on Canada’s productive capacity. Windfall gains from high commodity prices in 2022 also serve as a fresh reminder of the need for provinces to make more use of stabilisation funds to mitigate boom and bust cycles in their budgets.

Figure 2. The public debt burden is decreasing

Public debt, % of GDP

Note: Data for 2022 are estimates. Gross debt includes general government liabilities in the form of currency and deposits; debt securities, loans; insurance, pensions and standardised guarantee schemes, and other accounts payable. Net debt subtracts financial assets from gross debt.
Source: OECD Economic Outlook 112 (database).

More policy focus is needed on productivity-enhancing reform. Population increase, underpinned by high levels of immigration, will continue to be an important driver of growth in Canada’s economy in the years ahead. But long-term improvement in living standards will require higher productivity. Lacklustre productivity growth since 2015 saw gaps in per capita GDP widen between Canada and better-performing economies, including the United States. Reversing this trend, which coincided with weak business investment after the 2014 oil price collapse, demands reform efforts equal to those behind recent social policy advances. Removing barriers to trade between provinces would improve the business environment. Regulations and technical standards impede flows of goods and services across Canada’s internal borders as well as the performance of regional labour markets. Separately, stringent foreign ownership limits in network sectors – including telecommunications – directly restrict foreign direct investment. The rules should be reviewed.

Figure 3. Canada’s investment performance can be improved

Real private non-residential investment

Source: OECD Economic Outlook database.

Strong incentives are needed to decarbonise production. Canada’s resource-intensive economy uses more energy and generates more greenhouse gas emissions per person than most other OECD countries. An ambitious federal government plan aims to change this. Deploying regulations, market-based tools and support for green investment, the government has committed to eliminate Canada’s net emissions by 2050. As well as energy saving in businesses and homes, achieving this goal will require replacement of fossil fuels with clean energy across the economy. For policymakers, the task will be to minimise drags on activity from sometimes overlapping mitigation tools. Higher carbon prices levied uniformly on a larger share of emissions will help ensure an efficient green transition. Canada’s federal and provincial governments must work together to strengthen incentives for low-cost mitigation across key sectors – including electricity, oil and gas, transport and buildings – and prepare communities for fast-changing climates.

Figure 4. Canada’s emission reduction challenge is large

GHG emissions

Note: The solid blue line shows historical GHG emissions. The dotted line shows the emissions reductions required to meet 2030 and 2050 targets along an indicative pathway. The green line shows emissions projections by Environment and Climate Change Canada.
Source: Calculations based on OECD (2022), Environment Statistics (database); Climate Action Tracker; and Environment and Climate Change Canada.

References:

OECD (2023), OECD Economic Surveys: Canada 2023, OECD Publishing, Paris. https://doi.org/10.1787/7eb16f83-en


Addressing medium-term fiscal challenges to address future shocks in Belgium

By Müge Adalet McGowan and Nicolas Gonne, OECD Economics Department

The large-scale support to mitigate the economic and social impact of the pandemic put additional strain on government finances in Belgium, as in other OECD countries. The temporary measures against increasing energy prices and the automatic indexation of public wages and social benefits to inflation will weigh further on public finances in the near term. The additional defence spending and the inflow of Ukrainian refugees arising from the war will also increase costs.

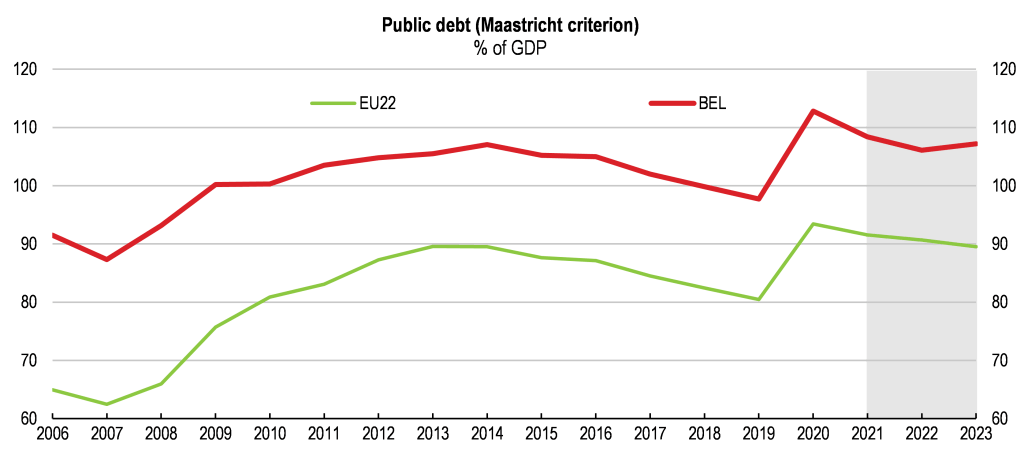
The new Economic Survey of Belgium shows that with unchanged policies, Belgium’s high debt-to-GDP ratio, which is high at 108.4% in 2021 (Figure 1), is not expected to stabilise in the medium term. Fiscal challenges will be exacerbated by population ageing: total ageing costs (health, long-term care and pensions) will rise by 5.7% to 25.8% of GDP by 2070. Hence, a credible and transparent fiscal consolidation strategy to lower the budget deficit and to ensure a steady reduction of the debt-to-GDP ratio, including every level of government, is needed.

Figure 1. The crisis exacerbated fiscal challenges

Source: OECD Economic Outlook: Statistics and Projections (database).

The 2022 OECD Economic Survey of Belgium highlights four areas to improve medium-term fiscal sustainability:

  • Increasing public spending efficiency through spending reviews: Public spending at 55% of GDP in 2022 is among the highest in the OECD and there is room to improve spending efficiency in some areas (e.g. education). Federal and regional spending reviews are starting to be used, and the national recovery plan includes a commitment to better integrate them into the annual budget process. Better coherence and consistency in methodology and objectives across different levels of government should be ensured to link spending reviews to the medium-term expenditure frameworks to gradually bring down public expenditures.
  • Improving the fiscal framework and rules: Budgetary coordination between the different government levels is not effective. The cooperation agreement of December 2013, which aimed at ensuring the budgetary coordination of all levels of government, has not been fully implemented in practice. The lack of endorsement of the budgetary targets proposed by the High Council of Finance by the federal, regional and community governments prevents the High Council from fulfilling its mandate of monitoring outcomes and the use of a credible multi-annual budget planning. The introduction of medium-term budgetary planning and expenditure rules for all levels of government can increase transparency and consistency of fiscal policy and support medium-term expenditure reforms. Strengthening the mandate of the High Council of Finance to provide transparent, uniform and highly visible in-depth analysis and monitoring of public finances at different levels of government, even if it cannot impose binding targets or recommendations, can also help.
  • Implementing the planned tax reform: High labour taxes discourage more people from working or looking for a job. While previous tax reforms reduced the tax burden on labour for the lowest income earners, they remain above the OECD average. The planned tax reform should broaden tax bases and reform capital taxation to lower misallocation of capital. Given fiscal sustainability challenges, it is important to ensure that the labour tax reduction for low-wage workers is fully financed.
  • Implementing pension reforms: Pension expenditures are projected to increase from 12.2% to 15.2% of GDP by 2070, and the effective retirement age remains low at 60.5 (Figure 2). There is a need to upskill older workers, whose participation in lifelong learning is relatively low, to lengthen their working lives. Increased access to information and guidance regarding training are key. Introducing penalties and bonuses for those retiring before and after the statutory retirement age could strengthen the links between working careers and pensions in the early retirement system and encourage a rise in the effective age of exit from the labour market.

Figure 2. The effective retirement age is low

Note: The average effective age of retirement is defined as the average age of exit from the labour force during a 5-year period, while the statutory age is defined as the age of eligibility of all schemes combined, based on a full career after labour market entry at age 22.
Source: OECD (2021), Pensions at a Glance.

References

OECD (2022), OECD Economic Surveys: Belgium 2022, OECD Publishing, Paris, https://doi.org/10.1787/01c0a8f0-en


Long-run fiscal challenges dwarf COVID’s fiscal legacy

By Yvan Guillemette, OECD Economics Department

The decline in economic activity associated with caution, lockdowns and other restrictions in response to the COVID-19 pandemic brought government revenue down substantially in 2020 across the OECD. Governments have appropriately responded with a range of temporary programmes to support workers and businesses, simultaneously raising expenditure. Consequently, fiscal positions have deteriorated sharply and gross government debt in the OECD is projected to be around 20-25 percentage points of GDP higher in 2022 than it would have been absent the pandemic.

The immediate fiscal challenge for governments is to continue to target fiscal support towards sectors hardest hit by the COVID-19 shock and, as the pandemic ebbs, to phase out temporary programmes gradually along with the restrictions that limit doing business in these sectors. In the longer run, however, the direct fiscal impact of the pandemic pales in comparison to additional fiscal pressures stemming from secular trends, such as population ageing and the rising relative price of services.

In the latest long-run projections from the OECD Economics Department, these fiscal pressures are assessed using stylised projections that take secular trends, such as demographics, into account. The idea is not to obtain precise forecasts, but rather rough orders of magnitude to size up the fiscal challenge ahead. Under a ‘business-as-usual’ hypothesis, in which no major reforms to government programmes are undertaken:

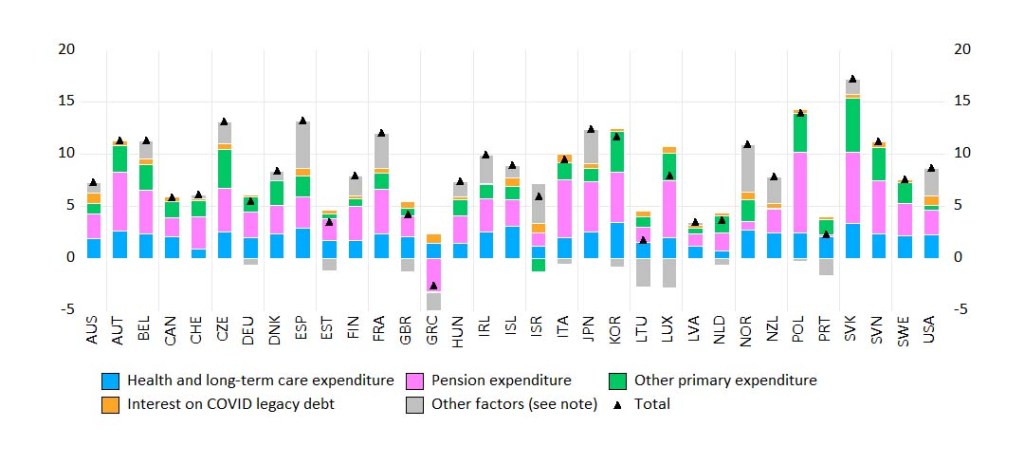
  • Public health and long-term care expenditure is projected to increase by 2.2 percentage points of GDP in the median country between 2021 and 2060 (see figure). These projections are based on a pre-pandemic health and long-term care spending baseline, so any permanent increase in health spending in response to experience with COVID-19 (for instance to build more spare capacity in intensive care units or raise pay levels for workers in public care homes) would come in addition.
  • Public pension expenditure is projected to increase by 2.8 percentage points of GDP in the median country between 2021 and 2060, but cross-country variability is much higher than in the case of health expenditure projections. Countries that have legislated increases in statutory retirement ages, and especially those that have linked future increases to gains in life expectancy — such as Estonia, the Netherlands and Portugal — tend to have lower projected increases in public pension expenditure, whereas countries with particularly unfavourable demographics — such as Japan, Korea and Poland — tend to have higher projected spending increases.
  • Other primary expenditures are projected to rise by 1½ percentage points of GDP in the median country between 2021 and 2060. And this figure excludes important sources of expenditure pressure, such as climate change adaptation.
  • In contrast to the fiscal pressures from the secular trends discussed above, the additional debt service on the increase in public debt due to the COVID-19 pandemic – here approximated by the increase in gross government debt between 2019 and 2022 – adds only about ½ percentage point of GDP to long-run fiscal pressure in the median country. Emergency fiscal transfers during the COVID period contribute little to long-run fiscal pressure because they are temporary. Their permanent component is the flow of interest payments on the associated stock of additional debt, assuming that it is permanently rolled over, which is the case here because of the assumption that the government debt-to-GDP ratio is stabilised at its 2022 level.

Potential future fiscal pressure to keep public debt ratio at current level in the baseline scenario

Change in fiscal pressure between 2021 and 2060, % pts of potential GDP

Note: The chart shows how the ratio of structural primary revenue to GDP must evolve between 2021 and 2060 to keep the gross debt-to-GDP ratio stable near its current value over the projection period (which also implies a stable net debt-to-GDP ratio given the assumption that government financial assets remain stable as a share of GDP). The underlying projected growth rates, interest rates, etc., are from the baseline long-term scenario presented in Guillemette and Turner (2021). Expenditure on temporary support programmes related to the COVID-19 pandemic is assumed to taper off quickly. The necessary change in structural primary revenue is decomposed into specific spending categories. The component ‘Interest on COVID legacy debt” approximates the permanent increase in interest payments due to the COVID-related increase in public debt between 2019 and 2022. The component ‘Other factors’ captures anything that affects debt dynamics other than the explicit expenditure components (it mostly reflects the correction of any disequilibrium between the initial structural primary balance and the one that would stabilise the debt ratio).

Except in Greece, where a massive fiscal consolidation effort has already taken place since the Great Recession, all OECD governments would need to undertake fiscal consolidation in this scenario, which is premised on the idea that fiscal authorities would seek to stabilise public debt ratios at projected 2022 levels by adjusting structural primary revenue from 2023 onward. The median country would need to increase structural primary revenue by nearly 8 percentage points of GDP between 2021 and 2060, but the effort would exceed 10 percentage points in 11 countries. These results do not imply that taxes will, or even should, rise in the future. The fiscal pressure indicator is simply a metric serving to quantify and illustrate the fiscal challenge facing OECD governments. Raising taxes is only one of many possible avenues to meet this challenge.

If financing conditions remain favourable, as assumed in the baseline scenario, countries with relatively low initial public debt ratios could finance some of the projected increases in expenditure with debt. With higher public debt would come risks, however. For this reasons, absorbing future fiscal pressure with additional borrowing is a strategy that could postpone, but probably not avoid, the need for policy reforms.

Another avenue would be reforming health and pension systems to increase efficiency and prevent expenditure from rising as much as projected in this stylised exercise. In addition, structural reforms that raise employment rates are associated with substantial fiscal dividends. In the context of slowing global population growth and even declining population in many countries, labour market reforms that would raise employment and encourage longer working lives appear particularly desirable. In addition to reducing fiscal pressure, such reforms align well with the goal of helping women and disadvantaged groups gain employment. As the report demonstrates, combining labour market policy reforms with increases in average effective retirement ages could halve the projected increase in fiscal pressure in the median OECD country through 2060 (of nearly 8 percentage points of GDP).

Reference

Guillemette, Y. and D. Turner (2021), “The long game: Fiscal outlooks to 2060 underline need for structural reform”, OECD Economic Policy Papers, No. 29, OECD Publishing, Paris, https://doi.org/10.1787/a112307e-en.


How do you improve the durability of a Celtic Tiger?

By Ben Westmore and Yosuke Jin, Ireland Desk, Economics Department

The Irish economy is booming and is expected to continue expanding at healthy rates over the next few years. But as the 2018 OECD Economic Survey of Ireland highlights, the outlook is clouded with uncertainty.

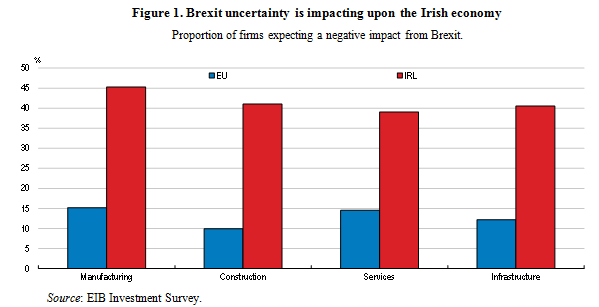
Brexit could have serious implications for the Irish economy given the close economic relationship between Ireland and the UK (Figure 1). New OECD estimates suggest that a trade arrangement between the UK and EU governed by the World Trade Organisation’s Most-Favoured Nation Rules would reduce total Irish exports by 20% in some sectors such as agriculture and food.

Ireland 2018 Brexit1

In addition to Brexit risks, rising international tax competition is a concern for Ireland. The Irish economy has been highly successful at attracting foreign direct investment, with foreign-owned firms accounting for close to half the country’s gross value added over recent years. As a result, reductions in effective corporate tax rates in other countries may have a negative impact on the Irish economy if they encourage some multinational firms to relocate their operations elsewhere.

In this context, the importance of raising the resilience of the Irish economy cannot be overstated.

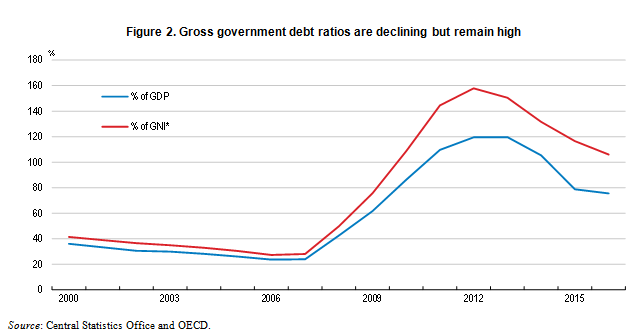
Public finances have improved noticeably, but government debt remains high and tax receipts have become more subject to volatility (Figure 2). Further reducing public debt would create scope for budgetary policy to support the economy in the event of a negative shock – such as a disorderly Brexit. This could be achieved by broadening the tax base in a growth-friendly way. For example, VAT preferential rates and exemptions should be phased out and the property tax yield raised through more regular revaluations of the tax base.

Ireland 2018 Brexit2

Financial sector vulnerabilities also need to be further addressed. While non-performing loans on bank balance sheets have declined by around 60% from their peak, the stock remains high. Measures that reduce judicial inefficiencies relating to the repossession of collateral and further encourage NPL write-offs will promote the efficient allocation of capital as well the ability of the banking sector to withstand any further adverse economic shocks.

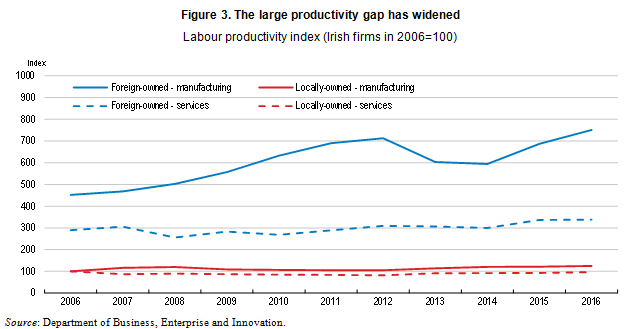
Above all else, the long-term durability of the Irish economy will rely on policy reforms that encourage a broad-based recovery in productivity. Most Irish firms have experienced declining productivity over the past decade. This has largely reflected the poor performance of local firms, with the large productivity gap between foreign-owned and local enterprises having widened (Figure 3). New firm level analysis undertaken in tandem with this Economic Survey confirms this is the case (Department of Finance, 2018; the findings of this work will be discussed in more detail in a blog post over the coming days). The resilience of the Irish economy hinges on unblocking the productivity potential of these local businesses. Pruning back regulatory barriers to entrepreneurship, such as costly regulations related to commercial property and legal services, is a start. However, productivity spillovers between foreign-owned firms and local businesses also need to be fostered by encouraging the accumulation of high-level managerial skills and research and development intensity in the latter.

Ireland 2018 Brexit3

Creating a more sustainable growth environment will raise the ability of policymakers to confront key challenges that exist for the wellbeing of the population. Particular areas that should be a focus include health, housing and getting people into work. To address these challenges, universal healthcare coverage should be provided, stringent housing regulations that are constraining dwelling supply rationalised and some social benefits withdrawn more gradually as labour earnings rise.

References

Department of Finance (2018), “Patterns of firm level productivity in Ireland”, forthcoming.

OECD (2018), OECD Economic Surveys: Ireland 2018, OECD Publishing, Paris.


Unsatisfactory global growth:  A call to policy action!

CLM with credit press conference Interim Eco Outlook Feb 2016


by Catherine L. Mann

OECD Chief Economist and Head of the Economics Department


Welcome to the OECD Economics Department’s new ECOSCOPE blog !

Our Interim Economic Outlook launched today shows a troubling picture—world growth stuck at 3% in 2016, and only 3.3% in 2017, with substantial volatility in financial markets raising new risks.  The OECD’s mantra is “better policies for better lives”  and that is central to our assessment that a stronger policy response is urgently needed to get global growth out of this low-growth equilibrium.  Monetary stimulus alone cannot reverse many of the worrying trends seen in the Interim including weak trade, low investment and an apparent slowing of trend productivity.  Given very low interest rates, now is an opportune time for collective fiscal action, focusing  on investment spending that will raise growth in the near term and underpin long-term output potential.  Greater ambition on structural reforms to provide an environment conducive to private investment goes hand-in-hand. ( On 26 February, we will launch our annual Going for Growth assessment of structural policy needs and the progress countries are making towards achieving more productive economies with better quality jobs (details to be posted on this site)).   Monetary, fiscal, and structural policy tools are synergistic and all need to be deployed at this time.

Does the call for more fiscal action by the OECD represent a change of view ?

In a well-known phrase, Keynes wrote “When my information changes, I alter my conclusions. What do you do, sir?”.   So, what is new?

First, OECD governments have more fiscal space than they did in the immediate post-crisis period. The sovereign debt crisis has faded and the most severe banking problems have been addressed. Budget deficits have fallen in many countries following budgetary consolidation and falling interest costs. The long-term interest rate is far lower than it was 3-years ago with negative interest rates on government borrowing of a few years and the ability to raise money at longer horizons at a minimal cost.

Second, the persistent downgrade of forecasts across the economics profession in recent years raises deep questions about how the economy is operating. Some key mechanisms that drive economic recoveries seem to be not working:  wage pressures are exceptionally weak even in countries where unemployment has fallen; inequality is rising; business investment is not responding to the extraordinarily low cost of capital;  currency depreciations are not leading to robust exports;  inflation pressures seem non-existent across many economies despite exceptional monetary policy action; productivity growth and diffusion innovation appear to have slowed. The thread that runs through these disconnects is weak demand, hence the need to use all policy tools to full effect.

A scenario exercise in the Interim shows the potential growth gains, and fiscal sustainability benefits of a collective action on fiscal spending.

1st year effects of a 1/2 percent of GDP public investment stimulus by all OECD countries
Change from baseline

IEO_Slide18_Fig1_E_P2CL

There are many open questions about what are the key issues facing policymakers, and how they should balance both immediate and longer-term objectives.  This blog is an opportunity to debate these topics!

We hope that windows into research by OECD economists posted on this blog will share new insights about the evidence and the ‘’better  policies” we need to ensure the ‘’better lives’’.   Please join the conversation!

Background

Achieving prudent debt targets using fiscal rules

Interim Economic Outlook

The Future of Productivity