Extending trade benefits to more firms and workers

By Aida Caldera, Alberto Gonzalez Pandiella and Alessandro Maravalle

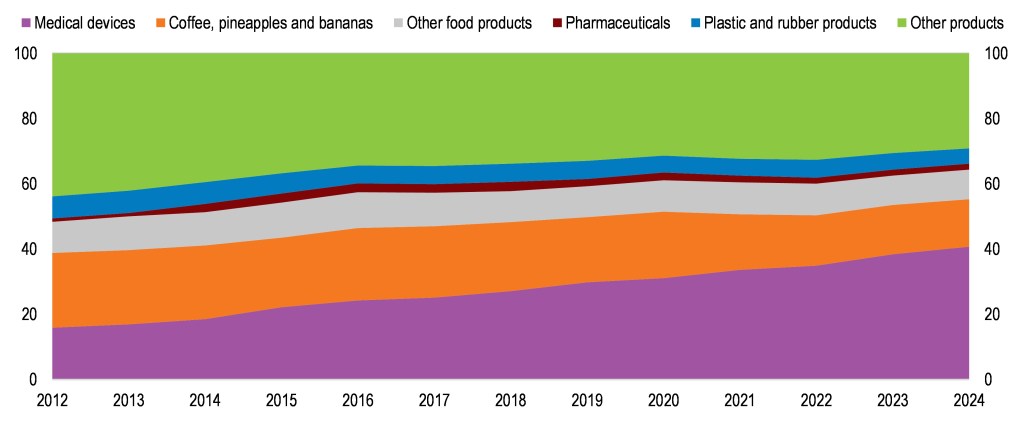
At the beginning of the 1990s, Costa Rica was primarily known for exporting agricultural products like bananas and coffee, along with its thriving tourism sector. Today, places like Alajuela have become global hubs for advanced manufacturing, particularly in the medical devices sector. A strong and sustained commitment with open trade explains this remarkable transformation.  Thanks to a more diversified export basket and a shift towards higher value-added goods and services (Figure 1), Costa Rica’s economy has grown more than other OECD countries and regional peers over the last three years and was more resilient to recent shocks. This success story is not without clouds or challenges, as detailed in the 2025 OECD Economic Survey. A long-standing challenge is that not all workers, companies and regions have so far benefited from trade.

Figure 1. High-tech products are a growing share of Costa Rica’s exports

Exports by type of product, % of total good exports
Source: Banco Central de Costa Rica.

Maximising trade benefits

There remain ample opportunities for Costa Rica to capitalize on its trade openness and FDI attractiveness. With Costa Rica’s exports remaining concentrated in a few destinations ongoing efforts to diversity trade agreements and enhance trade facilitation, which have regained considerable impetus since 2022, will facilitate stronger integration into global and regional value chains. Nearshoring offers new opportunities for Costa Rica to extend trade benefits to more workers, firms and regions. However, several barriers might prevent these opportunities from materializing. Continuing the path of reform to enhance education, foster innovation, improve infrastructure and promote stronger competition would help Costa Rica seize maximise trade benefits.

Costa Rica’s well-educated workforce has been traditionally key to attract FDI and develop value added exports. However, now large skills shortages pose a critical threat to Costa Rica’s FDI attractiveness. A comprehensive education reform is underway, but key timelines and milestones are still unclear. The ongoing efforts to reform education should prioritise the increase in the number of technicians and graduates in STEM areas and ensure that university education is better aligned with labour market demands.

Boosting innovation is crucial for Costa Rican firms to access international markets. However, interactions between public universities and businesses are weak, and most innovation funding goes directly to universities without impact evaluations. Competitive performance-based funding is limited, compared to other OECD countries. Strengthening interaction between public universities and businesses, and introducing  impact evaluations to innovation funding, would help boost firms’ innovation.

Infrastructure bottlenecks are large, driving up trade costs and limiting the participation of remote regions and SMEs in international trade. Key issues include poor-quality roads and overcrowded ports. The low quality of transport infrastructure can be attributed to underspending, deficient strategic planning and inefficient capital project execution, with only 30% of budgeted capital spending getting executed. Strengthening planning and design of transport projects and enhancing budget management  would reduce delays and cost overruns and contribute solve Costa Rica’s large infrastructure gaps.

Finally, boosting competition in domestic markets would help Costa Rican firms access better inputs at lower costs. Despite ongoing efforts to improve competition in some areas, , such as removing anticompetitive practices in professional services and reducing the large and complex stock of regulations, Costa Rica still has some of the strictest regulations in the OECD. Continuing to increase the Competition Authority’s budget is crucial for identifying and addressing anticompetitive practices.

References

OECD (2025), OECD Economic Surveys: Costa Rica 2025, OECD Publishing, Paris, https://doi.org/10.1787/048cf07b-en


Brexit and Dutch Exports: Fewer glasshouses, more glass towers as agri-food shrinks and finance gains.

by Donal Smith, OECD Trade Directorate and Economics Department

netherlands economic survey 2018The Netherlands is likely to be one of the European countries that is going to be significantly affected by the United Kingdom’s planned departure from the European Union (Brexit). As an open economy with strong trade and investment links to the United Kingdom, the Netherlands is exposed to increases in barriers to trade between the United Kingdom and EU (Vandenbussche et al., 2017). New OECD simulations show the potential extent of this impact, as well as the different sectors of the Dutch economy likely to be affected.
The sector-level impacts will depend on differing UK trade exposures, tariff rates and non-tariff measures (NTMs) applied to different products; varying degrees of global value chain integration of the sectors; and differences in sectors trade diversification opportunities. On trade exposure for example, the agri-food sector has a comparatively high UK exposure. This sector accounts for 23% of the total exports of the Netherlands to the UK while the UK market makes up 12% of total Dutch agri-food exports (OECD 2018).[1]

An illustrative worst-case Brexit scenario – assuming the UK leaves the EU without any trade agreement – is simulated using the OECD METRO model (OECD, 2015).[2] The key advantage of this analysis is that it accounts for changes in both tariff and non-tariff barriers. The scenario assumes that trade relations between the EU and UK default to the World Trade Organisation’s (WTO) Most-Favoured Nation (MFN) rules, that is, the most basic trade relationship. Relative to current arrangements, this corresponds to an increase in tariffs on Dutch trade with the United Kingdom of between 0 and 12  per cent.


mourublog1nether2018

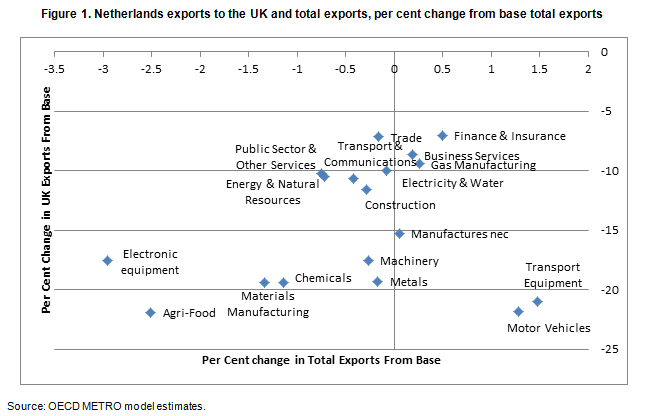
Simulation results show that Dutch exports to the UK would fall by 17%in the medium-term. The Dutch agri-food sector is estimated to experience a 22% fall in its UK exports (Figure 1). This is driven by a substantial 35% decline in exports in the meat products sector. Smaller materials manufacturing sectors such as wood and leather products and textiles would see a 20% fall in their UK exports. The 2% fall in production in agri-food contributes to a 7% decline in the value of agricultural land. Four of the five sectors that record the largest declines in employment following production falls are in the agri-food sectors.

Of all the non-agri-food sectors, electronic equipment would see the largest decline in total exports at 3% and the largest decline in production at 2.4% in the scenario. Access to supply chains for intermediate imports from the UK for Dutch sectors is also curtailed; intermediate imports from the UK would fall by over 40% in the finance and insurance sector in the scenario.

There are a few sectors which have export gains under this scenario. These include motor vehicles, finance and insurance and transport equipment, these sectors show increases in exports to the rest of the EU as well as the United States. The gas sector expands slightly, but this translates into relatively larger gains of gross exports of 6% (to EU) and 10% (to US).

[1] OECD METRO model data.

[2] This shock implies a scenario could be the result of a disorderly conclusion to negotiations and can be considered something close to a worst case outcome and does not consider the impact via investment.

References

OECD (2018), OECD Economic Surveys: Netherlands 2018, OECD Publishing, Paris.

OECD (2015), “METRO v1 Model Documentation”, TAD/TC/WP(2014)24/FINAL.

Vandenbussche, Hylke and Connell Garcia, William and Simons, Wouter, Global Value Chains, Trade Shocks and Jobs: An Application to Brexit (September 2017). Available at SSRN: https://ssrn.com/abstract=3052259 or http://dx.doi.org/10.2139/ssrn.3052259


As Estonian exporters lead the way, policy needs to adapt

by Zuzana Smidova, Estonia Desk, OECD Economics Department

International trade plays an important role in the Estonian economy (Figure 1). Around a half of the private sector employment is sustained by foreign demand, twice as much as the OECD average. By another measure, over 40% of the value added created in the economy is linked directly or indirectly to exports, largely in the services sector. Yet, value added per worker produced in Estonia and consumed abroad remains low, even if comparable to its EU peers.

Estonia Suzana blog

International trade and foreign direct investment can serve as a ladder for climbing up the value added chain as they are major channels of technology diffusion and productivity growth. Exporters display higher productivity and innovation than companies oriented on the domestic market, and this is true in Estonia too, as new research shows (Benkovski et al, 2017, forthcoming) (Figure 2). Exporters are faced with tough global competition and have to meet international standards.

Estonia Suzana2blog

To increase export potential and value-added drawn from trade, innovative capacity and transfer of knowledge from highly productive firms to the rest of the economy need to improve. For the moment, innovation of the typical Estonian firms is limited as spending on business R&D is low. In this vein, nurturing cooperation between the researchers and business is crucial, as highlighted in the new Economic Survey of Estonia (OECD, 2017). The new industrial policy green paper, initiated by the business community and focused on digitalisation of traditional industries is welcome. It has the potential to improve the productivity and innovation capacities of these sectors. Furthermore, policy efforts should concentrate on strengthening adult education and allowing for immigration of talents, since shortage of skilled labour is starting to show as a major obstacle for further business growth and investment. This can also help with improving the innovative capacities.

By giving access to a wider variety of goods and services at cheaper prices, international trade raises well-being and consumers’ purchasing power. It also means fast transmission of global shocks, requiring a robust social safety net and adjustment policies. To ensure that all benefit from opportunities created by globalisation, the Estonian policymakers should focus on two policy areas. Firstly, those who can work need to have the right skills and incentives to participate in the labour market. Secondly, those who are out of the labour market should be supported by an effective and adequate social safety net, conducive to upskilling and maintaining work incentives. This means for instance increasing the level of subsistence of benefits and relaxing eligibility conditions for unemployment benefits, not least to improve participation in active labour market measures.

References:

Beņkovskis, K.,Masso, J., Tkasevs, O., Vahter, P., Yashiro, N. (2017), “Export and productivity in Global Value Chain: Evidences from Latvian and Estonian firms” OECD Economics Department Working Paper, OECD Publishing, Paris, forthcoming

OECD (2017), OECD Economic Surveys: Estonia 2017, OECD Publishing.


Brazil: A tale of two industries or how openness to trade matters

by Jens Arnold
Senior Economist, Head of the Brazil Desk, OECD Economics Department

Brazil has a large and diversified industrial sector, but while parts of it are thriving, others are facing hard times, in part because they are weakly integrated into the world economy. The automotive and the aircraft sectors are two opposite examples of Brazilian industries – one inward-focused and one fully integrated into global trade.

Brazil is the world’s seventh largest automobile producer, but its automotive industry is currently facing severe challenges and production is declining (Figure 1). The industry is heavily protected from foreign competition and Brazil’s car manufacturers have a strong focus on the domestic market and on local content. Only 15% of the production is exported. Despite being the 8th largest producer of cars in the world, Brazil ranks only 24th in automotive exports. Brazilian vehicle exports have the third-lowest foreign value added content among the 62 countries in the OECD-WTO Trade in Value Added database (OECD, 2015a).

Figure 1. Production of motor vehicles, in million units, accumulated over 12 months

Brazil fig 1

Source: ANFAVEA website, available at http://www.anfavea.com.br/tabelasnovo.html

While many foreign producers have set up production plants in Brazil in light of the attractive long-term potential of Brazil’s consumer market, most of them have not integrated their Brazilian plants into global value chains (OECD, 2015b). Possibly due to the low exposure to foreign competition, productivity has fallen sharply behind Mexican car manufacturers, who are fully integrated into global production chains and have achieved remarkable gains in global market share. For example, Mexican plants produce 53 cars per worker and year, as opposed to 27 in Brazil, although the cars produced in Mexico are on average smaller models.

A very different story can be told about Brazil’s aircraft industry. Given that production volumes of airplanes are much smaller than for automobiles, economies of scale mandate that firms in this industry focus on the global market. Embraer, originally created in 1969 as a state-owned company, was privatized in the 1990s and has become one of the top global players in the industry since then. Its initial strategy was largely based on buying almost all components internationally for a final assembly in Brazil, although over time it has started to produce parts itself. As a result of its roots, Embraer has always been strongly integrated into global production chains, and imports still account for 70% of its value added. At the same time, exports have grown steadily, performing significantly stronger than motor vehicle exports (Figure 2). By now, Embraer has become the world’s third largest aircraft producer, and it is the global leader in the 70-130 seat aircraft segment, where it accounts for 60% of global deliveries.

Figure 2. Brazil: Exports of motor vehicles and aircraft, 2005=100, in USD

Brazil fig 2

Source: Ministry of Development, Industry and Foreign Trade, Brazil.

References

OECD-WTO (2015a). OECD-WTO Trade in Value Added (TiVA) database

OECD (2015b). OECD 2015 Economic Survey of Brazil, OECD Publishing, Paris