Tackling regional disparities in productivity in Colombia is crucial to improving living standards and ensuring economic wellbeing for all Colombians. Colombia’s regional gaps in GDP per capita are among the highest in the OECD (Figure 1), largely driven by deep-rooted differences in productivity, as highlighted in the recent 2024 OECD Economic Survey of Colombia. These disparities have developed over many years, exacerbated by decades of conflict, unequal access to infrastructure, education, training, labour market opportunities, and institutional weaknesses.
Figure 1. Colombian regions differ widely in their GDP per capita
Note: GDP per capita is for large TL2 regions (departamentos in Colombia) and for 2022 or the latest year available.
Colombia faces a unique opportunity to boost its economy and ensure that every region benefits. Global shifts like changing trade patterns, nearshoring, and the green transition present challenges, but also big opportunities. The Colombian government has made regional development a key part of its plan to revitalize, diversify and transform the economy. To seize this moment and bring prosperity to all regions, the 2024 OECD Economic Survey of Colombia outlines a set of strategic policy actions:
Upgrade infrastructure for better connectivity: Colombia’s infrastructure has long been held back by under-investment, conflict, and its rugged geography. For example, it can take over eight hours to drive the 250 km between Bogotá and Medellín. While national roads have seen some recent improvements thanks to public-private partnerships, the next step is to develop and connect ports, rivers, railways, and roads more efficiently. Additionally, improving rural roads is critical for linking remote communities to nearby cities and markets.
Cut red tape for businesses: High administrative costs and complex regulations make it tough for businesses, especially small ones, to thrive in Colombia. Expanding digital one-stop shops for permits and licenses to more municipalities, including more procedures and digital payment options, particularly in remote areas, would help more small businesses formalize, create jobs, and contribute to local economies.
Equip young adults with job-ready skills: Many young adults leave school without the skills they need to succeed in the workforce, especially in rural areas where schools are far away. Upper-secondary vocational training programmes (VET) have been a lifeline for many, offering valuable skills and good outcomes. Expanding these programs in vulnerable regions where educational options are limited can help bridge the gap between school and work.
Strengthen subnational governments capabilities and finances: Many subnational governments, especially local authorities in remote and rural areas, struggle with limited fiscal and administrative capacity. A reform to strengthen fiscal equalisation mechanisms and to enhance direct tax collection would improve fiscal capacities. The ongoing implementation of the multipurpose land registry is an important step along this way. Administrative capacity building should go hand in hand with delegation of authority, clarifying spending responsibilities, and improving intergovernmental coordination. These recommendations are in line with recommendations from Colombia’s decentralisation commission.
Fight corruption, especially in rural areas: Corruption hits Colombia’s poorest and most rural regions hardest, eroding trust and blocking progress. Strengthening regulations on private political campaign funding, better protecting civil society leaders, and improving transparency in financial transactions are critical steps to ensure that progress benefits all Colombians.
Implement the Peace Agreement to boost rural development: The 2017 Peace Agreement opened the door for growth in areas long affected by conflict, especially in rural regions. By improving infrastructure and ensuring peace, these areas can participate in trade and benefit from Colombia’s strong tourism. However, the pace of implementation has been slow, and more resources are needed to fully realise the benefits of peace.
Closing the prosperity gap between Colombia’s regions is essential not only for regional equality but also for boosting the country’s overall productivity. By improving infrastructure, reducing barriers to business, and empowering local governments, Colombia can build a brighter future where every citizen—no matter where they live—can share in the country’s growth and success.
A policy framework for reviving productivity growth
Category: Uncategorized
written by oecdecoscope | October 17, 2024
By Christophe André, Peter Gal and Álvaro Pereira
It is well known that productivity ultimately drives living standards. In the long run, all that matters is productivity. However, productivity growth has been on a declining trend across the OECD for decades (Fernald, Inklaar and Ruzic, 2024; Goldin et al, 2024). Labour productivity – measured by GDP per hours worked or per employee – has been slowing from nearly 2% annual growth to around 0.8% per year over the last decade. This slowdown was driven by lower trend multi-factor productivity growth and, since the global financial crisis, weaker capital accumulation (Figure 1). In a new paper (André and Gal, 2024), we provide an update on the existing macro- and firm-level evidence and on the role of public policies.[1]
Figure 1. MFP and capital accumulation have both contributed to the slowdown in trend per capita potential growth
Decomposition of OECD potential GDP per capita growth (annual change, in %)
Note: All variables are smoothed except capital stock per worker. For more details, see the source. Source: André and Gal (2024) based on the OECD Economic Outlook 113 Database.
The long-term declining productivity growth trend since the 1970’s was interrupted by a roughly decade-long rebound starting in the mid-90s, associated with the diffusion of information and telecommunication technologies (ICTs) in the United States and other countries. Looking at the micro level, firms at the technological frontier have continued to perform more strongly than other firms since the 2000s (Andrews, Criscuolo and Gal, 2016), but the rate of frontier growth also seems to have slowed in the past decade or so. High uncertainty, financial disturbances, low investment, and weak business dynamism may have all played a role in slowing OECD productivity growth to historical lows.
As OECD economies face structural headwinds, including ageing, diminishing gains from education and high debt levels, a productivity revival appears more necessary than ever. But can it be achieved? A debate has been going on for over a decade on the ability of new technologies to boost productivity, with sceptics such as Gordon (2016) considering that recent inventions are unlikely to foster the same kind of growth as did electricity and the internal combustion engine, against those who believe that digital technologies can boost productivity, provided the right complementary investments are in place (e.g., Brynjolfsson, Rock and Syverson, 2021; Mokyr, 2013). In particular, recent OECD research shows that Artificial Intelligence will provide a significant boost to productivity (e.g. Filippucci et al., 2024; Filippucci, Gal and Schief, 2024).
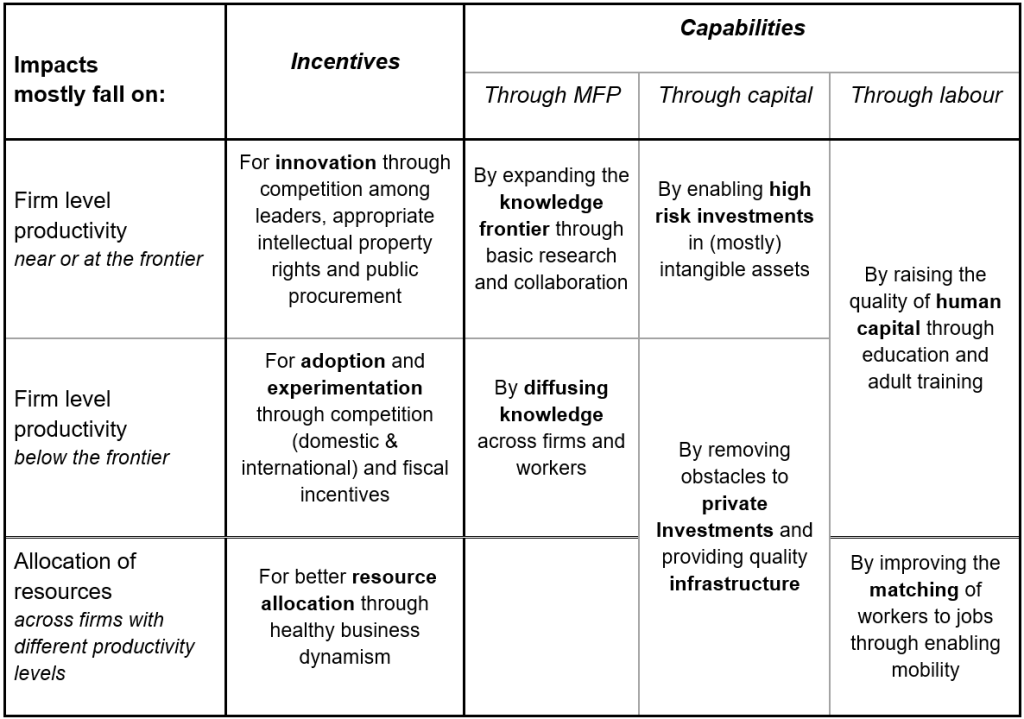
Indeed, productivity is not only about technology. OECD research has shown that the broader economic environment is key for promoting innovation, diffusion and turning it into productivity benefits (OECD, 2015). Our paper builds on that framework by exploring how incentives and capabilities affect firms at the technology frontier and below, as well as the reallocation of resources across the economy (Table 1).
Table 1. The scope of policies to raise productivity through shaping incentives and capabilities: A stylised framework
Note: MFP stands for multifactor productivity. See more details in the source. Sources: André and Gal (2024), building on and extending OECD (2015).
Competition is key among incentives: it encourages firms at the technological frontier to innovate and other companies to adopt modern technologies and business practices. Therefore, the rising market concentration in the United States and to a lesser extent in Europe, along with rising markups and the long-term decline in business dynamism is worrying.[2] Moreover, the fragmentation of international trade, due to geopolitical tensions and other barriers, is eroding the productivity benefits from global competition, and also holds back knowledge spillovers across borders in value chains. Regulatory and trade policies should aim to revert or mitigate these tendencies.
Innovation can also be incentivised through intellectual property regimes provided they strike the right balance between protecting innovation and preserving market competition. Fiscal incentives and public procurement also matter, and can be used in a directed way to serve other policy goals such as greening the economy.
The allocation of resources (such as labour and capital) across firms also plays a key role for aggregate productivity. Flexible labour markets, well designed active labour market policies, and better access to housing are essential for labour reallocation, but can be hampered by excessive use of non-compete and non-poaching clauses as well as burdensome licensing procedures. Efficient insolvency regimes can promote entrepreneurship, by lowering the cost of failure, and facilitate corporate restructuring and the reallocation of resources towards more productive uses.
Crucially, providing the right incentives needs to be complemented with measures to improve capabilities along various dimensions. First, promoting basic research is key to advance the knowledge frontier. Second, good quality infrastructure and other measures for domestic and international integration help creating innovation networks to diffuse knowledge. Third, attracting venture capital and measures addressing the difficulties of financing intangibles could allow start-ups to flourish. Finally, human capital can be developed through higher quality education systems, promoting and enabling lifelong learning, spreading good management practices and fostering a better use of skills through matching of workers to jobs.
In sum, while the impact of new technology on economic growth remains highly uncertain, governments should pull all the available policy levers to strengthen incentives and build capabilities to ensure their economic benefits are maximised and contribute to a revival of productivity growth, and hence boosting living standards.
Brynjolfsson, E., D. Rock and C. Syverson (2021), “The Productivity J-Curve: How Intangibles Complement General Purpose Technologies”, American Economic Journal: Macroeconomics, Vol. 13/1, pp. 333-372, https://doi.org/10.1257/mac.20180386.
Fernald, J., Inklaar, R. and Ruzic, D. (2024), The Productivity Slowdown in Advanced Economies: Common Shocks or Common Trends?. Review of Income and Wealth. https://doi.org/10.1111/roiw.12690.
Filippucci, F., P. Gal and M. Schief (2024), “Miracle or Myth: Assessing the macroeconomic productivity gains from Artificial Intelligence”, OECD, forthcoming.
Goldin, I., P. Koutroumpis, F. Lafond, and J. Winkler (2024), “Why Is Productivity Slowing Down?” Journal of Economic Literature, 62 (1): 196-268, https://doi.org/10.1257/jel.20221543.Mokyr, J. (2013), Is technological progress a thing of the past?, https://cepr.org/voxeu/columns/technological-progress-thing-past.
Gordon, R. (2016), “Perspectives on “The Rise and Fall of American Growth””, American Economic Review, Vol. 106/5, pp. 72-76, https://doi.org/10.1257/aer.p20161126.
[1] For a recent complementary overview of the literature on the structural drivers of productivity with a stronger focus on measurement, see OECD/APO, 2022.
[2] Even though a resurgence in US business creations since the COVID-19 pandemic offers a glimmer of hope.
Doombot versus other machine-learning methods for evaluating recession risks in OECD countries
Category: Forecast,Uncategorized
written by oecdecoscope | October 17, 2024
by Thomas Chalaux and David Turner
Predicting when a recession will hit is no easy task, and economists have long tried to make sense of a wide variety of financial and business cycle data from both domestic and international sources. The challenge of picking the right variables for each country and time frame, which can take on different functional forms, makes machine-learning methods especially useful.
Recent OECD research has compared traditional machine-learning models, including the popular LASSO (Least Absolute Shrinkage and Selection Operator), with a new algorithm the OECD researchers developed called “Doombot.” LASSO works by simplifying models, helping to improve their accuracy by limiting unnecessary variables. Doombot, however, takes a more exhaustive approach, testing a wide range of variables and placing restrictions to ensure its predictions better align with an overall economic story.
What data was used?
The OECD research tested several algorithms on data from 20 OECD countries, looking at how well they could predict recessions at different time frames, from immediate quarters to two years ahead. The most frequently picked data were financial indicators, such as credit, house prices, share prices and interest rates (like the yield curve slope). Economic activity data, like GDP and unemployment, were used more often for shorter-term forecasts. Notably, these predictors weren’t limited to each country’s domestic economy; international aggregations of the same variables played a significant role.
Doombot performs best on predictive accuracy
When predicting rare events like recessions, it’s important to test models on data they haven’t seen before—this is called “out-of-sample” testing. This helps avoid overfitting, where a model looks good on historical data but performs poorly when making real-time predictions. Doombot outperformed the competition across multiple metrics when tested on OECD countries. In particular, it gave a clearer early warning of the 2008 Global Financial Crisis (GFC) than LASSO and other methods. By rolling forward predictions and comparing across different countries and timeframes, Doombot consistently ranked higher than other models.
Doombot tells a better economic story
In addition to being more accurate, Doombot’s predictions align better with economic narratives. It uses fewer variables—typically less than three per equation—compared to LASSO, and its predictions are more consistent across countries. The signs on the variables (indicating whether a variable should increase or decrease recession risk) are in line with economic logic, which isn’t always the case with other algorithms. Furthermore, Doombot produces smoother recession probability forecasts, avoiding the erratic jumps seen in some other models. These features make it easier for economists to break down the drivers of recession risk and spot trends across different countries.
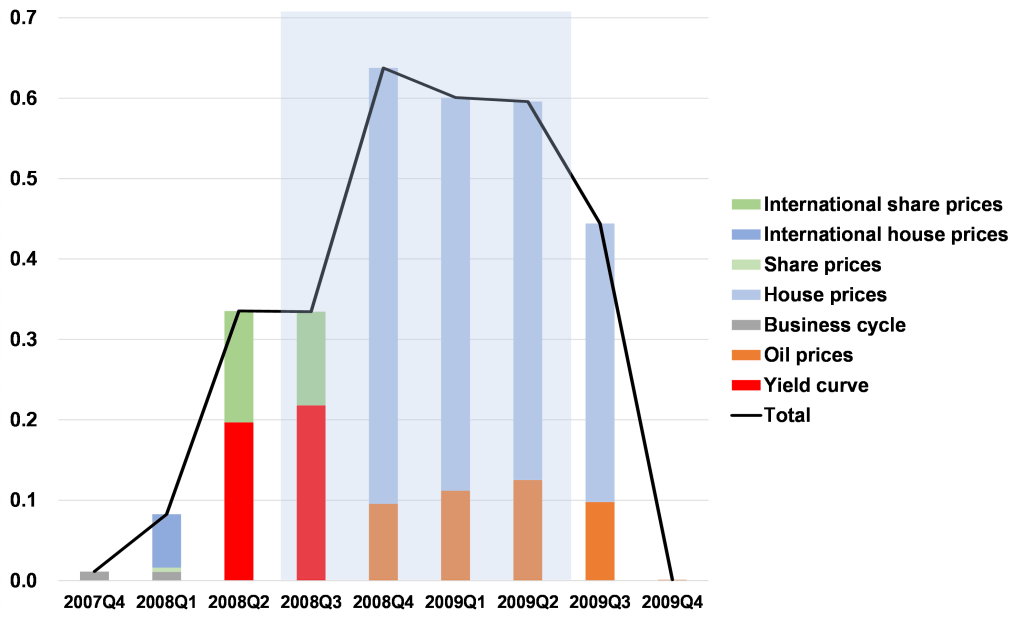
For example, ahead of the GFC, Doombot predicted a steady rise in recession risk for the United States, primarily driven by an inverted yield curve and falling stock prices (see Figure 1). In the longer term, declining house prices and rising oil prices also played a role. Similar patterns appeared in other countries, with house prices and credit developments standing out as key factors leading up to the GFC.
Figure 1. Contributions to predicted recession probabilities for the United States ahead of the GFC
Out-of-sample projections made with data available in early December 2007
Note: This chart shows an approximate decomposition of the recession probabilities into the contribution from each explanatory variable. The predictions are made with the Doombot algorithm using data available in early December 2007. The United States was in recession from 2008 Q3 to 2009 Q2, corresponding to the shaded background area.
The benefits of combining accuracy with narrative
The constraints imposed on the Doombot algorithm help to provide a more coherent economic narrative and so mitigate the common ‘black box’ criticism of machine-learning methods. Perhaps the most interesting and important finding from this work is that there is no trade-off between predictive performance and better story-telling, so that imposing judgmental constraints consistent with economic priors tends to improve rather than hinder the predictive performance of Doombot. This could have important implications for future machine-learning applications in economics.
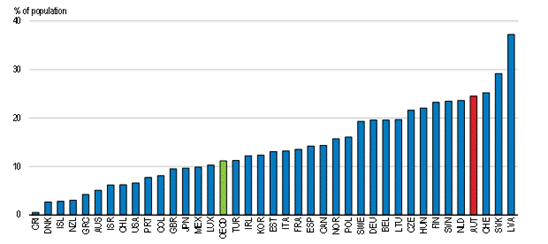
Intense storms have affected central Europe in recent days, causing substantial flooding, including in Austria. Although it is too soon to assess the role of climate change in this particular event, global warming will most likely significantly increase the prevalence of floods in Austria in the future. Austria is particularly exposed to flood risk and its consequences: 15% of built-up land is situated close to a river, the fifth largest percentage in the OECD. Partly in consequence, a larger share of the population is exposed to flood risk than most OECD countries (Maes et al (2022) and Figure 1). Meanwhile a relatively small share of households and businesses take out flood insurance. As discussed in the recent 2024 OECD Economic Survey of Austria (OECD, 2024), reducing the negative impact of frequent and severe floods requires a two-pronged strategy: reducing exposure through better land use and protective investments, and compensating losses through wider insurance coverage.
Figure 1. A large share of the population in Austria is exposed to floods
Share of population exposure to river flooding with a 10-year return period, 2020
Note: A return period is the average or estimated time that a flood event is likely to recur. Source: IEA/OECD (2023), “Climate-related hazards: River flooding”, Environment Statistics (database), https://oe.cd/dx/58w.
One reason for Austria’s high exposure to flood risk is that a lot of land has been sealed or artificialised in recent years, so called “land take”. Building residential properties on land close to rivers mechanically increases the number of people who can be affected by a flood. Sealing land, for instance through building, can weaken the ground’s capacity to absorb rainwater, thus increasing the risk of flooding. Between 2012 and 2018, the rate of land take was higher than the EU average, relative to country size, and higher than population growth (European Commission, 2022). In October 2021, the Austrian Conference on Spatial Planning was mandated to develop the first Soil Strategy for Austria, which aimed to reduce land take from 11.5 hectares per day to 2.5 in 2030 (Schamann, 2022). The strategy was to be presented at the end of 2022 but has been delayed several times. Therefore, our first recommendation is to Finalise the Soil Strategy, to reduce land take based on a quantitative objective.
Increasing the effectiveness of natural flood protection mechanisms, and deploying structural flood mitigation investments, are key levers to reduce the consequences of floods. Evidence from Austria suggests that forests can reduce run-offs into rivers including after heavy rainfall, thus limiting the risk of flooding (Markart et al., 2022). However, many of Austria’s forests are not in a good shape to perform this role; and there is room for improving their condition. Other nature-based solutions to building flood resilience can complement infrastructure investment in urban areas, such as the “eco-street” project in the municipality of Ober-Grafendorf which provides roadside green spaces to increase water absorption and reduce the run-off of rainwater into the water treatment system. Nature-based solutions are often less costly than infrastructure and can provide additional climate mitigation benefits. However, structural flood mitigation investments, such as dams, levees, and reservoirs, can be particularly cost effective in urban built-up areas. Improvements in drainage systems and the installation of permeable pavement can also improve absorption capacity. One example is the Danube side channel built by Vienna between 1972 and 1988 in order to provide flood relief.
A particular constraint for consistent policy on reducing land take and increasing adaptation investments is that spatial planning, building regulations, and infrastructure investment are typically the responsibility of local authorities. Nationwide regulations on land take could be considered. For instance, Portugal imposes regulations restricting urban development in areas adjacent to rivers. Incentives to reduce land take and foster investment could also be provided through adjustments in fiscal equalisation transfers (a type of transfers made from central to local government). Adjustment could also be made to the coverage provided by the Austria’s Catastrophes Fund, a public fund financed by federal taxes which pays for preventive and compensation measures against natural catastrophes. Similarly, private investment by households and SMEs in adaptation measures can be incentivised by subsidised loans. In France, adapation measures can be financed by the “fonds de prévention des risques naturels majeurs” which is financed by the “Catnat” premium, a mandatory contribution from all property insurance policies (Covéa, 2023).
Even with additional preventive measures, some of Austria’s households will remain vulnerable to the consequences of floods when they occur. Expanding the coverage of flood insurance will then be essential to reduce the socioeconomic costs of floods. Today, take up of private insurance coverage against flooding is relatively low in Austria: it has been estimated that the insurance market penetration (measured by the share of assets’ values that are covered by insurance) against river flooding was 5% in Austria in 2022 against 40% in Germany or 100% in France and Switzerland, where coverage is compulsory (Insurance Europe, 2022). Because Austria is highly exposed to future flood risk, an estimation by the European Commission suggests that it has the largest protection gap in the EU (the protection gap provides an estimation of the share of future climate-related disaster losses which is uninsured today) (Radu, 2022).
Enhancing public awareness of flood risk would help raise the take up of insurance. Recent initiatives by the Austrian government have proven particularly helpful. It has developed an online mapping tool, HORA, in collaboration with the Austrian Insurance Association. The tool enables individuals to make an initial assessment of the flood risk of their dwelling. Other informational materials available to the public include CLIMA-MAP, which maps climate change impacts in Austria’s municipalities and regions.
Greater public awareness needs to be accompanied by fundamental changes to flood insurance. The objective should be broad coverage at an affordable price while being able to cover large losses. Experiences from European and OECD countries suggest that this could be achieved by mandating the inclusion of flood insurance as part of general housing insurance products, while providing public reinsurance for catastrophic losses (OECD, 2005; Kuik et al., 2017). In France, for example, private insurers must include insurance against flood risk in property insurance policies. Coverage is funded from a fixed share of all premiums. Insurers in turn benefit from government-backed reinsurance through the “Catnat” system. A state guarantee ensures that damages from extreme events can be covered. Austria could consider an approach along these lines; mandating comprehensive flood insurance in homeowners’ insurance policies and setting the Catastrophes Fund as a public reinsurer.
Maes, M. et al. (2022), “Monitoring exposure to climate-related hazards: Indicator methodology and key results”, OECD Environment Working Papers, No. 201, OECD Publishing, Paris, https://doi.org/10.1787/da074cb6-en.
Markart, G. et al. (2022), “Flood Protection by Forests in Alpine Watersheds: Lessons Learned from Austrian Case Studies”, in Protective Forests as Ecosystem-based Solution for Disaster Risk Reduction (Eco-DRR), IntechOpen, https://doi.org/10.5772/intechopen.99507.
Measuring labour input: Is it about quantity, quality, or both?
Category: Human Capital,Uncategorized
written by oecdecoscope | October 17, 2024
By Ashley Ward and Belén Zinni
Human capital, the stock of knowledge and skills embodied in people, is a key input in economic production. Changes in both the “quantity” and the “quality” of a country’s human capital stock influence economic growth and productivity performance (Égert et al., 2022). Traditional measures of labour input in economic growth and productivity analyses, such as total hours worked, focus solely on changes in the quantity of labour input, ignoring changes in the skill composition of the workforce. For example, these measures equate an hour worked by a highly experienced surgeon and an hour worked by a junior retail salesperson, disregarding their vastly different experience and skills.
Firms recognise that workers with different skills and experience are not perfect substitutes by paying them different wages. It is therefore possible to account for differences between workers by weighting their hours worked by their respective shares in total wages. Such measures are often referred to as Composition Adjusted Labour Input (CALI), Labour Services, or Quality Adjusted Labour Input (QALI). CALI measures provide an improved understanding of whether the average “quality” of labour is increasing or decreasing over time. In addition, they can play a crucial role in productivity analysis by more closely explaining the sources of economic growth. Economists often break down output growth into that explained by changes in labour input, capital input, and multifactor productivity (MFP) growth. In this framework, referred to as growth accounting, multifactor productivity (MFP) growth is estimated as a residual, capturing all growth left unexplained by growth in labour and capital inputs. When a traditional measure of labour input is replaced with a CALI measure, a larger share of output growth is attributed to labour, reducing the “unexplained” share attributed to MFP and improving the explanation of the sources of economic growth. Nonetheless, the estimation of CALI comes at the cost of timeliness and resources, as it necessitates access to microdata sources.
The practice of using wages to reflect varying skills among workers assumes that hourly wages equate to hourly productivity. However, numerous factors can lead to disparities between wages and actual productivity. These factors include wage-setting methods, seniority within the workforce, workplace discrimination, and gender pay gaps, among others. Given the current lack of more precise measures of productivity, the existing literature employs wages as a proxy for productivity in constructing CALI measures.
Labour input has grown more than thought
Ward and Zinni (2024) reviews the most relevant literature on CALI estimates and follows a generic approach to produce CALI estimates for 21 countries. The study tests the sensitivity of CALI estimates to the selection of workers’ characteristics, classifying workers according to their educational levels, age (a proxy for years of working experience), gender, industry of work, and occupation. It then analyses the evolution of CALI over time and establishes the impact of accounting for CALI on MFP growth.
Growth in the composition of labour contributed positively to CALI growth between 2004 and 2018 in all countries covered in the study (Figure 1). The greatest contributions from changes in labour composition, and hence the largest increases in the average growth rate of CALI, are observed in Portugal, Poland, and Spain, where the labour composition component grew by 1.9%, 1.2% and 1.1% per year between 2004 and 2018, respectively, well above the average annual growth rate of all countries included in the study (0.6%). In a few countries, including Estonia, Latvia, Portugal, and Romania, accounting for the composition of the workforce changes the sign of growth in labour input from negative to positive, as compared with that suggested by the volume of hours worked.
Figure 1: Changes in the composition of labour contributed positively to CALI growth
Average annual percentage change in age-education CALI and its components, 2004-2018
Note: Data for the United Kingdom corresponds to 2004-2014. Source: Authors estimates based on EU-LFS, EU-SES, STATCAN LFS, CPS and OECD Productivity Statistics (database).
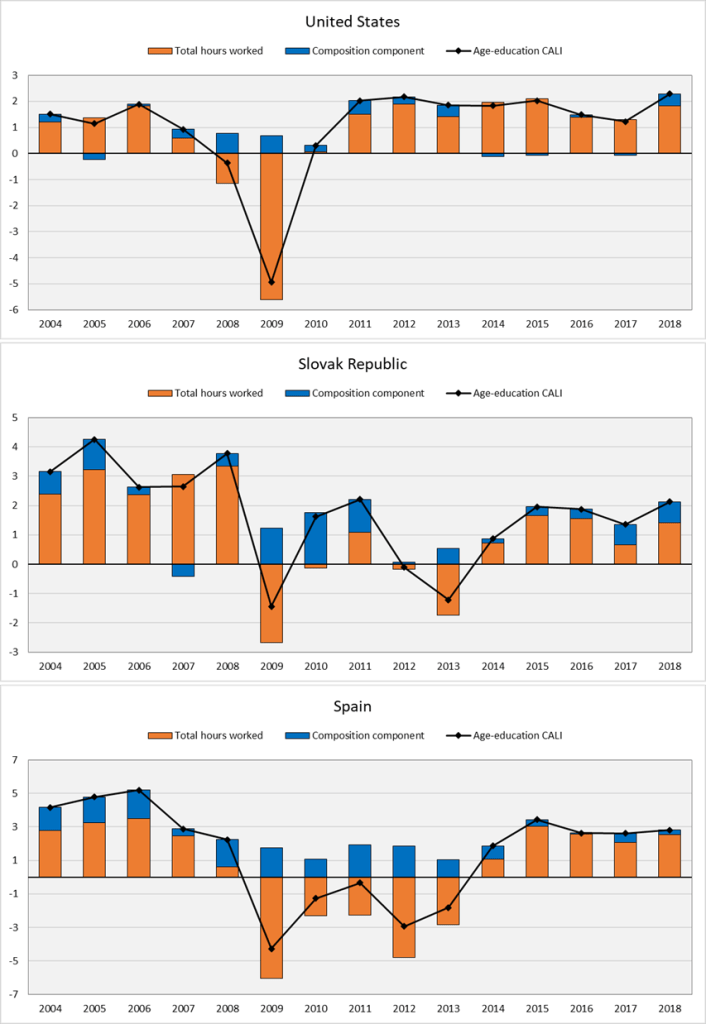
During a recession and often in the years that follow, the compositional effect of CALI tends to be higher, pointing to an increase in the average skill level of those in employment (i.e. an increase in labour quality). Indeed, firms tend to shed labour and/or reduce hours worked among lower-skilled workers during a recession, while hoarding higher-skilled individuals. During the 2008-2009 recession, most countries experienced an increase in the composition component, which counterbalanced the decline in total hours worked and cushioned the fall in CALI (Figure 2).
Figure 2: Most countries saw a decline in CALI during the 2008-2009 recession
Growth in age-education CALI and its components in selected countries, percentage change
Source: Authors estimates based on EU-LFS, EU-SES, CPS and OECD Productivity Statistics (database).
MFP growth is revised downwards when accounting for labour composition
MFP growth is revised downwards for all countries when using a CALI measure, suggesting that labour plays a larger role as a source of output growth than previously understood. While the revision to average annual MFP growth over 2004-2018 remains small in most countries, the impact on MFP growth may be relevant in countries that have experienced larger improvements in labour quality (Figure 3). A significant downward revision in average MFP growth ranging between 0.8% and 1.6% per year is found in Greece, Portugal and Spain, which is equivalent to a cumulative downward revision ranging between 10 and 20 percentage points in the MFP index over the whole period of analysis.
Figure 3: MFP growth is revised downwards for all countries when accounting for changes in labour composition
MFP growth using total hours worked (Standard MFP growth) and the age-education CALI measure (Adjusted MFP growth), average annual percentage change, 2004-2018
Key findings
The OECD study leads to a few key takeaways:
The integration of CALI into the growth accounting framework is essential in countries undergoing significant shifts in the composition of their workforce. In these countries, accounting for changes in both total hours worked (quantity) and the composition (quality) of labour is crucial for improving the understanding of the sources of economic growth.
Educational attainment and age (a proxy for years of working experience) emerge as the two essential workers’ characteristics to consider when building CALI estimates and investigating the contribution of labour input to output growth. Occupation holds some explanatory power of changes in labour quality, possibly accounting for skills mismatches when considered alongside educational levels. Industry of work is found to be largely irrelevant.
The inclusion of gender as a dimension to classify workers into different categories has little explanatory power and can be avoided. The use of wages in the estimation of CALI relies on the assumption that hourly wages equal hourly productivity. Gender pay gaps bring important limitations to this assumption, as they often reflect discrimination between women and men in the workplace, alongside differences in self-selection, propensity to compete, negotiation behaviour and risk aversion, rather than differences in workers’ actual productivity.
NSOs are typically best placed to produce CALI measures, as they benefit from access to a much wider range of data sources, sometimes confidential, and have the expertise to address representative biases to maximise the quality of their estimates. Decisions regarding its calculation will depend on the expected changes in the composition of the workforce overtime and/or the cost of producing CALI, including considerations of timeliness and resources.
Desbloqueando el potencial de Colombia: La importancia de impulsar la inversión
Category: Colombia,Posts in Spanish,Uncategorized
written by oecdecoscope | October 17, 2024
Por Paula Garda y Michael Koelle, Departamento de Economía de la OCDE
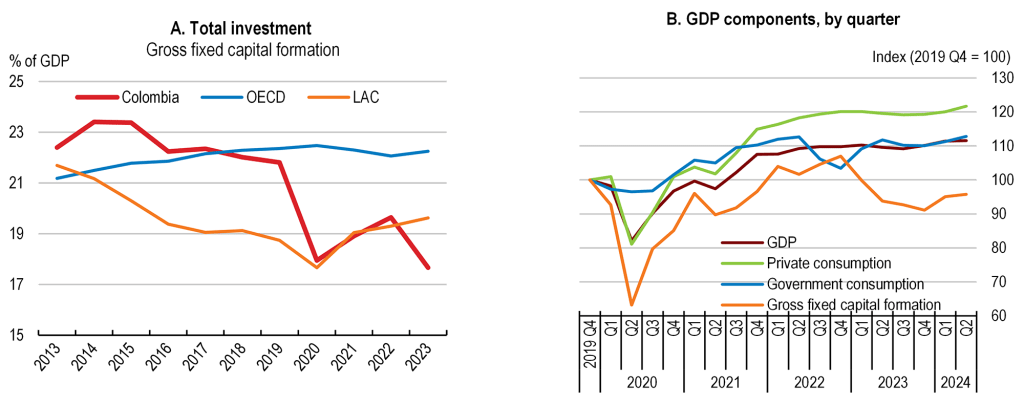
La inversión es el motor que impulsa la prosperidad económica. Es clave para aumentar la productividad, fomentar la innovación y generar empleos formales, todo lo cual es vital para mejorar los niveles de vida. En Colombia, la tasa de inversión ha venido cayendo desde el fin del auge de las materias primas, pasando del 23 % en 2015 al 18 % en 2023, situándose entre las más bajas de los países de la OCDE (Gráfica, panel A), según el Estudio Económico de Colombia 2024. Esta baja tasa de inversión frena el crecimiento potencial de Colombia, que se estima por debajo del 3 %, y es preocupante, ya que el país enfrenta necesidades urgentes en infraestructura, educación, innovación, construcción de paz, desarrollo social y transición hacia una economía verde.
La debilidad en la inversión también está ralentizando el crecimiento actual del PIB de Colombia (Gráfica, panel B). Tras recuperarse rápidamente de la pandemia, el crecimiento impulsado por el consumo se desaceleró drásticamente en 2023 debido a políticas macroeconómicas restrictivas, la desaceleración del crecimiento global y el aumento de los costos de endeudamiento. Aunque la actividad económica, incluida la inversión, comenzó a recuperarse en 2024, la tasa de inversión sigue siendo baja. Entre los factores que explican esta debilidad están los altos costos crediticios, la baja confianza empresarial y la incertidumbre.
Gráfica. La débil inversión está frenando el crecimiento
Fuente: Cálculos OCDE en base a Perspectivas Económicas de la OCDE.
La agenda de reformas del gobierno es ambiciosa, orientada a mejorar los niveles de vida y promover la justicia social a través de la diversificación económica, la transición energética y la convergencia regional. Pero todo esto requiere mayor inversión. Mejorar la infraestructura, la innovación, la educación, los servicios públicos y las oportunidades de empleo formal no solo ayudará a reducir las desigualdades, especialmente en regiones remotas y marginadas, sino que también impulsará el crecimiento a largo plazo. Los recursos naturales y la biodiversidad de Colombia ofrecen oportunidades únicas para atraer inversiones verdes. Dado el limitado espacio fiscal de Colombia, atraer inversión privada es crucial para aumentar la inversión.
Para revertir la tendencia a la baja en la inversión y lograr un crecimiento más fuerte, resiliente e inclusivo, el Estudio Económico de Colombia 2024 de la OCDE sugiere varias acciones de políticas:
Mantener un marco macroeconómico sólido: Esto incluye continuar con la consolidación fiscal y cumplir con la regla fiscal para garantizar la sostenibilidad de la deuda pública y fomentar un entorno favorable a los negocios. Las autoridades monetarias también deben mantener un ciclo de relajación de la política monetaria prudente y basado en datos, atentas a los riesgos inflacionarios, para llevar la inflación a la meta, lo que reducirá gradualmente los costos de endeudamiento.
Implementar una reforma tributaria integral: La alta carga tributaria de las empresas y la incertidumbre generada por reformas tributarias fragmentadas han desincentivado la inversión privada. Colombia necesita una reforma tributaria integral, implementada gradualmente, que genere espacio fiscal para inversiones sociales y productivas. Reducir la tasa del impuesto corporativo mientras se amplía la base del impuesto sobre la renta personal, reducir gastos tributarios innecesarios y combatir la evasión aumentaría la recaudación tributaria y mejoraría el entorno empresarial. Aumentar la eficiencia del gasto también es clave.
Reducir las barreras a la inversión privada: La afluencia récord de Inversión Extranjera Directa (IED) de 17.000 millones de USD en 2023 es una señal positiva, pero es necesario hacer más para mantener este impulso, capitalizar las tendencias de nearshoring y fomentar la inversión doméstica. El gobierno debe acelerar la implementación de asociaciones público-privadas, especialmente en proyectos de infraestructura, facilitar el acceso a crédito asequible, particularmente para las pymes, y fomentar un entorno de políticas más estable y predecible. Ampliar la cobertura de los regímenes simplificados de impuestos e insolvencia y de las ventanillas únicas para más micro y pequeñas empresas reduciría significativamente los costos de cumplimiento normativo. Además, aumentar la inversión en ciencia, tecnología e innovación es importante para diversificar la economía y atraer inversiones de mayor valor agregado.
Fortalecer las capacidades fiscales y administrativas de los gobiernos subnacionales y mejorar la coordinación intergubernamental para garantizar la ejecución exitosa de proyectos de inversión pública y la convergencia regional.
Reducir la informalidad: La alta informalidad empresarial y laboral conlleva bajas tasas de ahorro nacional y una asignación ineficiente del capital, que han sido barreras importantes para la inversión en Colombia. El gobierno debe implementar una agenda de reformas que reduzca la informalidad, incluyendo la reducción a los costos de creación de empresas formales, mejorando las competencias laborales y reduciendo las contribuciones a la seguridad social para los trabajadores de menores ingresos. Esto mejorará la cobertura de protección social, aumentará la recaudación tributaria y fomentará el crecimiento inclusivo.
Impulsar la inversión no es solo una prioridad a corto plazo para Colombia, sino un elemento fundamental para lograr un crecimiento económico sostenible y un desarrollo social, desbloqueando el potencial del país y sentando las bases para un futuro más próspero y equitativo.
Unlocking Colombia’s Potential: The Imperative of Boosting Investment
Category: Colombia,Uncategorized
written by oecdecoscope | October 17, 2024
by Paula Garda and Michael Koelle, OECD Economics Department
Investment fuels the engine of economic prosperity. It drives productivity, fosters innovation, and generates formal job opportunities, all of which are essential for improving living standards. In Colombia, the total investment rate has dropped since the end of the commodity boom from 23% in 2015 to 18% in 2023, now ranking among the lowest among OECD countries (Figure, panel A), according to the 2024 Colombia Economic Survey. This low investment rate hinders Colombia’s potential growth, estimated at below 3%, and is particularly troubling as the country faces urgent needs in infrastructure, education, innovation, peacebuilding efforts, social development, and transitioning to a green economy.
The weakness in investment is also a slowing down Colombia’s current GDP growth rate (Figure, panel B). Colombia experienced one of the strongest recoveries among OECD countries from the COVID-19 pandemic, but its consumption-led growth decelerated sharply in 2023 due to tight macroeconomic policies, slowing global growth, and rising borrowing costs. Although economic activity including investment began recovering in 2024, the investment rate remains low. Several factors contribute to the investment weakness, including high credit costs, low business confidence, and uncertainty.
Figure. Weak investment is dragging down growth
Source: OECD calculations based on the OECD Economic Outlook (database).
The government has an ambitious reform agenda to raise living standards and social justice through economic diversification, an energy transition, and fostering regional convergence, but all this requires higher investment. Improving infrastructure, innovation, education, public services and formal job opportunities are needed not only to reduce entrenched inequalities, especially in remote and marginalized regions, but also to boost long-term growth. Colombia’s natural resources and biodiversity offer unique opportunities to attract green investments. Given Colombia’s limited fiscal space, attracting private investment is crucial for stepping up investment.
To reverse the downward trend in investment, and achieve stronger, resilient, and inclusive growth, the 2024 Colombia OECD Economic Survey suggests policy action in several areas:
Maintaining a strong macroeconomic framework. This includes continuing fiscal consolidation and complying with the fiscal rule to support public debt sustainability and foster a business-friendly environment. Monetary authorities should also maintain a prudent, data-based, easing cycle of monetary policy mindful of inflationary risks, to bring inflation to target, which will gradually reduce borrowing costs.
Implementing a comprehensive tax reform: High corporate tax burden and the uncertainty generated by frequent piecemeal tax reforms have been a deterrent to private investment. Colombia needs a comprehensive and gradually implemented tax reform to create the fiscal space for social and productive investments. Lowering the corporate tax rate while expanding the base of personal income taxes, reducing unnecessary tax expenditures in corporate, personal and consumption taxes, and tackling tax evasion would enhance revenue collection while promoting a business-friendly environment. Raising spending efficiency is also crucial.
Lowering barriers to private investment: The recent record-high Foreign Direct Investment (FDI) influx of USD 17 billion in 2023 is a positive sign, but more needs to be done to sustain this momentum, capitalise on nearshoring trends and encourage domestic investment. The government should accelerate the implementation of public-private partnerships, particularly the new generation of infrastructure projects, ensure access to affordable credit, particularly for SMEs, and foster a more stable and predictable policy environment. Expanding the coverage of the simplified tax and insolvency regimes and online one-stop shops to more micro and small firms would significantly reduce regulatory compliance costs. Additionally, increasing investment in science, technology, and innovation is crucial for diversifying the economy and attracting higher value-added investments.
Strengthening subnational government fiscal and administrative capacities and improving intergovernmental coordination are necessary to ensure the successful implementation of public investment projects and regional convergence.
Reducing informality: High business and labour informality leads to low savings rates and inefficient capital allocation which have been major barriers to investment in Colombia. The government should implement a comprehensive agenda of reforms to reduce informality by lowering the costs formal firm creation, enhancing skills, strengthening the enforcement of labour and tax laws, and lowering social security contributions for lower-income workers. This, in turn, will enhance social protection coverage, improve tax collection, and boost inclusive growth. Improving education outcomes at all levels and aligning them with labour market needs would support creating formal job opportunities and attracting investment.
Boosting investment is not just a short-term priority for Colombia—it is fundamental for achieving sustainable economic growth and social development, unlock the country’s potential and laying the foundation for a more prosperous and equitable future.
Productivity and inequality – a nexus for policymakers to tackle
Category: Uncategorized
written by oecdecoscope | October 17, 2024
By Emilia Soldani
Over recent decades many advanced and emerging economies witnessed a slowdown in productivity growth, with weaker technology diffusion and a decline in business dynamism (Andre and Gal, 2024, forthcoming). This was accompanied by persistent and pervasive inequalities in economic outcomes and opportunities. A new report by the OECD Economics Department (link) explains why the two challenges should be considered and tackled together (Soldani et al., 2024).
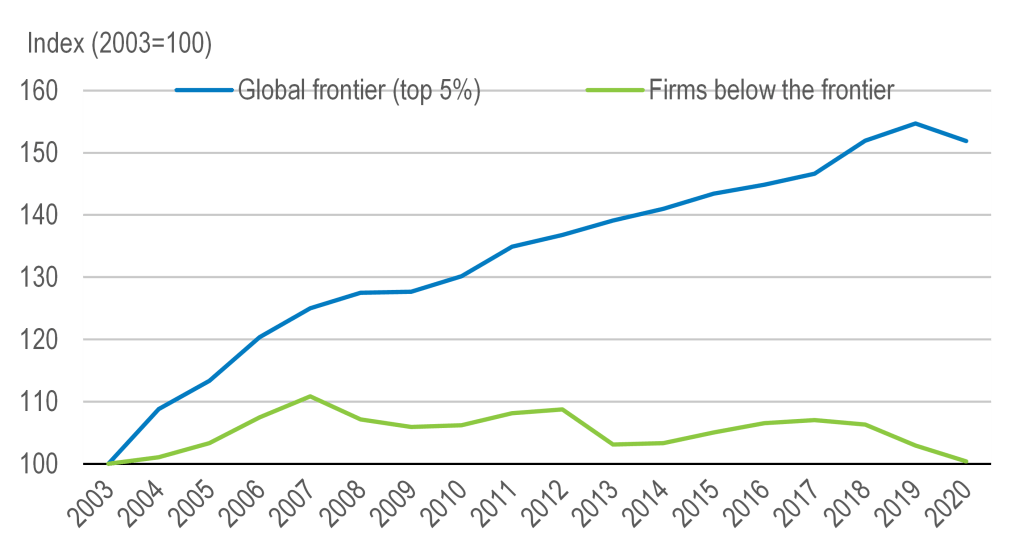
The slowdown in productivity growth (Figure 1), which at first affected advanced economies and more recently also emerging G20 economies, is associated with increasing gaps between firms at the global productivity frontier and laggard firms across and within countries, even within the same industry (Criscuolo et al., 2021; Andrews, Criscuolo and Gal, 2016).
Figure 1. The slowdown in productivity growth and catch-up
Panel A. Labour productivity average yearly growth rate, %
Panel B – The divergence in productivity dynamics across firms
Notes: In panel A, Real GDP refers to the PPP population-weighted average. Advanced economies include Australia, Canada, Germany, France, UK, Italy, Japan, Korea and the US, and emerging-market economies include Brazil, Indonesia, Türkiye and South Africa. In Panel B, the index (2003 = 100) is approximated by changes in logs. The “Global frontier” is defined as the average productivity of the top 5% firms in the global productivity distribution within each detailed industry (2-digit, NACE Rev.2). “Firms below the frontier” is the average productivity of all other firms within the industry. The chart shows the mean three-year moving average across industries, covering 24 OECD countries. Labour productivity is defined as value added per employee. More details are given in the source paper. Source: For Panel A, OECD Economics Department Working Paper number 1819. For Panel B, Andre and Gal (2024, forthcoming) based on the updated calculations described in Andrews, Criscuolo and Gal (2016) using the Orbis firm-level financial account database (2022 vintage).
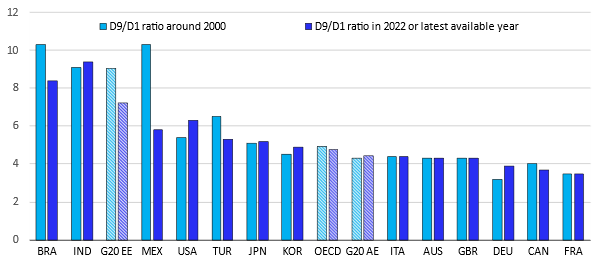
Meanwhile, while income inequality has decreased across countries (Lakner and Milanovic, 2015), it remains generally high within countries, especially in emerging economies. Across G20 economies with available data, the income ratio between the richest and poorest 10% of the population is still about significantly larger for emerging economies than advanced ones (Figure 2).
Figure 2. The income gap between the top and bottom deciles of the population remains high in emerging G20 economies
Note: The D9/D1 ratio is defined on household equivalised disposable income and refers to the total population. Note that the comparison of data over time is subject to methodological limitations (OECD, n.d.[58]). Data around 2000 refers to 2006 for Brazil and Korea; 2004 for India and Türkiye; and 2000 for the other countries. Latest data available refers to 2011 for India; 2018 for Japan; 2020 for Australia and Germany; 2021 for Italy, the UK, Canada, France, Japan, and Türkiye; 2022 for the USA, Mexico, Korea and Brazil. Source: OECD Income Distribution Database, data extracted in July 2024.
The situation deteriorated further because of the COVID-19 pandemic (Mahler, Yonzan and Lakner, 2022; OECD, 2024), which also highlighted the extent of inequalities in other dimensions: access to quality education, health care, savings and social protection. Such inequality of opportunities negatively affect the allocation of talents and social mobility, potentially further dragging down productivity growth.
The OECD report (link) summarises the empirical evidence and lessons on the policy levers available to accelerate productivity growth and make it more inclusive, drawing from a vast array of OECD studies and academic research. The main conclusion is that productivity and inequality challenges should not be looked at in separation, due to many links between the two, in either direction. For example, higher productivity and economic growth can boost aggregate savings, investment, and the accumulation of human and physical capital, which affect economic wellbeing, poverty, social mobility, and inequality. At the same time, these factors also affect occupational choices, political demand for fiscal redistribution, and social and political conflict, all of which may affect economic growth (Barro, 2000). Intertwined links amid ongoing structural changes such as the decline in labour force due to demographics, environmental disruptions, and high levels of public and private debt, suggest the importance for policy levers to target both inequality reduction and productivity enhancement.
Based on the review of extensive research outputs, three main spheres of action to support inclusive growth emerge:
The development of skills and the efficient matching of workers to firms can be supported by policies to improve access to quality education and upskilling at every age and to reduce labour market insecurity and informality.
Policies to curb market power in labour and product markets: these may lead to double dividends by improving job quality and workers wellbeing, while also boosting growth-enhancing business dynamism.
Enhancing the effectiveness, progressivity and equity of taxes and transfer systems. International cooperation, for instance in trade and taxation, should reinforce and support the efforts made at the national level.
The importance of business dynamism to boost productivity is best understood when noting that the productivity gap between laggard firms and those at the productivity frontier, which explains a considerable portion of the productivity growth slow-down, is higher in economic sectors characterised by stark barriers to business entry and dynamism and by higher market concentration (Calvino, Criscuolo and Verlhac, 2020). This suggests that policies supporting business dynamism may accelerate the diffusion of frontier technologies and management practices and promote aggregate productivity growth.
The need for policies to curb employers’ labour market power and reduce informality is apparent in light of the widespread decoupling between the growth of labour productivity and wages. Indeed, the growth of average and median wages over recent decades has been limited. Over the same period wage dispersion has increased as wages have grown relatively more at the top of the income distribution (Schwellnus, Kappeler and Pionnier, 2017), despite some signs of a partial reversal in wage inequality through 2022 and 2023. Here, too, policies to support education and upskilling may help reduce wage dispersion while also enhancing productivity growth (OECD, 2021; OECD, 2020), including by ensuring that the workforce has the right skill sets to face the ongoing transitions (OECD, 2022; Causa et al., 2022).
In the context of education policies, the latest OECD PISA scores highlight the need to improve inclusiveness and effectiveness. Average students’ performance starkly deteriorated between 2018 and 2022, and the gaps in scores along the socioeconomic dimension increased, with disadvantaged students falling further behind.
While the task may seem daunting, the stakes in reducing inequality and promoting inclusive growth exceed purely economic considerations: the combination of slow growth, persistent inequalities, especially in economic opportunities, may further erode social cohesion and the support for democratic institutions (Rodrik, 2017; Guriev and Papaioannou, 2022; Rodrik, 2021) and spark support for protectionist measures and hostile sentiments against international trade (Millot and Rawdanowicz, 2024; Criscuolo et al., 2022).
References
Andre, C. and P. Gal (2024, forthcoming), Reviving productivity growth: A review of policies.
Andrews, D., C. Criscuolo and P. Gal (2016), “The Best versus the Rest: The Global Productivity Slowdown, Divergence across Firms and the Role of Public Policy”, OECD Productivity Working Papers, No. 5, OECD Publishing, Paris, https://doi.org/10.1787/63629cc9-en.
Calvino, F., C. Criscuolo and R. Verlhac (2020), “Declining business dynamism: Structural and policy determinants”, OECD Science, Technology and Industry Policy Papers, No. 94, OECD Publishing, Paris, https://doi.org/10.1787/77b92072-en.
Causa, O. et al. (2022), “The post-COVID-19 rise in labour shortages”, OECD Economics Department Working Papers, No. 1721, OECD Publishing, Paris, https://doi.org/10.1787/e60c2d1c-en.
Criscuolo, C. et al. (2021), “The human side of productivity: Uncovering the role of skills and diversity for firm productivity”, OECD Productivity Working Papers, No. 29, OECD Publishing, Paris, https://doi.org/10.1787/5f391ba9-en.
Criscuolo, C. et al. (2022), “Are industrial policy instruments effective?: A review of the evidence in OECD countries”, OECD Science, Technology and Industry Policy Papers, No. 128, OECD Publishing, Paris, https://doi.org/10.1787/57b3dae2-en.
Guriev, S. and E. Papaioannou (2022), “The Political Economy of Populism”, Journal of Economic Literature, Vol. 60/3, pp. 753-832, https://doi.org/10.1257/jel.20201595.
Lakner, C. and B. Milanovic (2015), “Global Income Distribution: From the Fall of the Berlin Wall to the Great Recession”, The World Bank Economic Review, Vol. 30/2, pp. 203-232, https://doi.org/10.1093/wber/lhv039.
Mahler, D., N. Yonzan and C. Lakner (2022), The Impact of COVID-19 on Global Inequality and Poverty, The World Bank, https://doi.org/10.1596/1813-9450-10198.
Millot, V. and Ł. Rawdanowicz (2024), The return of industrial policies: Policy considerations in the current context, https://doi.org/10.1787/051ce36d-en.
OECD (2022), OECD Employment Outlook 2022: Building Back More Inclusive Labour Markets, OECD Publishing, Paris, https://doi.org/10.1787/1bb305a6-en.
OECD (2021), The Role of Firms in Wage Inequality: Policy Lessons from a Large Scale Cross-Country Study, OECD Publishing, Paris, https://doi.org/10.1787/7d9b2208-en.
Rodrik, D. (2021), “Why Does Globalization Fuel Populism? Economics, Culture, and the Rise of Right-Wing Populism”, Annual Review of Economics, Vol. 13/1, pp. 133-170, https://doi.org/10.1146/annurev-economics-070220-032416.
Rodrik, D. (2017), Populism and the Economics of Globalization, National Bureau of Economic Research, Cambridge, MA, https://doi.org/10.3386/w23559.
Schwellnus, C., A. Kappeler and P. Pionnier (2017), “Decoupling of wages from productivity: Macro-level facts”, OECD Economics Department Working Papers, No. 1373, OECD Publishing, Paris, https://doi.org/10.1787/d4764493-en.
Does carbon leakage through international trade reduce the effectiveness of carbon pricing policies?
Category: Climate,Uncategorized
written by oecdecoscope | October 17, 2024
By Jonas Teusch, Filippo Maria D’Arcangelo, Tobias Kruse, and Mauro Pisu
Carbon leakage, whereby foreign emissions increase because of domestic climate policies, blunts the effects of domestic climate policies on global emissions. Traditionally, the empirical literature has not found much evidence of carbon leakage (e.g. Venmans et al, 2020). However, carbon prices were historically low and most existing evidence is limited to the EU’s emissions trading system where free allowances may have protected the international competitiveness of EU producers in emissions-intensive trade-exposed sectors.
In our recent paper (Teusch et al, 2024), we leverage satellite data from Climate TRACE to track emissions and carbon prices for cement and steel at the plant level across 140 countries. These two sectors alone account for more than 40% of industrial greenhouse gas emissions. We then use plant-level data to estimate the effect of carbon prices on emissions. Finally, we combine these data with international product-level trade data to quantify the effect of carbon prices on emissions embodied in the international trade of steel and cement products and obtain an estimate of carbon leakage in these sectors.
The recent rise in carbon prices was uneven across countries
Carbon prices have become more common over the past years and increased noticeably (OECD, 2023; World Bank, 2024). While most of the plants covered by this study are still not subject to carbon prices, carbon pricing systems now exist around the world (Figure 1). The average plant-level carbon price across all cement and steel plants in the dataset rose by a factor of seven (from USD 1.4 per tonne of CO2e in January 2015 to USD 10.9 in December 2021). As carbon prices started from a low base, they remain low on average.
Figure 1. Carbon pricing systems now exist around the world
Note: The map depicts the carbon pricing landscape in 2021. It shows all steel, cement and aluminium plants covered by the Climate TRACE dataset. Source: Teusch et al, 2024.
The rise in carbon prices was uneven across countries, resulting in rising carbon price asymmetries. Carbon price asymmetries, computed as the average difference between the domestic carbon price and the carbon prices of trading partners (weighted by traded volumes), surged by more than 350% between 2015 and 2021, highlighting the heterogeneity of carbon price developments across countries and rising carbon leakage risk.
Carbon pricing can reduce emissions in steel and cement
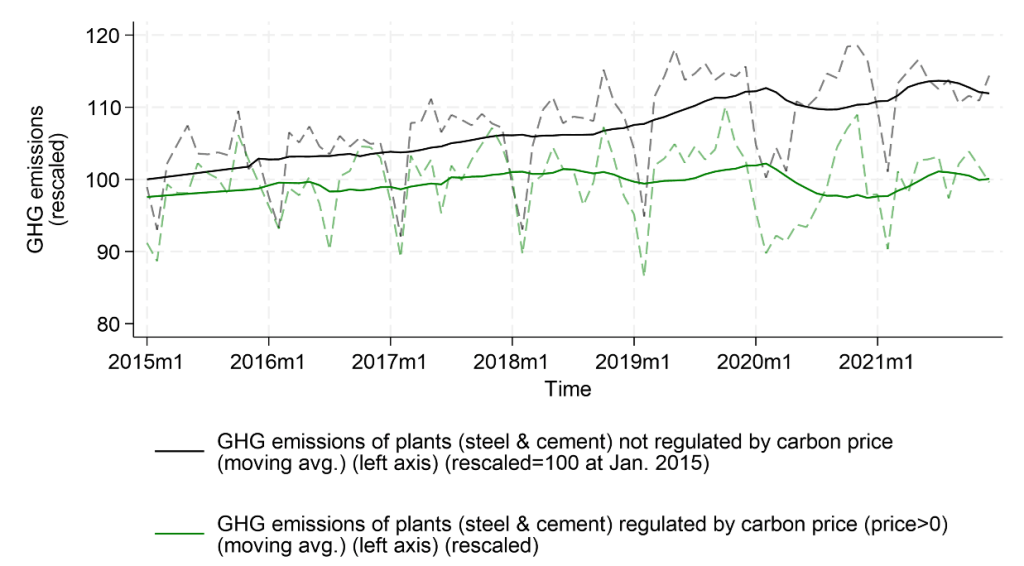
Despite their reputation as “hard-to-abate” sectors, cement and steel plants respond to rising carbon prices by reducing emissions. Emissions from plants subject to carbon prices were stable between 2015 and 2022 whereas they rose for plants not covered by carbon prices (Figure 2). Empirical results based on panel regressions (controlling for confounding factors) suggest that, on average, cement and steel plants have reduced emissions by 1.3% in response to a USD 1 per tonne of CO2 increase in carbon prices.
Figure 2: Emissions from plants facing no carbon prices increased whereas they remained stable for plants facing carbon prices
Note: The black solid line shows the 12-month moving average GHG emissions of plants (in steel and cement sectors) never regulated by carbon pricing rescaled to equal 100 in January 2015. The dashed grey line shows the average monthly GHG emissions of those plants. The green solid line shows the rescaled 12-month moving average GHG emissions of plants (in steel and cement sectors) regulated throughout the sample (i.e. that are always regulated by carbon pricing). The dashed green line shows the average monthly GHG emissions of those plants. The graph excludes plants that switch treatment status in the sample period. Source: Teusch et al, 2024.
Carbon leakage through international trade offsets a moderate share of domestic emission reductions
On average carbon leakage through international trade offsets 13% of domestic emission reductions. Leakage, which we estimate using a gravity model of international trade, is driven by volume effects (increased imports); there is no evidence that countries import more from dirtier countries. One possible explanation for the relatively moderate leakage effect is that these sectors receive free allocation and other forms of government support (Garsous, Smith and Bourny, 2023), which reduces the carbon leakage risk. Another complementary explanation is that carbon price asymmetries across countries are not yet large enough to affect international trade flows in a more significant manner.
Carbon pricing may lead to additional spillovers
Carbon pricing asymmetries can lead to international spillovers in addition to carbon leakage through international trade. For example, carbon pricing can lead to downstream leakage, e.g. when carbon pricing on steel production impacts downstream manufacturing activities and locational choices. Carbon pricing can also induce positive spillover effects, for example via the diffusion of cleaner production techniques (including from regulated to unregulated facilities). Considering the importance of technology diffusion for reducing global emissions, innovation-related spillovers would merit further work.
Estimating and quantifying these spillovers is crucial to better understanding the impact of carbon prices asymmetries and mitigation policies on global emissions. Timely and granular sources of data covering emissions and output at product level are key elements to progress in this area and inform policies.
Venmans, F., J. Ellis and D. Nachtigall (2020), “Carbon pricing and competitiveness: are they at odds?”, Climate Policy, Vol. 20/9, pp. 1070-1091, https://doi.org/10.1080/14693062.2020.1805291
Malaysia’s economy has achieved an impressive growth since the 1960s, with average yearly growth of over 6%. It has been ahead of regional peers in terms of per capita incomes and has been able to consolidate this lead. While incomes were only one-third of the World Bank’s threshold for high-income countries in 1989, it has approached and is set to surpass that threshold by 2028 (Figure 1).
Figure 1. Rapid economic development has boosted Malaysia close to high-income status
Source: World Bank, GNI, Atlas method (current USD).
Strong growth has also propelled impressive social progress. Poverty has declined consistently over the last decades, and poverty rates have narrowed across different ethnic groups. Income inequality has also fallen, and labour force participation has trended upwards. At the same time, more could be done to create better and more equal opportunities in Malaysia, as highlighted in the recent OECD Economic Survey of Malaysia (OECD, 2024). Income inequality remains higher than in regional peers, and labour force participation among women remains some 26 percentage points lower than among men, partly related to difficulties of accessing affordable childcare. As incomes rise, Malaysians are likely to demand better public services and better opportunities, and this may require different policies from those that were successful in the past.
Pension coverage, for example, is narrow and inadequate. More than 60% of the population are not covered by any old-age pension scheme, and those who are often fail to receive a decent pension. As the population ages, more and more elderly Malaysians will reach retirement age without any type of old-age pension to rely on. Non-contributory social assistance pensions could help fill current coverage gaps in the future, but their current coverage and benefit levels are very low.
In the same vein, social assistance programmes could do more to support those in need. Different programmes are fragmented and poorly targeted, managed by multiple agencies at different levels of government. Benefit levels are generally too low to make a real difference for vulnerable households. Even for the lowest income decile, cash transfers augment market incomes by only around 13%, and overall spending on social assistance amounted to only 1% of GDP in 2023.
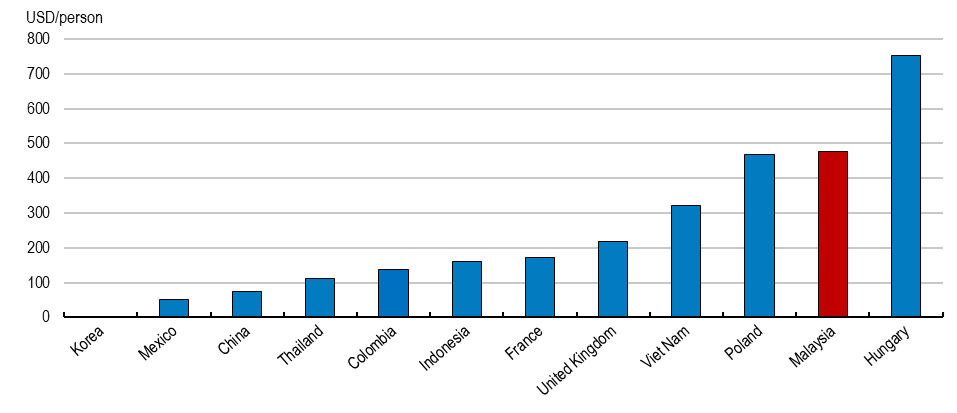
By contrast, Malaysia spent 3.5% of GDP on fossil fuel subsidies in 2023, which are counted as social assistance in its public accounts. But these subsidies are particularly ineffective as a social policy tool. Estimates suggest that the most affluent 10% of income earners receive almost three times more in fuel subsidies than the decile with the lowest incomes. Fossil fuel subsidies also provide the wrong price signal for reducing greenhouse gas emissions, and Malaysia’s fuel subsidies are particularly high in international comparison (Figure 2). Shifting spending from subsidies to pensions and well-targeted, unified social assistance benefits could support substantial improvements in social inclusion.
Figure 2. Fossil fuel subsidies per capita in selected countries, 2022
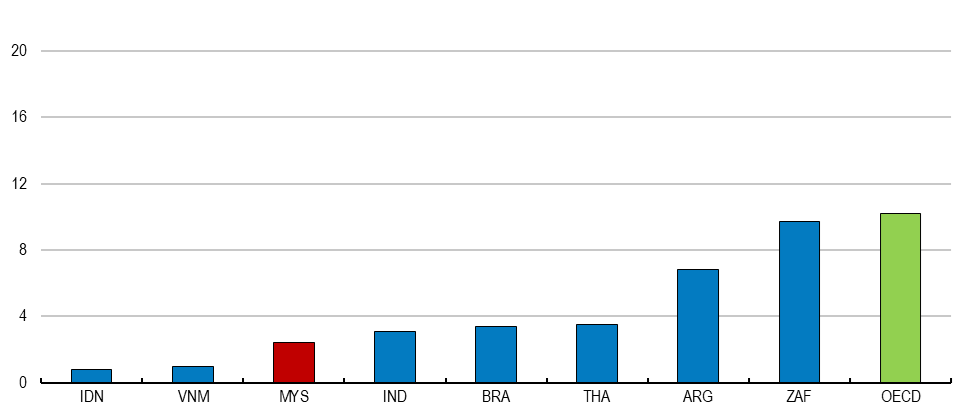
These kind of reforms could boost the effectiveness of taxes and transfers for reducing inequalities. Currently, public policies reduce income inequality by 2.4 points of the Gini coefficient, a widely used inequality measure (Figure 3). This reduction in inequality is more than what Indonesia and Viet Nam achieve, but it falls short of the 3.5 points in inequality reduction that taxes and transfers generate in Thailand, and is much less than in the average OECD country where taxes and transfers reduce inequalities by more than 10 points of the Gini coefficient.
Better labour market policies could also help Malaysia to make further progress towards higher material living standards. More than one in four workers in Malaysia work in informal jobs, particularly older and less educated ones. Incentives for formal job creation could be improved through less rigid labour market regulations and by exempting low-wage workers from mandatory contributions to the pension fund, especially as non-contributory basic pensions are expanded. Even for those with higher skills, labour market reforms could improve job quality and strengthen productivity. Many people, particularly recent tertiary graduates, work in occupations that do not match their skills. Better alignment of tertiary education with labour market needs, a reorganisation of vocational education and training and more investment into adult education could help to reduce skills mismatches.
Delivering better public services and creating better opportunities will also call for substantial reforms on the fiscal side. Spending existing public resources in a more effective way should be a first step, for example by phasing out fossil fuel subsidies, but also through a better coordination of fragmented policy programmes in areas such as social protection or support to small and medium enterprises. Beyond these improvements in spending efficiency, there may also be a case for raising additional public revenues. Current tax revenues remain below 12% of GDP, which is low even in a regional comparison, and places tight limits on what Malaysia’s public sector can deliver. Establishing a well-designed value added tax, broadening the tax base of personal income taxes and improvements in tax administration would be ways to expand the resources available. Providing solid financing for future spending needs that will arise as Malaysia becomes a high-income country is likely to be one of the major challenges in coming years.
Malaysia’s ascent towards a high-income economy is remarkable, with robust and resilient growth and visible improvements across many dimensions. The analysis and policy recommendations presented in the newly launched OECD Economic Survey of Malaysia (OECD, 2024) are aimed to help the country build on its past achievements and maintain a strong performance in the years to come.
References
Commitment to Equity Institute (2023). Standard Indicators, Tulane University.