Commercial real estate markets after the end of “low for long”: Risks and policy challenges

– By Caroline Roulet –

Real estate assets are the largest store of wealth in the OECD countries, valued at USD 111 trillion in 2022, nearly twice the level of GDP. Commercial buildings, plus other corporate structures, at an estimated USD 38 trillion, account for more than one-third of these assets. Conditions in many commercial real estate markets have worsened significantly since 2022, when the long period of low interest rates came to an end. Recent OECD work documents sizeable declines in commercial property prices, particularly in the United States and the euro area, driven by both higher global interest rates and changes in demand induced by growing teleworking and e-commerce. At the same time, the financing costs of property developers and risk premia for low-rated commercial mortgage-backed securities have risen, and the performance of specialised institutions such as commercial real estate investment trusts and funds has weakened.

The exposures of financial intermediaries to commercial real estate are estimated to have totalled USD 21 trillion in 2023 (Figure 1), based on available data for individual institutions across a large number of economies. Although bank loans are the largest single source of exposure, the combined exposures of diverse non-bank sources have risen over time and now exceed 50%. In particular, commercial real estate investment trusts and funds have become increasingly important over the past fifteen years, especially in advanced economies. Debt accumulation by commercial real estate investment trusts and property developers is reflected in a substantial increase in outstanding bonds and syndicated loans, and a growing reliance on private capital.

Figure 1. Worldwide financial sector exposures to commercial real estate are very large
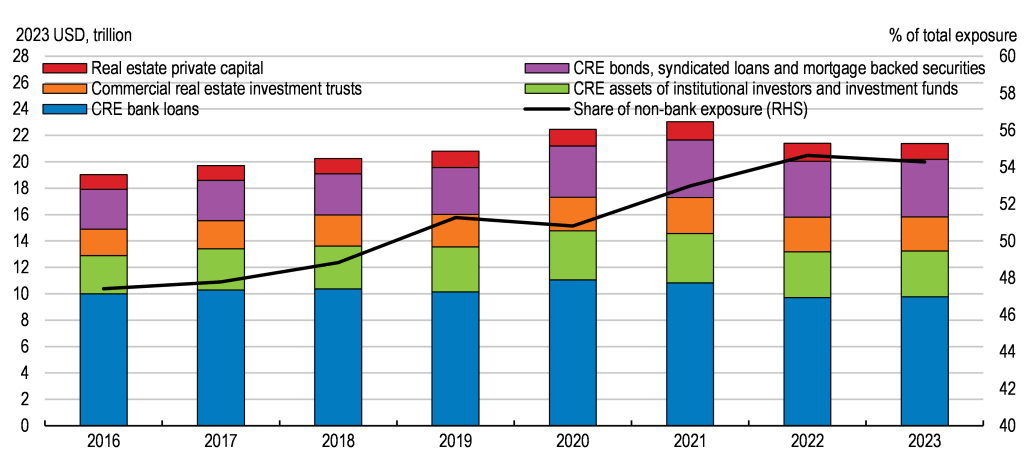
Note: This figure provides estimates of commercial real estate (CRE) exposures for both bank and non-bank financial intermediaries. Data are expressed in trillion US dollars adjusted by 2023 US consumer price index. See note of figure 1.6, Box 1 and Annex B in Roulet (2024) for further details.
Source: IMF FSI, OECD National Accounts, National central banks and office statistics, LSEG, Pitchbook, OECD calculations.

Commercial property developers face mounting credit quality challenges, with the amount of low-credit-quality debt recently surpassing levels in the global financial crisis (Figure 2, Panel A). Developers in emerging-market economies are particularly affected, but credit quality has also deteriorated in advanced economies (Figure 2, Panel B). Moreover, the maturity profile of bond and syndicated loan redemptions implies substantial refinancing needs in the next few years, particularly for leveraged borrowers (Roulet, 2024). Delinquency rates on commercial mortgage-backed securities are also rising, amidst a growing number of missed mortgage payments by borrowers with commercial real estate loans.

Figure 2. Across the world, the quality of property developers’ debt has often deteriorated

Note: Four types of companies are shown in the chart. Corporates with a “sound credit risk profile” are ones with a leverage ratio (measured by the ratio of debt to EBITDA) between zero and 5 and an interest coverage ratio (ICR) higher than 2. The other three types of companies all have a leverage ratio either above 5 or below zero (due to negative EBITDA). Among these, “leveraged distressed” corporates have an ICR lower than 1, “leveraged at risk” corporates have an ICR between 1 and 2, and “moderately leveraged” an ICR higher than 2. Debt data include the total debt reported on the liability side of the balance sheet. See Annex B in Roulet (2024) for further details.
Source: LSEG, OECD calculations.

These developments raise potential financial stability risks, reflecting the growing exposures of various interconnected financial intermediaries. The higher financing costs and lower earnings of commercial property developers could raise banks’ non-performing loans and generate losses for non-bank financial intermediaries. Significant losses at specialised commercial real estate investment trusts could spread to real estate investment funds, raising investor redemptions and potentially triggering downward price spirals from fire sales. Insurance companies’ solvency ratios and pension funds’ liquidity could also be adversely affected by losses, both directly from their commercial real estate loans and indirectly through their linkages with real estate funds.

Policy challenges remain in assessing and mitigating risks from commercial real estate exposures. Significant data gaps hinder accurate analysis of the exposures of many financial intermediaries. For instance, breakdowns of commercial real estate exposures by asset classes and type of collateral are often missing. Existing macroprudential tools in commercial real estate finance, such as capital buffers or loan-to-value ratios, are also primarily bank-based, with limited measures available to mitigate risks in non-banks. The use of these tools can also vary across jurisdictions.

Many policy tools to help monitor and mitigate financial stability risks from the commercial real estate sector need to be developed further, including:

  • Cross-country agreement on a precise definition of commercial property assets and the development of common qualitative and quantitative indicators (ESRB, 2023a).
  • Increased evaluation of the credit quality and loss-provisioning of commercial real estate portfolios held by both banks and non-bank financial intermediaries (ECB, 2023; ESRB, 2023b; IMF, 2024), along with enhanced stress-testing of banks. Such tests should take account of indirect exposures to commercial real estate through the bank funding of non-banks.
  • Improved assessment and mitigation of liquidity mismatches and leverage risks for institutional investors and real estate investment funds, including constraints on redemptions in the latter (FSB, 2023; IOSCO, 2024).
  • Further work on borrower-based measures, especially for non-bank financial intermediaries, and enhanced international cooperation to help limit regulatory fragmentation. Such measures should include limits on excessive indebtedness and regulations to ensure solid credit quality and adequate repayment capacities.

References:

ECB (2023), Real Estate Markets in an Environment of High Financing Costs, Special Feature, European Central Bank, Financial Stability Review, November.
https://www.ecb.europa.eu/press/financial-stability-publications/fsr/special/html/ecb.fsrart202311_02~75cf0710b9.en.html.

ESRB (2023a), Vulnerabilities in the EEA Commercial Real Estate Sector, European Systemic Risk Board, January.
https://www.esrb.europa.eu/pub/pdf/reports/esrb.report.vulnerabilitiesEEAcommercialrealestatesector202301~e028a13cd9.en.pdf.

ESBR (2023b), Macro-financial scenario for the 2023 EU-wide banking sector stress test, European Systemic Risk Board, January.
https://www.eba.europa.eu/sites/default/files/document_library/Risk%20Analysis%20and%20Data/EU-wide%20Stress%20Testing/2023/Scenarios/1051432/2023%20EU-wide%20stress%20test%20-%20Macro%20financial%20scenario.pdf.

FSB (2023), Revised Policy Recommendations to Address Structural Vulnerabilities from Liquidity Mismatch in Open-Ended Funds, Financial Stability Board, December.
https://www.fsb.org/uploads/P201223-1.pdf.

IMF (2024), The Last Mile: Financial Vulnerabilities and Risks, Global Financial Stability Report, Chapter 2, April.
https://www.imf.org/en/Publications/GFSR/Issues/2024/04/16/global-financial-stability-report-april-2024.

IOSCO (2024), “Revised Recommendations for Liquidity Risk Management for Collective Investment Schemes”, Consultation Report, The Board of the International Organization of Securities Commissions, November.
https://www.iosco.org/library/pubdocs/pdf/IOSCOPD770.pdf.

Roulet, C. (2024), “Commercial real estate markets after the end of “low for long”: risks and policy challenges”, OECD Economics Department Working Papers, No. 1829, OECD Publishing, Paris.
https://www.oecd.org/en/publications/commercial-real-estate-markets-after-the-end-of-low-for-long-risks-and-policy-challenges_0f9ae118-en.html.


Resilience in uncertain times

By Laura Betschka, Natalia García Soto and Max Glanville.

This blog is based on the editorial and Chapters 1 and 2 of the OECD Economic Outlook released in December 2024.

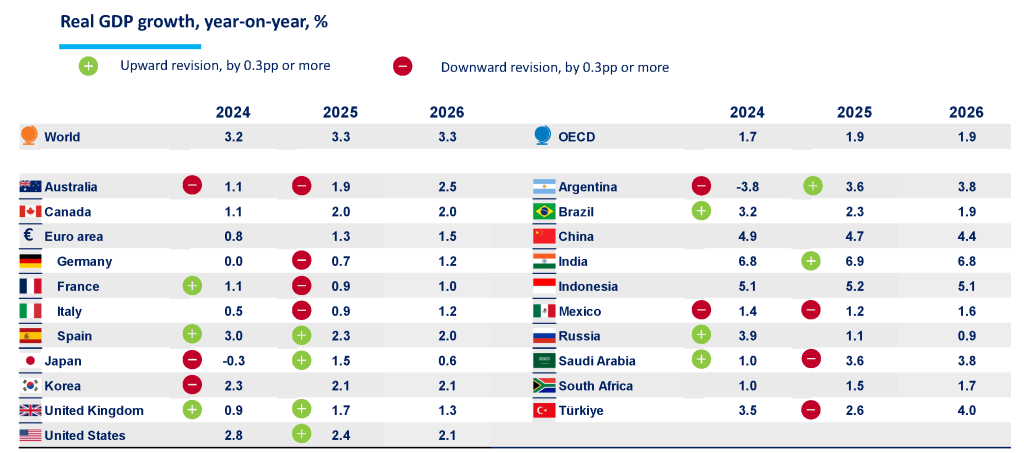
In the past few years, the global economy has demonstrated remarkable resilience despite being subject to major shocks, such as the pandemic and an energy crisis. Outcomes have varied significantly across countries. In the United States, growth remained particularly solid, fuelled by private consumption and real wage gains. On the contrary, many other advanced countries, especially in Europe, experienced more sluggish growth or even contractions. Indonesia and India have continued to grow strongly. In our recently published OECD Economic Outlook we project world GDP growth at 3.2% before edging up slightly to 3.3% in 2025 and 2026 (Figure 1).

Figure 1. GDP projections from the OECD Economic Outlook November 2024

Note: Revisions relative to the latest estimates from the May 2024 Economic Outlook. India projections are based on fiscal years, starting in April. World and OECD aggregates use moving nominal GDP weights at purchasing power parities.
Source: OECD Economic Outlook 116 databases; and OECD Economic Outlook 115 database.

Inflation has returned to central bank targets in the majority of the advanced and emerging-market economies covered by the OECD Economic Outlook. At the same time, labour markets are easing but remain generally tight, with unemployment rates still near historical lows in many countries. This labour market tightness, along with falling inflation, has led to solid real wage growth in many countries. Yet, in many advanced economies consumption growth remains subdued. A contributing factor is that consumer confidence on average remains low in both advanced and emerging market economies. Research in the OECD Economic Outlook indicates that elevated food and energy prices weigh particularly on consumer sentiment, as households are particularly sensitive to these essential expenses. In many countries, the costs of food and energy have increased more than household incomes since before the COVID-19 pandemic, leading to a higher cost of living.

 The relatively benign baseline outlook masks significant downside risks:

  • Rising trade tensions: Trade has been a fundamental driver of global growth, job creation and declining poverty in the past decades.  Rising trade tensions and an increase in protectionism might disrupt supply chains, raise consumer prices, and negatively impact growth.
  • A renewed escalation of geopolitical tensions and conflicts could disrupt trade and energy markets, potentially fuelling  inflation and constraining economic growth.
  • High levels of public debt: Some emerging market economies and low-income countries are now in debt distress or are at high risk of it. Public debt is also a pressing concern for advanced economies. Ageing populations, increased spending on defence and the investments needed for the green transition amplify these challenges.
  • Financial market volatility: Downside surprises may prompt sharp equity and bond market corrections, heightening volatility and systemic risks, particularly in the increasingly interconnected network of non-bank financial institutions.

Policy has a pivotal role to play in managing risks and unlocking prospects for strong, resilient and sustainable growth. This requires concerted action on monetary, fiscal, and structural policies.

As inflation pressures decline further, central banks should continue to ease monetary policy. Still, central banks need to act cautiously, considering incoming data and thoroughly assessing policy actions. Failing to durably contain inflation would increase the risks to growth and real incomes. 

Governments need to put in place credible fiscal consolidation strategies. Fiscal prudence is crucial amid high public debt levels and rising spending pressures. Governments must balance easing fiscal strains with sustaining economic growth.  

A Special Chapter of the recent OECD Economic Outlook focuses on labour shortages – an important challenge in many economies. Labour and skill shortages have risen over the past decade and intensified during the pandemic. Although labour markets are easing, shortages persist in many sectors, especially health and long-term care and information technology. On average, one out of four firms in OECD countries report severe labour shortages, defined as difficulties filling all or most vacancies. Such shortages, particularly in technology-intensive firms, hinder business expansion and adoption of productivity-enhancing innovations. Population ageing, which leads to a shrinking labour force, risks further exacerbating the labour shortage problem.

To reduce growth bottlenecks from labour shortages, key policy priorities include up-skilling and re-skilling of the workforce, with a focus on lifelong learning and digital skills training to improve skills supply and address mismatches. In addition, policies to increase the participation of women, such as the provision of quality and affordable childcare facilities and the promotion of a gender balance in occupations. Targeted migration and integration policies could also increase the labour supply, including easing restrictions on residence permits and speeding up the recognition of foreign diplomas. Ensuring tax and benefit systems are designed to encourage work, including through well-targeted in-work benefits and the removal of implicit biases against second earners, can further boost labour force participation. Other policy areas to be considered include promoting youth participation by stimulating vocational training and retaining older workers by promoting healthy ageing and pension reforms. 

In sum, while the global economy is expected to remain resilient, uncertainties around the central growth scenario are high. In the short term, it is essential for policymakers to ensure macroeconomic stability by ensuring that inflation is durably realigned with central bank target and ensuring sustainable public finances. In the medium term, efforts should focus on lifting growth potential through fostering multilateral dialogue and ambitious structural reforms, for example by investing in infrastructure, reform migration policies and creating a pro-competitive regulatory environment.

Reference

OECD (2024), OECD Economic Outlook, Volume 2024 Issue 2: Resilience in uncertain times, OECD Publishing, Paris, https://doi.org/10.1787/d8814e8b-en.


The rise of private credit markets: A threat to financial stability?

By Caroline Roulet.

Private credit has become an important source of financing

Private credit is a form of non-bank financing to firms, mainly through specialist funds that raise long-term capital from end-investors and offer long-term floating-rate loans to middle and smaller sized companies without access to capital markets or bank credit. End-investors such as pension funds and insurance companies value private credit for a number of reasons, including portfolio diversification, confidentiality, and potentially higher returns. Regulatory compliance costs could also be lower, although this varies by type of end-investor.

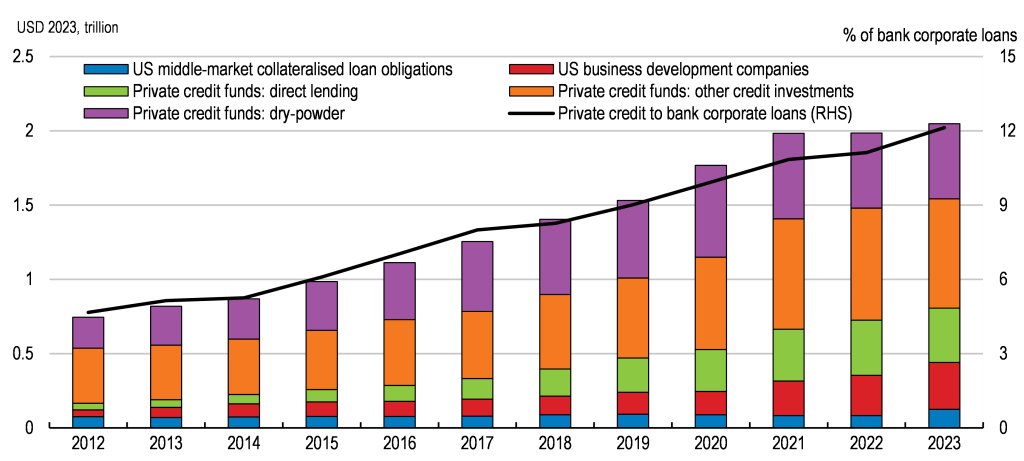
The latest OECD Economic Outlook documents the rapid expansion of this form of financing since the Global Financial Crisis and analyses the potential risks to financial stability. Private credit markets reached USD 2 trillion globally in 2023 (Figure 1). This was equivalent to 12% of bank loans to non-financial corporations, up from 5% in 2012. Private credit is very diverse but primarily US-focused, though is now also expanding rapidly in Europe and Asia.

Figure 1. Private credit continues to rise in advanced economies

Note: Business development companies (BDCs) are SEC-regulated, closed-end or publicly traded investment companies that must invest 70% of their assets in US companies valued under USD 250 million. Middle-market collateralised loan obligations (CLOs) are a segment of the US CLO market backed by senior secured loans to smaller companies that are originated in either public or private markets. Dry-powder is unallocated or unused capital maintained as cash reserves or liquid assets for future investment. Data are expressed in USD trillion adjusted by the 2023 US consumer price index and as a share of bank loans to non-financial corporations in advanced economies. See note of figure 1.25 in the December 2024 OECD Economic Outlook for further details.
Source: Houlihan Lokey; International Monetary Fund (IMF) Financial Soundness Indicators database; Pitchbook; and OECD calculations.

The expansion of private credit markets raises potential financial stability risks

The growth in private credit has become a matter of interest for central banks and other regulators due to the relative lack of visibility of the market and the underlying risks, and the extent to which private credit funds are interconnected with other financial institutions, not least banks.

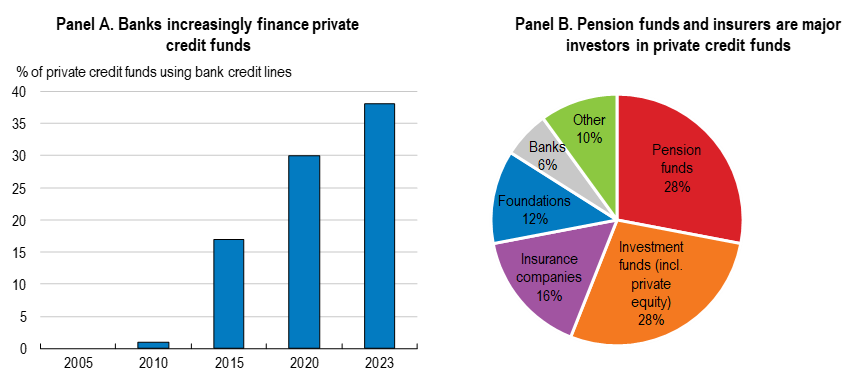
Losses by private credit providers could quickly spread to banks. Private credit funds rely increasingly on secured credit lines from banks, with these collateralised by private loans (Figure 2, Panel A). Private capital funds (such as private equity funds) have also become major investors in financial instruments that transfer risks from bank loan portfolios (so-called “credit risk transfers”). This generates risks for both private capital funds and banks if either credit quality deteriorates or if funds’ large end-investors are unable to provide the capital they have committed to.

Private credit funds are also directly interconnected to private equity funds and institutional investors (Figure 2, Panel B). For instance, large private capital funds often manage both private equity and private credit portfolios. Also, private credit funds often provide credit to companies wholly or majority-owned by private equity funds. Consequently, vulnerabilities in one segment of the private financing industry will likely spill over to the other. Liquidity pressures could also arise for end-investors, including insurance companies and pension funds, if there are unexpected capital calls by private credit funds. Such risks are more likely due to the rising amount of committed but so far uninvested capital by end-investors (so-called “dry powder”), frequently held as cash reserves by private credit funds. In the United States, systemic risk warnings are increasing due to insurers’ private credit exposures (Fournier et al., 2024). In Europe, the difficulties of an Italian insurer (Eurovita) illustrate similar risks (AMF, 2024).

Figure 2. Interconnections between private credit funds and the financial system are growing

Note: In Panel B, credit lines to private credit funds are not included in banks’ investments, and data are as of June 2022.
Source: MSCI (2023), Blackrock (2023), and OECD calculations.

More broadly, the lack of transparency in private markets is a concern. Multiple layers of leverage from borrowers to funds to end-investors are a potential source of financial instability, with risks of liquidity shortages triggering fire sales and simultaneous deleveraging. Although most private credit funds are unleveraged, some use derivatives for leverage (Federal Reserve, 2023). Some private credit funds also permit redemptions, which increases their liquidity risk.

The recent deterioration in credit quality is a further source of potential risk. A heavier debt service burden for private credit borrowers has led some to delay repayments by adding interest coupons to the loan principal. Refinancing risks are also raised, especially for the most fragile borrowers, because around 50% of the outstanding loans of US private credit funds are due to be reimbursed within three years (Cai and Haque, 2024). With defaults among highly leveraged non-financial corporations rising, there are risks that losses on private credit loans could rise sharply. Such loans are often to firms in economic sectors with low collateralisable or tangible assets and hence low recovery rates in the event of business failure.

Private loans are non-traded, which hinders proper valuation by investors and monitoring by regulators. Credit risk assessments are also uncertain in the absence of clear regulatory standards and could result in losses being underestimated. In the event of a severe shock, a rapid loss of confidence could trigger margin calls in derivatives used by private credit funds, adding further to liquidity pressures from redemptions, with risks that distressed funds default with losses for end-investors. Many liquidity management tools at private credit funds have yet to be fully tested in severe scenarios. While divestment and fire sale risks seem low at present, close monitoring is needed given significant data gaps about the sector and its often limited prudential or conduct oversight. Greater transparency in regulatory reporting would close data gaps and enable better assessment and management of risks by private credit funds and end-investors (EBA, EIOPA and ESMA, 2024; IMF, 2024). Regulatory assessments and stress-testing of end-investors should also take appropriate account of their exposures to other non-bank financial institutions (Acharya, Cetorelli and Tuckman, 2024).

References

Acharya, V., Cetorelli, N., and B. Tuckman (2024), Where Do Banks End and NBFIs Begin?, National Bureau of Economic Research, Working paper 32316, April, https://www.nber.org/system/files/working_papers/w32316/w32316.pdf

AMF (2024), 2024 Markets and Risk Outlook, June, Autorité des marchés financiers, https://www.amf-france.org/sites/institutionnel/files/private/2024-07/2024-markets-and-risk-outlook.pdf

Blackrock (2023), Private Debt: a Primer – Unpacking the growth drivers, November, https://www.blackrock.com/institutions/en-zz/insights/private-debt-primer

Cai, F., and S. Haque (2024), Private Credit: Characteristics and Risks, FEDS Notes, Board of Governors of the Federal Reserve System, February, https://www.federalreserve.gov/econres/notes/feds-notes/private-credit-characteristics-and-risks-20240223.html

EBA, EIOPA, and ESMA (2024), Joint Committee Report on Risks and Vulnerabilities in the EU Financial System, August, https://www.eiopa.europa.eu/publications/joint-committee-report-risks-and-vulnerabilities-eu-financial-system-autumn-2024_en

Federal Reserve (2023), Financial Stability Report, Board of Governors the Federal Reserve System, May, https://www.federalreserve.gov/publications/files/financial-stability-report-20230508.pdf

Fournier, A., R. Meisenzahl, and A. Polacek (2024), Privately Placed Debt on Life Insurers’ Balance Sheets-Part 2—Increasing complexity, Chicago Federal Reserve letter 494, https://www.chicagofed.org/publications/chicago-fed-letter/2024/494

IMF (2024), “The Last Mile: Financial Vulnerabilities and Risks”, Global Financial Stability Report, Chapter 2, International Monetary Fund, https://www.imf.org/en/Publications/GFSR/Issues/2024/04/16/global-financial-stability-report-april-2024#Chapters

MSCI (2023), The Rise (and Rise) of Sub Lines in Private Capital, July, https://www.msci.com/www/blog-posts/the-rise-and-rise-of-sub-lines/04219806963

OECD (2024), OECD Economic Outlook, Volume 2024 Issue 2, OECD Publishing: Resilience in uncertain times, Paris, https://doi.org/10.1787/d8814e8b-en.


The key role of food and energy inflation in shaping consumer confidence

By Patrice Ollivaud and Ben Westmore.

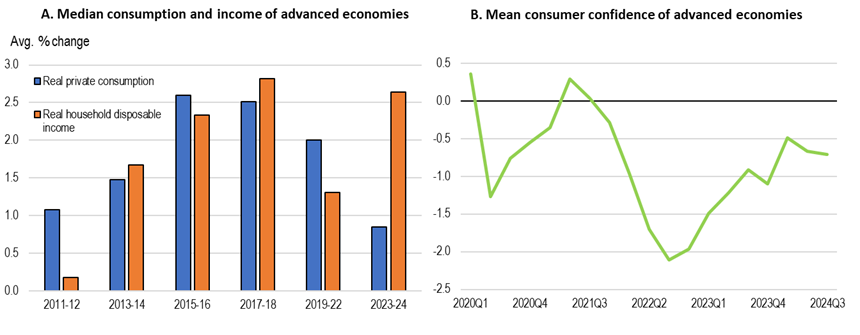
Consumption growth remains weak in OECD economies, despite buoyant real disposable income growth over the past two years (Figure 1, Panel A). Households in many countries are opting to save a greater proportion of their income and this accords with their lingering concerns regarding the economic environment. While consumer confidence is gradually recovering, it remains below long-term average levels in most economies (Figure 1, Panel B). So what have been the factors shaping consumer moods and can we expect their outlook to brighten in the near-term?

Figure 1. Private consumption has been sluggish despite strong real income gains

Note: Based on 28 advanced economies. In Panel A, median real disposable income and private consumption growth are based on the cross-country year-on-year growth rates of household disposable income and private consumption, respectively, deflated by the personal consumption deflator. In Panels B, consumer confidence data are standardised so that the long-term average and standard deviation are zero and one, respectively. The mean refers to a weighted mean using GDP in PPP as weights.
Source: OECD Economic Outlook 116 database; OECD Consumer Opinion Surveys database; and OECD calculations.

In the latest OECD Economic Outlook, this question is explored by estimating a panel model for seven OECD countries (France, Germany, Italy, Japan, Spain, the United Kingdom and the United States) over 2001-2024. The results highlight the extent to which consumer confidence is affected by inflation, along with several other aspects of economic conditions, including economic growth (proxied by the composite Purchasing Managers’ Index), the unemployment rate, interest rates and stock market values. In most of the countries in the sample, the model explains a significant proportion of changes in consumer confidence over the recent period.

However, the analysis suggests that not all types of inflation are equal in their impact on consumer sentiment. Food and energy inflation are found to have a particularly significant effect: the rise in food and energy inflation is estimated to explain three quarters of the decline in consumer confidence through the 2021-22 period in the average country in the sample. This accords with past findings that households can be more sensitive to price changes of frequently purchased items, such as groceries and energy (Anesti et. al. 2024; Binder and Makridis, 2022).

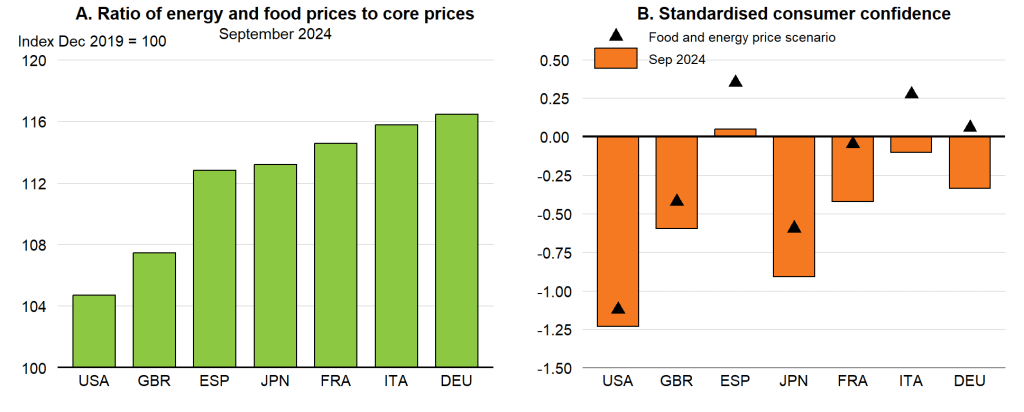
An implication of the empirical results is that a further decline in food and energy inflation could have a marked impact on consumer confidence and willingness to spend. Despite a recent decline in food and energy inflation, the level of food and energy prices relative to core consumer prices (excluding food and energy) still remains high compared with the pre‑pandemic period in the sampled countries (Figure 2, Panel A). For example, the ratio of food and energy prices to core prices in Germany in September 2024 was 16 percentage points above the level in December 2019.

An alternative model that seeks to explain the level of consumer confidence by developments in this price ratio, along with the other important economic variables from the above specification, finds the price ratio to be statistically significant (Ollivaud and Westmore, 2025). This allows a calculation of the estimated increase in consumer confidence if the price of food and energy relative to core consumer prices were to return to the pre-pandemic level. In Germany and France, such a decline could return standardised consumer confidence to around its long-run average level (Figure 2, Panel B). In contrast, the same scenario is estimated to push consumer confidence substantially above its long-run average in Italy and Spain. This reflects the comparatively high level of confidence in these countries already, helped by recent declines in their unemployment rates, larger falls in long-term interest rates over the past year and, for Spain, relatively strong economic growth. For the United States, the positive impact on consumer confidence of a retracing of the ratio of food and energy prices relative to core consumer prices is estimated to be more muted, owing to the comparatively low starting point of the price ratio in that country. Nonetheless, the results overall suggest consumer moods in many countries could brighten significantly if further falls in food and energy price inflation were to occur.

Figure 2. Further declines in the price of energy and food relative to core items would boost consumer confidence

Note: The ratio of (energy and food)/core prices is based on the personal consumption expenditure price index for the United States, harmonised index of consumer prices for euro area member states and the United Kingdom, and national consumer price indices for Japan. In Panel B, consumer confidence data are standardised so that the long-term average and standard deviation are zero and one, respectively. The “food and energy price scenario” assumes that the ratio of (energy and food)/core prices reverts to its level in December 2019, with the estimates based on coefficient estimates from a model that regresses the level of standardised consumer confidence on a lagged dependent variable, the ratio of food and energy prices to core prices, the composite PMI, long-term interest rates, the unemployment rate and the COVID Stringency Index. All variables are estimated to be statistically significant with the expected sign under this specification.
Source: Bureau of Economic Analysis; Eurostat; Statistics Bureau of Japan; OECD Consumer Opinion Surveys database; and OECD calculations.

References

Anesti, N. et. al. (2024), “Food prices matter most: sensitive household inflation expectations”, CFM Discussion Paper, No. CFM-DP2024-34, London School of Economics.

Binder, C. and C. Makridis (2022), “Stuck in the Seventies: Gas Prices and Consumer Sentiment”, Review of Economics and Statistics, Vol. 104, No. 2.

OECD (2024a), OECD Economic Outlook, Volume 2, December 2024: Resilience in Uncertain Times, OECD Publishing, Paris.

OECD (2024b), OECD Economic Outlook, Interim Report September 2024: Turning the Corner, OECD Publishing, Paris.

Ollivaud, P. and B. Westmore (2025), “Decomposing the Vibe: Exploring the Recent Drivers of Consumer Confidence”, OECD Economics Department Working Papers, forthcoming.


The heat is on: Heat stress, productivity and adaptation among firms

By Hélia Costa, Guido Franco, Filiz Unsal, Sarath Mudigonda, Maria Paula Caldas.

The pace of temperature increase has been steadily accelerating over the past decades (IPCC, 2021). The increasing frequency and intensity of heat stress episodes due to climate change poses significant threats to the global economy, including through its effects on productivity. Despite recent more stringent mitigation efforts and the expectation that climate targets will be met, temperatures are still projected to rise, raising concerns about the economic costs associated with climate change.

One key channel through which temperature affects economic outcomes is labour productivity. As temperatures increase, both the cognitive and physical capacity of workers decrease, and extreme temperatures can also increase absenteeism due to heightened health issues and transport disturbances. Beyond its direct effect, heat stress can further impact productivity through disruptions to infrastructure (such as energy), increased production costs, or disruptions to supply.

Against this backdrop, our new paper (Costa et al., 2024) presents novel cross-country firm-level evidence on the effect of heat stress – both slow onset events (gradual temperature increases) and extreme weather events (heatwaves) – on labour productivity. The analysis builds on a unique dataset gathering detailed weather and financial information for more than 2.7 million manufacturing and services firms across 23 advanced economies between 2000 and 2021, complemented with country-level information on adaptation investment. The newly constructed dataset reveals that the number of warm days and the incidence of heatwaves present an increasing pattern in the period of analysis in most locations (Figure 1).

Figure 1. The number of warm days increased in most locations in the sample period

Note: The maps show the change in the average number of days in the year where the daily maximum temperature rose above 30°C, in the last five years of the analysis period (2016-2021) relative to the first five years (2000-2004).
Source: Costa et al. (2024) based on data from Orbis and ERA-5 reanalysis data (Copernicus Climate Change Service).

How do extreme temperatures affect firm productivity?

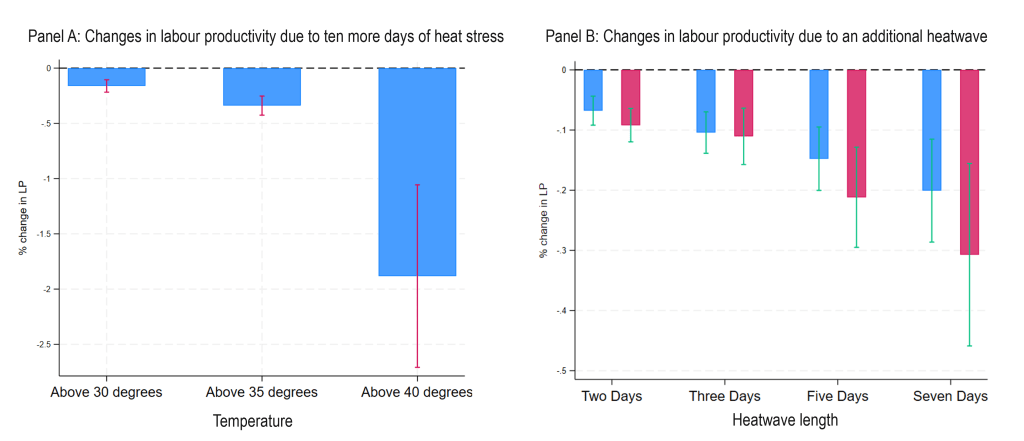
We find that both more frequent high-temperature days and the occurrence of heatwaves lead to substantially reduced labour productivity (Figure 2). Ten extra days above a temperature of 35 degrees Celsius in a year result in a 0.3% reduction in firms’ annual labour productivity. This effect is comparable, for example, to the decrease in productivity following a 5% rise in energy prices (André et al., 2023). One additional heat wave lasting at least five days, in turn, causes a 0.2% reduction in firms’ annual labour productivity.

Figure 2. Higher temperature negatively affects productivity

Note: Bars represent estimated coefficients and vertical lines the respective confidence intervals. Each bar is a different estimation. In Panel A each estimation differs with respect to the definition of the temperature variable, which is either the number of days above 30ºC, or above 35ºC or above 40ºC. In Panel B, each estimation differs with respect to the definition of heat wave, varying both the temperature threshold above which temperature has to rise for a heat wave to have occurred (90th and 95th percentile of the local historic mean) and the minimum number of consecutive days this temperature needs to have occurred.
Source: Costa et al. (2024)

This effect is more pronounced in less productive and smaller firms, and exacerbated by longer heat waves, high humidity, and low wind speeds. We also find that the negative productivity impacts exhibit a non-linear relationship with rising temperatures and persist for two years before fading. The heterogeneity of the impact across firms suggests differences in not only exposure but also vulnerability to heat stress. Larger firms, for instance, may have greater resilience to rising temperatures thanks to better financial resources, access to advanced technology, and knowledge of behavioural adaptation practices.

The analysis suggests some degree of adaptation may have already taken place. Firms in warmer locations and those more used to experiencing heatwaves exhibit lower productivity losses under similar temperature extremes. Additionally, both the implementation of National Adaptation Plans and firm-level investment in adaptation are also linked to reduced adverse effects of heat stress on productivity. However, the extent of current adaptation remains limited: higher temperatures relative to an already warm average result in more significant productivity losses, and there is no evidence of adaptation to severe extreme temperatures.

Directions for policy

In highlighting the substantial economic impacts of temperature-related changes, our analysis underscores important productivity and growth challenges posed by both gradual and disaster-driven climate impacts, providing valuable insights for policy making. First, sustained efforts in climate change mitigation are key to attenuating the increase in temperatures and the intensity and frequency of heat waves. This is particularly important given the non-linearity of costs to extreme temperatures and the limits to the effectiveness of adaptation suggested by our analysis.

Second, our results stress the urgent need to limit the economic impacts of heat stress through enhanced adaptation measures, tailored to different national and regional contexts to account for relevant heterogeneities in impacts and capacity. Where barriers to effective private sector engagement exist, like information and knowledge gaps, financial constraints, or coordination failures, policy efforts could prioritise promoting private sector adaptation. For example, while more than 60% of firms in the European Union report being impacted by the physical risks of climate change, only slightly over one-third have taken concrete steps to build resilience (EIB, 2023).

Policymakers can support firms, particularly small and medium-sized enterprises, through targeted economic incentives such as subsidies or tax breaks to encourage investments in heat-resilient infrastructure and technical measures, like green roofs or advanced cooling systems. Additionally, providing information to firms can drive behavioural changes, such as adjusting work schedules to avoid peak heat periods. Complementary direct public investment may be necessary, for example in changing urban structure, climate-proofing transport systems, or investing in adaptation technology R&D.

Lastly, heat stress is just one of many climate-related challenges confronting economies. Other slow onset and extreme weather events can pose significant risks for firm-level performance and broader macroeconomic outcomes. Our upcoming research dives into these risks from two angles: we explore how flooding impacts firm performance – focusing on output, capital, and investment – and how regional macroeconomic results are impacted by extreme weather events. Together, these efforts aim to provide a more comprehensive understanding of the economic risks posed by climate change and inform the development of robust macroeconomic structural models.

References

André, C. et al. (2023), “Rising energy prices and productivity: short-run pain, long-term gain?”, OECD Economics Department Working Papers, No. 1755, OECD Publishing, Paris, https://www.oecd.org/en/publications/rising-energy-prices-and-productivity-short-run-pain-long-term-gain_2ce493f0-en.html.

Costa, H. et al. (2024), “The heat is on: Heat stress, productivity and adaptation among firms”, OECD Economics Department Working Papers, No. 1828, OECD Publishing, Paris, https://doi.org/10.1787/19d94638-en.

EIB (2023), “European Overview – EIB Investment Survey”, European Investment Bank (EIB), Vol. ISBN: 978-92-861-5609-0, https://www.eib.org/en/publications/20230285-econ-eibis-2023-eu.

IPCC, 2021. Climate Change 2021: The Physical Science Basis, Contribution of Working Group I to the Sixth Assessment Report of the Intergovernmental Panel on Climate Change, https://www.ipcc.ch/report/ar6/wg1.


A heated issue: The unequal impacts of climate change and climate change mitigation

by Jule Hodok.

The direct impacts of climate change are unevenly distributed across countries, regions, and socioeconomic groups. Inaction will not only result in significant macroeconomic costs but also deepen existing inequalities (Intergovernmental Panel on Climate Change (IPCC), 2023). However, climate mitigation policies designed to reduce the emission of greenhouse gases (GHGs) also have distributional effects. A new report by the OECD Economics department reviews the distributional consequences of climate change and climate change mitigation as well as illustrates the trade-offs between equity, efficiency, and effectiveness in the design of climate policies.

Unequal impacts of climate change

The extent to which a specific group of people, regions and countries are affected by climate change is determined by their exposure and vulnerability:

  • “Exposure” is the presence of people, livelihoods, species, or ecosystems in places and settings that could be adversely affected by environmental degradation.
  • “Vulnerability” is the tendency to suffer from the adverse effects and/or the lack of capacity to cope or adapt after exposure to climate change (Intergovernmental Panel on Climate Change (IPCC), 2023).

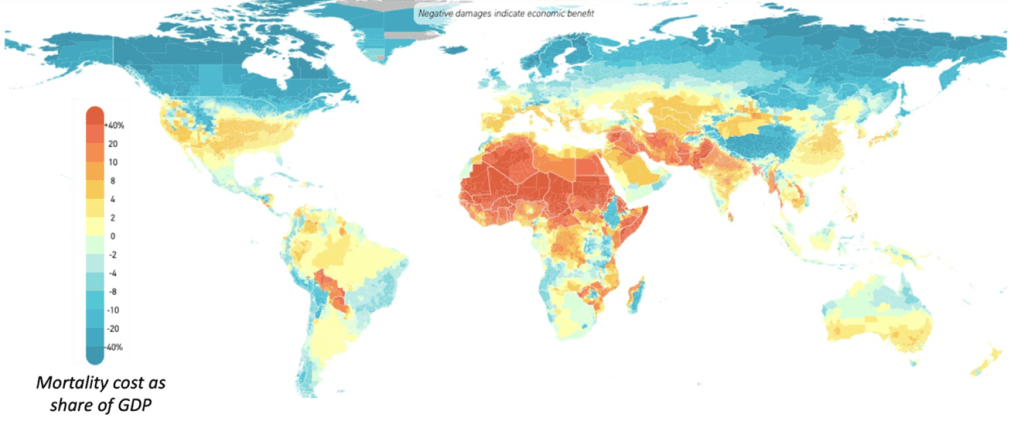
Developing countries are on average more exposed to climate change due to a combination of factors, such as often higher baseline temperatures, higher likelihood of droughts, and the reliance on climate-sensitive sectors, such as agriculture which is highly affected by temperature and precipitation levels (IPCC, 2023). They are also more vulnerable due to lower levels of adaptive capacity and resilience (Bilal & Känzig, 2024; Frankhauser, 2017) (Figure 1).

Figure 1. Predicted mortality cost as a share of GDP under a high emissions scenario

Notes: Estimates are based on a high emission scenario (RCP 8.5) for the end of the century (2080-2099). The methodology for estimating the mortality costs of climate change (temperature-related) derived from (Carleton, et al., 2022). Mortality costs are just one part of health-related impacts of climate change and account for an even smaller share of the overall costs of climate change.
Source: (Climate impact Lab, 2024)

Within countries, drawing clear, general conclusions of the impact of climate change is more difficult. Still, for example, urban areas often face higher risks of extreme temperatures and flooding (Frankhauser & McDermott, 2016), while rural communities tend to be more vulnerable due to a stronger reliance on resource-based industries (OECD, 2021). Evidence also suggests that lower-income households tend to be disproportionately affected, as they often lack the resources to adapt to climate change, e.g. by not being able to afford adaptive technologies, or lower access to quality healthcare and insurance (Bijnens, et al., 2024; Islam & Winkel, 2017).

The distributional impacts of climate change mitigation

While mitigating climate change can, over the longer term, help alleviate some of the distributional concerns related to the direct impacts of climate change, climate policies themselves have distributional consequences, from both an income and consumption perspective.

From an employment and income perspective, the climate transition will trigger a reallocation of labour and capital, from “high-emission” sectors, firms, and activities to low carbon emitters. For example, research estimates that in response to a global tax of USD 50/tCO2, fossil fuel industries – which tend not to be large employers overall – would experience a decrease in employment and output, while the largest job gains would occur in low-carbon power generation (Chateau, Bibas & Lanzi, 2018) (see Figure 2 for an overview of sector-specific effects). However, as high-emission industries tend to be regionally clustered, such labour market effects are likely geographically concentrated, potentially widening regional inequalities within countries (OECD, 2021; OECD, 2023). Additionally, low-skilled workers and those with lower educational attainment are often most negatively affected as they tend to face higher barriers to reskilling and job mobility (OECD, 2023; Chateau, Bibas, & Lanzi, 2018).

Figure 2. Change in output, employment, and gross wage by sector in response to central scenario

Notes: a carbon tax of USD 50/tCO2 is applied in all regions of the world; percentage change w.r.t reference equilibrium, 2011; OECD ENV-Linkages computable general equilibrium (CGE) is used as a tool for the analysis.
Source: (Chateau, Bibas, & Lanzi, 2018)

From a consumption perspective, policies that result in changes in relative prices will affect households differently if they have different consumption patterns. Four key findings emerge based on the review of existing literature:

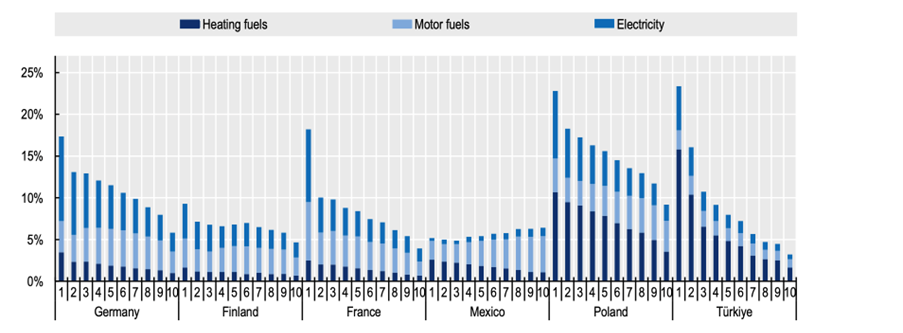
  • In advanced economies, carbon and energy taxation is mostly regressive (Flues & Thomas, 2015; Douenne, 2020; Immervoll et al., 2023). The regressivity often stems from the fact that food and some fuels are a necessity for many households making poorer households unable to reduce their consumption in response to higher prices (Figure 3) (Vandyck et al., 2023; Elgouacem, et al., 2024).
  • In developing countries, carbon and energy taxation often are progressive. This stems from the fact that a large subset of the population has low incomes and relatively limited fossil fuel energy use. Developing countries are therefore particularly confronted with the trade-off between energy affordability and addressing climate change as even a small increase in the price of energy may significantly aggravate energy poverty (Dorband et al., 2019; Steckel, et al., 2021).
  • The regressivity of policies depends on the specific policy in question and the type of fuel that is targeted. For example, transport fuel taxation is neutral in countries with higher GDP per capita and progressive in countries with lower GDP per capita (Flues & Thomas, 2015; Missbach et al., 2024). Additionally, other factors than income drive distributional effects. For example, most evidence shows that rural households are more vulnerable to carbon taxation, due to limited access to public transport (Causa et al., 2022).
  • Non-market-based policies – including bans, standards, and direct regulation – tend to disproportionately affect lower-income households and may result in equity concerns through possibly unaffordable replacement costs of the emission-intensive good (Elgouacem, et al., 2024). Limited research on subsidies and feed-in-tariffs (e.g. for electric vehicles, solar panels, or home insulation) suggests that they tend to primarily benefit higher-income households who have the required capital to invest in the low-carbon solution (Borenstein & Davis, 2016; Levinson, 2019).

Figure 3. Household expenditures on fuel and other energy, by income decile

Note: Groups 1-10 refer to income deciles. Domestic fuel includes expenditure on gas, liquified hydrocarbons, kerosene, and other liquid fuels, coal, and other solid fuels. Motor fuels includes expenditure on diesel and petrol for transportation.
Source: (Elgouacem, et al., 2024), (Screenshot, Figure 5.5 in paper)

Overall, integrating equity and fairness considerations in the design of climate policies and broader climate strategies can help manage their distributional impacts and improve the social acceptability of a climate transition.

References

Bijnens, G., Anyfantaki, S., Colciago, A., De Mulder, J., Falck, E., Labhard, V., . . . Strobel, J. (2024). The Impact of Climate Change and Policies on Productivity. SSRN Electronic Journal. https://papers.ssrn.com/sol3/papers.cfm?abstract_id=4741442

Bilal, A., & Känzig, D. (2024). The Macroeconomic Impact of Climate Change: Global vs. Local Temperature. National Bureau of Economic Research, Cambridge, MA. doi:10.3386/w32450 https://www.nber.org/papers/w32450

Borenstein, S., & Davis, L. (2016). The Distributional Effects of US Clean Energy Tax Credits. Tax Policy and the Economy, 30(1), 191-234. doi:10.1086/685597 https://www.journals.uchicago.edu/doi/full/10.1086/685597

Causa, O., Soldani, E., Luu, N., & Soriolo, C. (2022). A cost-of-living squeeze? Distributional implications of rising inflation. In OECD Economics Department Working Papers. OECD Publishing, Paris, https://www.oecd.org/en/publications/a-cost-of-living-squeeze-distributional-implications-of-rising-inflation_4b7539a3-en.html.

Chateau, J., Bibas, R., & Lanzi, E. (2018). Impacts of Green Growth Policies on Labour Markets and Wage Income Distribution: A General Equilibrium Application to Climate and Energy Policies. In OECD Environment Working Papers. OECD Publishing, Paris, https://www.oecd.org/en/publications/impacts-of-green-growth-policies-on-labour-markets-and-wage-income-distribution_ea3696f4-en.html.

Climate impact Lab. (2024, June). Retrieved from impactlab.org: https://impactlab.org/map/#usmeas=change-from-hist&usyear=2080-

Dorband, I., Jakob, M., Kalkuhl, M., & Steckel, J. (2019). Poverty and distributional effects of carbon pricing in low- and middle-income countries – A global comparative analysis. World Development, 115, 246-257. doi:10.1016/j.worlddev.2018.11.015 https://www.sciencedirect.com/science/article/pii/S0305750X18304212

Douenne, T. (2020). The Vertical and Horizontal Distributive Effects of Energy Taxes: A Case Study of a French Policy. The Energy Journal, 41(3), 231-254. doi:10.5547/01956574.41.3.tdou. https://journals.sagepub.com/doi/abs/10.5547/01956574.41.3.tdou

Elgouacem, A., Raj, A., Linden, J., O’Donoghue, C., Sologon, D., & Immervoll, H. (2024). OECD Employment Outlook 2024: Chapter 5: Who pays for higher carbon prices? Mitigating climate change and adverse distributional effects. 54th OECD Working Party on Employment. Paris: OECD Publishing. https://www.oecd.org/en/publications/oecd-employment-outlook-2024_ac8b3538-en/full-report/component-9.html#chapter-d1e24986-e93246aaf3.

Fankhauser, S. (2017). Adaptation to Climate Change. Annual Review of Resource Economics, 9(1), 209-230. doi:10.1146/annurev-resource-100516-033554 https://www.annualreviews.org/content/journals/10.1146/annurev-resource-100516-033554

Fankhauser, S., & McDermott, T. (Eds.). (2016). The Economics of Climate-Resilient Development. Edward Elgar Publishing. doi:10.4337/9781785360312 https://www.elgaronline.com/edcollchap/edcoll/9781785360305/9781785360305.00019.xml

Flues, F., & Thomas, A. (2015). The distributional effects of energy taxes. In OECD Taxation Working Papers (Vol. 2015). OECD Publishing, Paris. https://www.oecd.org/en/publications/the-distributional-effects-of-energy-taxes_5js1qwkqqrbv-en.html.

Immervoll, H., O’Donoghue, C., Linden, J., & Sologon, D. (2023). Who pays for higher carbon prices?: Illustration for Lithuania and a research agenda. In OECD Social, Employment and Migration Working Papers. OECD Publishing, Paris. https://www.oecd.org/en/publications/who-pays-for-higher-carbon-prices_8f16f3d8-en.html.

Intergovernmental Panel on Climate Change (IPCC). (2023). Climate Change 2022 – Impacts, Adaptation and Vulnerability. Cambridge University Press. doi:10.1017/9781009325844 https://www.ipcc.ch/report/ar6/wg2/

Islam, N., & Winkel, J. (2017). Climate Change and Social Inequality. UN Department of Economic and Social Affairs (DESA). New York: UN. https://www.un.org/esa/desa/papers/2017/wp152_2017.pdf

Levinson, A. (2019). Energy Efficiency Standards Are More Regressive Than Energy Taxes: Theory and Evidence. Journal of the Association of Evironmental and Resource Economists, 6(S1), S7-S36. doi:10.1086/701186. https://www.journals.uchicago.edu/doi/full/10.1086/701186

Missbach, L., Steckel, J., & Vogt-Schilb, A. (2024). Cash transfers in the context of carbon pricing reforms in Latin America and the Caribbean. World Development, 173, 106406. doi:10.1016/j.worlddev.2023.106406 https://www.sciencedirect.com/science/article/abs/pii/S0305750X23002243

OECD. (2021). The inequalities-environment nexus: Towards a people-centred green transition. In OECD Green Growth Papers (Vol. 2021/01). OECD Publishing, Paris, https://www.oecd.org/en/publications/the-inequalities-environment-nexus_ca9d8479-en.html.

OECD. (2023). OECD Skills Outlook 2023: Skills for a Resilient Green and Digital Transition. OECD Publishing, Paris, https://www.oecd.org/en/publications/2023/11/oecd-skills-outlook-2023_df859811.html.

Steckel, J., Dorband, I., Montrone, L., Ward, H., Missbach, L., Hafner, F., . . . Renner, S. (2021). Distributional impacts of carbon pricing in developing Asia. Nature Sustainability, 4(11), 1005- 1014. doi:10.1038/s41893-021-00758-8 https://www.nature.com/articles/s41893-021-00758-8

Vandyck, T., Della Valle, N., Temursho, U., & Weitzel, M. (2023). EU climate action through an energy poverty lens. Scientific Reports, 13(1). doi:10.1038/s41598-023-32705-2 https://www.nature.com/articles/s41598-023-32705-2


Derribando barreras al crecimiento en América Latina

Por Jens Arnold, Aida Caldera, Priscilla Fialho, Paula Garda, Alberto González Pandiella, Michael Koelle, Alessandro Maravalle, Dimitris Mavridis, Claudia Ramírez, Adolfo Rodriguez-Vargas y Elena Vidal, Departamento de Economía, OCDE.

América Latina enfrenta un crecimiento moderado que, aunque resiliente, no es suficiente para mejorar significativamente los niveles de vida y la convergencia en PIB per cápita a países más avanzados. En un contexto donde el crecimiento global se estabiliza apenas por encima del 3% (OECD, 2024), y existen numerosas tensiones globales ¿cómo puede la región reavivar el crecimiento?

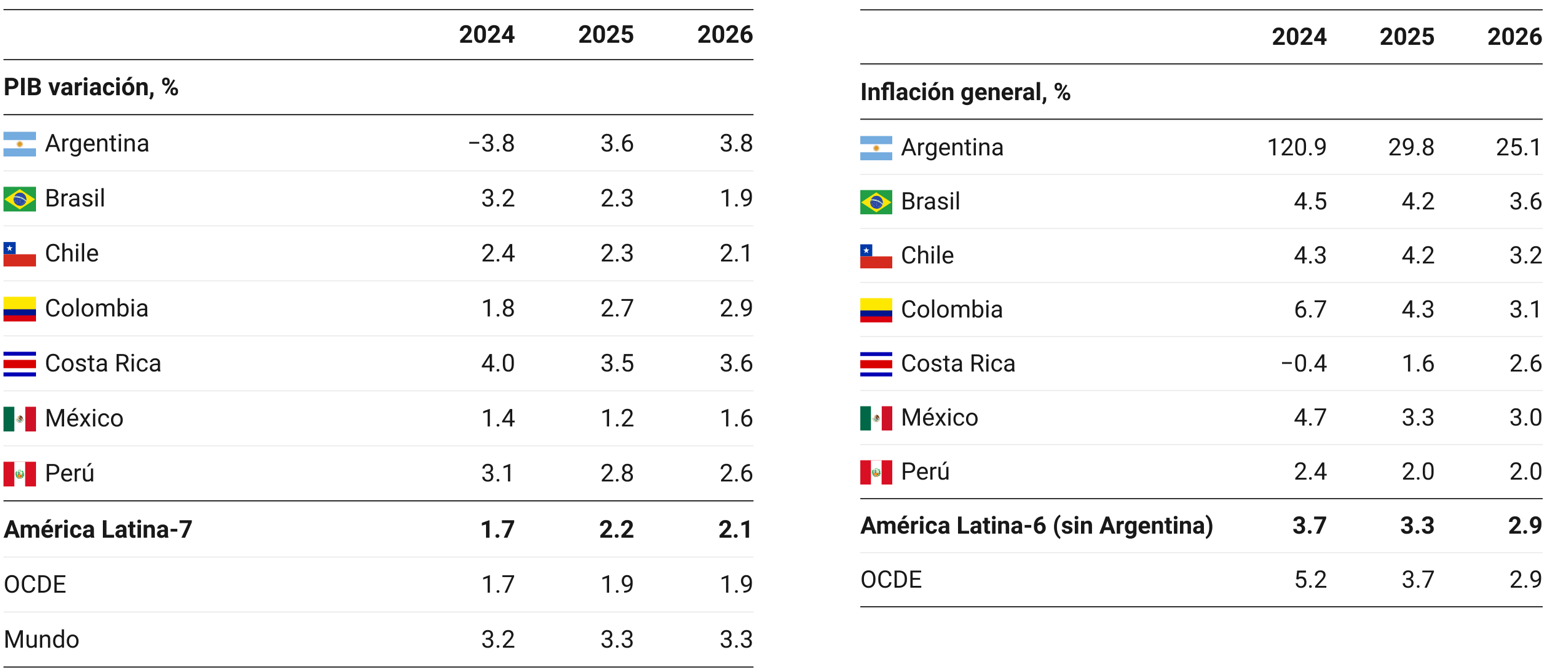
El crecimiento económico de la región sigue siendo moderado en 2024, en gran parte debido al efecto de política monetaria para frenar la inflación y a una demanda externa débil. Aunque se proyecta una ligera mejora en el crecimiento en los próximos dos años (Cuadro), gracias a la recuperación de los salarios reales, la resiliencia de los mercados laborales y la relajación de la política monetaria, este crecimiento converge hacia un crecimiento potencial bajo, insuficiente para elevar significativamente los niveles de vida.

Cuadro. Perspectivas económicas para los países de América Latina

Nota: América Latina 7 es la media ponderada por el PIB a valores de paridad del poder de compra de los 7 países en la tabla para el PIB. América Latina 6 es la media simple de los países incluidos en el cuadro para la inflación excluyendo a Argentina.
Fuente: OCDE Perspectivas Económicas No. 116, diciembre de 2024.

La inflación en América Latina sigue moderándose en la mayoría de los países, acercándose a los rangos meta fijados por los bancos centrales. Sin embargo, persisten desafíos significativos. En Brasil, un repunte inflacionario llevó a su banco central a pausar y, más recientemente, a subir las tasas de política monetaria. Aunque la mayoría de los bancos centrales han reducido sus tasas de referencia, la velocidad e intensidad varía considerablemente. La relajación monetaria continuará en la mayor parte de los países de la región, pero deberá implementarse con cautela debido a riesgos inflacionarios.

América Latina enfrenta riesgos que podrían frenar su crecimiento. A nivel global, las tensiones comerciales y geopolíticas continúan generando incertidumbre y podrían aumentar la volatilidad de los precios de las materias primas e impactar la actividad económica de la región. Además, la inflación persistente en el sector servicios podría ralentizar la relajación monetaria, tanto global como regional. En el ámbito comercial, un posible aumento de aranceles en EEUU representaría un nuevo desafío, mientras que un crecimiento menor al esperado en China podría impactar a los países más expuestos.  

A nivel doméstico, los riesgos incluyen aquellos derivados de elevados déficits fiscales, un creciente nivel de deuda pública y una alta carga de intereses, los cuales se han agravado en casi todos los países. De no abordarse oportunamente, estos factores podrían desencadenar reacciones adversas en los mercados financieros. La mayoría de los países están actualmente rezagados respecto a sus metas fiscales para 2024, lo que hace urgente implementar medidas de consolidación para situar la deuda en una senda descendente y salvaguardar la sostenibilidad fiscal. Por el lado positivo, un mayor crecimiento de los socios comerciales y una coyuntura mundial más benigna podrían impulsar las exportaciones y las entradas de capital, así como un repunte de la inversión podría impulsar el crecimiento.

A pesar de que la región ha afrontado de forma resiliente la coyuntura reciente, el crecimiento proyectado es moderado y aumentar el crecimiento de largo plazo sigue siendo el principal desafío para América Latina. Esto requiere fortalecer la inversión, que permanece débil, y el crecimiento de la productividad, un reto de larga data en la región.

Impulsar la inversión y la productividad: Reformas clave para un ambiente empresarial competitivo

Mejorar el ambiente empresarial y fomentar la competencia son medidas esenciales para impulsar la inversión y la productividad sin requerir grandes recursos fiscales. Reformar las regulaciones del mercado de productos es clave para eliminar barreras a la competencia, un área donde América Latina está significativamente rezagada, según el reciente indicador de Regulación de Producto de Mercado (PMR) de la OCDE. Por ejemplo, reducir barreras regulatorias en sectores clave, tales como industrias de red (electricidad, transporte, telecomunicaciones) y servicios, podría atraer inversiones más diversificadas y promover la innovación en la región. Además, mejorar la gobernanza de las empresas públicas ayudaría a mejorar el ambiente de negocios. 

Las reformas prioritarias deben enfocarse en reducir la carga administrativa y los costos de entrada para las empresas, especialmente en el sistema de permisos y licencias, que son altos en la mayoría de los países de la región (Grafico), para impulsar la inversión, la formalidad empresarial y la productividad. Simplificar la creación de empresas mediante ventanillas únicas donde las empresas pueden realizar todos los trámites online y de una sola vez, como en Portugal o Estonia, puede reducir costes y mejorar la eficiencia. Aunque muchos países de América Latina ya cuentan con sistemas similares, es necesario ampliar su cobertura y funcionalidad. Por ejemplo, Chile está discutiendo una reforma para simplificar permisos sectoriales a través de una ventanilla única, mientras que Argentina creó el Ministerio de Desregulación y Transformación del Estado para simplificar y agilizar trámites, reducir las cargas regulatorias y promover una administración más eficiente.

América Latina debe superar su bajo potencial de crecimiento implementando reformas audaces que derriben barreras al desarrollo empresarial, desarrollen el talento necesario, atraigan inversión y transformen la región en un terreno fértil para la innovación y el crecimiento sostenible. Los vastos recursos de energía renovable y el crecimiento del nearshoring brindan oportunidades únicas para América Latina. Invertir en infraestructura sostenible y atraer industrias verdes puede convertir a la región en un líder de sostenibilidad. El momento de actuar es ahora.

Gráfico. Mejorar el entorno empresarial y fomentar la competencia es necesario

Índice de regulación del mercado de productos, 2023

Nota: América Latina (ALC-6) es el promedio simple de Brasil, Chile, Colombia, Costa Rica, México y Perú.
Fuente: Base de datos PMR OCDE 2023-2024.

Referencias:

OECD (2024), OECD Economic Outlook, Volume 2024 Issue 2: Resilience in uncertain times, OECD Publishing, Paris, https://doi.org/10.1787/d8814e8b-en  – Reporte completo en inglés con las proyecciones macroeconómicas, los principales desafíos estructurales e información detallada por país.

Perspectivas económicas de la OCDE para países de América Latina, Diciembre 2024.

Información detallada por país: Argentina Brasil Chile Colombia Costa Rica | México Perú


Miracle or Myth? Assessing the macroeconomic productivity gains from Artificial Intelligence

By Francesco Filippucci, Peter Gal and Matthias Schief, OECD Economics Department.

Artificial Intelligence (AI) could unleash productivity gains, boost growth, and raise incomes. Indeed, many firms are looking to the technology to increase productivity, with large documented gains in workers’ performance from using Generative AI tools (e.g. Large Language Models similar to ChatGPT) in business contexts such as customer service, business consulting, or software development. Moreover, given its rapidly expanding capabilities, AI is widely heralded as a new General-Purpose Technology (GPT) that could lift macroeconomic productivity growth, as it was the case with the internet and personal computers or with previous breakthrough innovations like the steam engine and electricity (Agrawal, Gans and Goldfarb, 2019; Lipsey, Carlaw and Bekar, 2005; Filippucci et al, 2024).

But can current micro-level productivity gains really lead to large productivity gains from AI at the macroeconomic level over the next decade? To answer this question, one needs to consider what share of economic activities would experience productivity gains if AI was adopted (“exposure to AI”), and how quickly firms will adopt AI. Additionally, at the macroeconomic level, one needs to consider that productivity gains can also depend on broader economic factors, such as sectoral linkages, demand responses, or labour and capital market frictions.

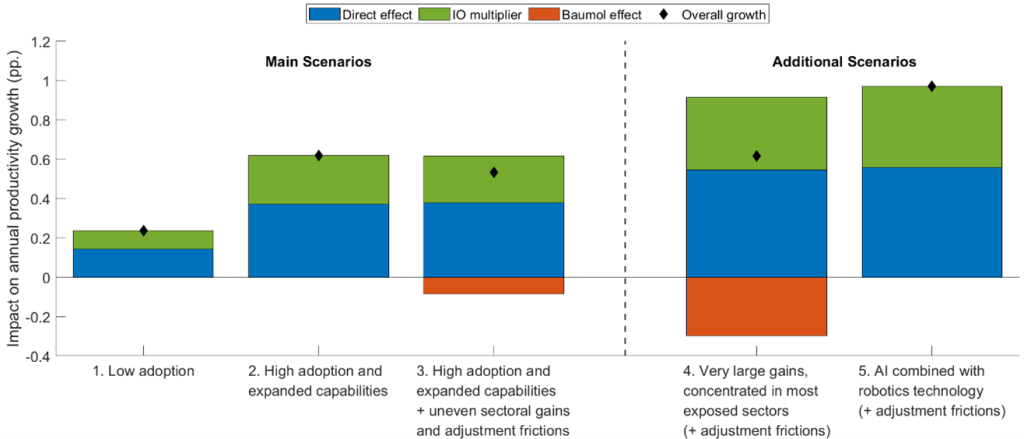
A new working paper by the OECD Economics Department (Filippucci, Gal and Schief, 2024) considers these mechanisms and assesses the macroeconomic productivity gains from AI over the coming 10-years. The results suggest that AI could contribute significantly to aggregate productivity growth over the next decade, contributing between 0.25 to 0.6 percentage points to annual Total Factor Productivity (TFP) growth in the United States (or 0.4 to 0.9 percentage points to annual labour productivity growth) in our main scenarios (Figure 1). Estimates for other economies are of similar magnitude, though somewhat lower given that adoption of AI is expected to be slower. These estimates imply a substantial improvement in the context of the weak productivity growth across the OECD over the past decades, which has been in the range of 1-1.5% per year.

Figure 1: Macro-level productivity gains from AI over

Estimated impact on annual growth rates over a 10-year horizon

Note: The bars correspond to different scenarios regarding the adoption, capabilities, and micro-level gains of AI (as in Figure 1). In scenarios 1 and 2, demand is assumed to be relatively elastic, and the factors of production (labour and capital) can reallocate freely across sectors. In scenarios 3-5 with adjustment frictions, demand is assumed to be very inelastic, and factors cannot reallocate across sectors. See more details in section 3 of Filippucci, Gal and Schief (2024).

The aggregate productivity gain from AI is the sum of three effects: 1) a direct effect of increasing productivity at the sectoral level; 2) an input-output multiplier effect as productivity gains in one sector also benefit other sectors through reduced costs of intermediate inputs; and 3) a negative reallocation effect in the spirit of Baumol’s growth disease (Baumol, 1967; Nordhaus, 2008) that arises if the sectors with limited productivity growth increase as a share of GDP.

A key insight that emerges from this analysis is that the macroeconomic impact of AI will depend primarily on the adoption speed and the degree to which AI can benefit economic activities across a wide range of sectors in the economy. Current adoption varies strongly across firms and sectors, with country-level adoption rates being generally low, in the range of 5-15%, as reported by official statistics of businesses and firm-level studies (e.g. Calvino and Fontanelli, 2023). Fast and productive integration of AI in a wider range of economic activities through expanded AI capabilities (e.g. further integration with other digital tools) is necessary for the emergence of large macroeconomic gains (Scenario 2 vs 1).

However, even with high adoption rates and expanded capabilities, general equilibrium effects working through prices could reduce the overall macroeconomic gain if the productivity benefits of AI remain concentrated in a few sectors (knowledge intensive services such as ICT, finance and professional services) (Scenarios 3 and 4). Demand for these services can become saturated, and growth will thus be limited “not by what we do well but rather by what is essential and yet hard to improve” (Aghion, Jones and Jones, 2019). In contrast, macroeconomic gains would be larger if AI gains were more widespread across sectors, for instance in the case of further integration with robotics technology, which would enable not only cognitive but also manual-intensive activities to benefit from AI (Scenario 5).

Overall, AI holds significant promise to revitalise productivity growth in OECD countries and beyond. Governments can also play a role in shaping the macroeconomic gains for AI, for example by resolving legal uncertainties around accountability, which may hold back productive AI adoption by firms (OECD, 2024a). At the same time, governments can foster a competitive environment (both in the AI-using as well as the AI-producing sectors; see Aghion and Bunel, 2024; OECD, 2024b) which is conducive to innovation and experimentation, while monitoring potential labour market disruptions and supporting workers as they transition into new roles in the AI economy (e.g. Acemoglu, Autor and Johnson; Baily, Brynjolfsson and Korinek, 2023; OECD, 2023).

References

Acemoglu, D. (2024) “The Simple Macroeconomics of Artificial Intelligence”, Economic Policy, 2024, eiae042, https://doi.org/10.1093/epolic/eiae042

Acemoglu, D., D. Autor and S. Johnson (2023), Can we Have Pro-Worker AI? Choosing a path of machines in service of minds, MIT Shaping the Future of Work Initiative, Policy Memo, https://shapingwork.mit.edu/wp-content/uploads/2023/09/Pro-Worker-AI-Policy-Memo.pdf

Aghion, P. and S. Bunel (2024), “AI and Growth: Where Do We Stand?”, https://www.frbsf.org/wp-content/uploads/AI-and-Growth-Aghion-Bunel.pdf

Aghion, P., B. Jones and C. Jones (2019), “Artificial Intelligence and Economic Growth”, in: The Economics of Artificial Intelligence: An Agenda, p. 237-82, University of Chicago Press, https://www.nber.org/system/files/working_papers/w23928/w23928.pdf

Agrawal, A., J. Gans and A. Goldfarb (2019), “Economic Policy for Artificial Intelligence”, Innovation Policy and the Economy, Vol. 19, https://doi.org/10.1086/699935

Baily, M., E. Brynjolfsson and A. Korinek (2023), Machines of mind: The case for an AI-powered productivity boom. Brookings Institution, https://www.brookings.edu/articles/machines-of-mind-the-case-for-an-ai-powered-productivity-boom/

Baumol, W.J. (1967). “Macroeconomics of Unbalanced Growth: The Anatomy of Urban Crisis?” The American Economic Review. 57 (3): 415–426. 

Calvino, F. and L. Fontanelli (2023), “A portrait of AI adopters across countries: Firm characteristics, assets’ complementarities and productivity”, OECD Science, Technology and Industry Working Papers, No. 2023/02, OECD Publishing, Paris, https://doi.org/10.1787/0fb79bb9-en.

Filippucci, F., P. Gal and M. Schief (2024), “Miracle or Myth? Assessing the macroeconomic productivity gains from Artificial Intelligence”, OECD Artificial Intelligence Papers, No. 29, OECD Publishing, Paris, https://doi.org/10.1787/b524a072-en

Filippucci, F., P. Gal, C. Jona-Lasinio, A. Leandro and G. Nicoletti (2024), “The impact of Artificial Intelligence on productivity, distribution and growth: Key mechanisms, initial evidence and policy challenges”, OECD Artificial Intelligence Papers, No. 15, OECD Publishing, Paris, https://doi.org/10.1787/8d900037-en.

Lipsey, R., K. Carlaw and C. Bekar (2005), Economic Transformations: General Purpose Technologies and Economic Growth, Oxford University Press, Oxford UK.

Nordhaus, W. D. (2008), “Baumol’s Diseases: A Macroeconomic Perspective”, The B.E. Journal of Macroeconomics, vol. 8, no. 1 https://doi.org/10.2202/1935-1690.1382

OECD (2023), OECD Employment Outlook 2023: Artificial Intelligence and the Labour Market, OECD Publishing, Paris, https://doi.org/10.1787/08785bba-en

OECD (2024a), Recommendation of the Council on Artificial Intelligence, https://legalinstruments.oecd.org/en/instruments/OECD-LEGAL-0449  

OECD (2024b), “Artificial intelligence, data and competition”, OECD Artificial Intelligence Papers, No. 18, OECD Publishing, Paris, https://doi.org/10.1787/e7e88884-en.


Impulsando la prosperidad regional: Cómo Colombia puede cerrar las brechas económicas

Por Michael Koelle, Aida Caldera Sánchez y Paula Garda, Departamento de Economía de la OCDE

Blog para dar seguimiento al lanzamiento del Estudio Económico Colombia 2024. También disponible en inglés.

Abordar las disparidades regionales en la productividad en Colombia es crucial para mejorar los niveles de vida y garantizar el bienestar económico de todos los colombianos. Las brechas regionales del PIB per cápita de Colombia se encuentran entre las más altas de la OCDE (Figura 1), impulsadas en gran medida por diferencias profundamente arraigadas en productividad, como se destacó en el reciente Estudio Económico de la OCDE sobre Colombia 2024. Estas disparidades se han desarrollado a lo largo de muchos años, exacerbadas por décadas de conflicto, un acceso desigual a la infraestructura, la educación, la capacitación y las oportunidades del mercado laboral, y también debido a desafíos institucionales.

Figura 1. Las brechas del PIB per cápita entre las regiones colombianas son amplias

Nota: El PIB per cápita es para grandes regiones TL2 (departamentos en Colombia) y para 2022 o el último año disponible.

Colombia se encuentra ante una oportunidad única para impulsar su economía y garantizar que todas las regiones se beneficien. Las tendencias globales, como los cambios en los patrones comerciales, el nearshoring y la transición ecológica, presentan desafíos, pero también grandes oportunidades. El gobierno colombiano ha hecho del desarrollo regional una parte clave de su plan para revitalizar, diversificar y transformar la economía. Para aprovechar este momento y llevar prosperidad a todas las regiones, el Estudio Económico de la OCDE sobre Colombia 2024 describe un conjunto de acciones en varias áreas de política:

  1. Mejorar la infraestructura para mejorar la conectividad: La calidad de la infraestructura de Colombia se ha visto frenada durante mucho tiempo por la falta de inversión, el conflicto armado, y la geografía del país. Por ejemplo, puede llevar más de ocho horas recorrer los 250 km que separan Bogotá de Medellín. Si bien las carreteras troncales han experimentado algunas mejoras recientes gracias a las asociaciones público-privadas, el siguiente paso es desarrollar y conectar puertos, ríos, ferrocarriles y carreteras de manera más eficiente. Además, la mejora de los caminos rurales es fundamental para conectar a las comunidades remotas con las ciudades y los mercados cercanos.
  2. Reducir la burocracia para las empresas:  Losaltos costos administrativos y las complejas regulaciones hacen difícil que las empresas, sobre todo las pequeñas, prosperen en Colombia. La expansión de las ventanillas únicas empresariales (VUE) digitales para permisos y licencias a más municipios, incluyendo más trámites y soluciones de pago digital, particularmente en áreas remotas, ayudaría a más pequeños negocios a formalizarse, crear empleos y contribuir a las economías locales.
  3. Equipar a los adultos jóvenes con habilidades para el trabajo: Muchos adultos jóvenes abandonan la escuela sin las habilidades que necesitan para tener éxito en la fuerza laboral, especialmente en áreas rurales donde los colegios están lejos. Los programas de formación profesional de segundo ciclo han sido un salvavidas para muchos, ya que ofrecen competencias valiosas y buenos resultados. La expansión de estos programas en regiones vulnerables donde las opciones educativas son limitadas puede ayudar a cerrar la brecha entre la escuela y el trabajo.
  4. Fortalecer las capacidades y las finanzas de los gobiernos subnacionales: Muchos gobiernos subnacionales, especialmente los municipios en áreas remotas y rurales, tienen unas capacidades fiscales y administrativas limitadas. Una reforma para fortalecer los mecanismos de igualación de ingresos fiscales y mejorar la recaudación directa de impuestos mejoraría las capacidades fiscales. La implementación en curso del catastro multipropósito es un paso importante en este camino. El desarrollo de la capacidad administrativa debe ir de la mano con la delegación de autoridad, la clarificación de las responsabilidades de gasto y la mejora de la coordinación intergubernamental. Estas recomendaciones están en línea con las recomendaciones de la Comisión de Descentralización de Colombia.
  5. Luchar contra la corrupción, especialmente en las zonas rurales:  La corrupción afecta más a las regiones más pobres y rurales de Colombia, erosionando la confianza y bloqueando el progreso. El fortalecimiento de las regulaciones sobre el financiamiento privado de las campañas políticas, una mejor protección de los líderes de la sociedad civil y la mejora de la transparencia en las transacciones financieras son pasos fundamentales para garantizar que el progreso beneficie a todos los colombianos.
  6. Implementar el Acuerdo de Paz para impulsar el desarrollo rural: El Acuerdo de Paz de 2017 abrió la puerta para el crecimiento en zonas afectadas por el conflicto, especialmente en las regiones rurales. Al mejorar la infraestructura y garantizar la paz, estas áreas pueden participar en el comercio y beneficiarse del fuerte turismo de Colombia. Sin embargo, el ritmo de aplicación ha sido lento y se necesitan más recursos para aprovechar plenamente los beneficios de la paz.

Cerrar las brechas de prosperidad entre las regiones de Colombia es esencial no solo para fomentar la equidad, sino también para impulsar la productividad del país. Al mejorar la infraestructura, reducir las barreras a las empresas y empoderar a los gobiernos locales, Colombia puede construir un futuro mejor en el que todos los ciudadanos, sin importar dónde vivan, puedan compartir el crecimiento del país.

Referencia

OECD (2024), Estudios Económicos de la OCDE: Colombia 2024, OECD Publishing, Paris, https://www.oecd.org/es/publications/estudios-economicos-de-la-ocde-colombia-2024_e61e16ad-es.html.


Is raising the normal retirement age a good policy? A new OECD model sheds light on employment effects

By Hermes Morgavi, OECD Economics Department

In many developed and ageing countries, pension reforms are crucial yet often controversial. One significant reform, frequently debated, is raising the normal retirement age —the age at which workers can claim their full pension benefits. As governments face the dual pressures of ageing populations and growing fiscal burdens, understanding the effects of such policies on employment is essential.

Morgavi (2024) introduced a new model that explores these effects in detail, addressing key questions: Is raising the normal retirement age worth it? How does it impact employment, particularly for older workers?

A new model for complex realities

While most cross-country empirical studies agree that raising the normal retirement age increases older-age employment, the scale of these effects often seems underwhelming—especially when compared to more detailed, single-country studies. This new OECD model seeks to bridge this gap by accounting for country-specific factors such as demographics, pension systems, and early retirement pathways.

Key findings: More than just small gains

The model introduces four major innovations:

  1. Demographic sensitivity: Incorporating population structure and retirement patterns improves accuracy, predicting stronger employment effects in countries with lower retirement ages.
  2. Retirement ages: Distinguishing between minimum and normal retirement ages allows for more precise simulations. Countries with large gaps between these ages could see substantial gains in employment rates by narrowing the gap.
  3. Private pension systems: In countries where private pensions play a significant role, workers are less sensitive to changes in the public normal retirement age. The model highlights the importance of considering these systems when designing policy.
  4. Early exit pathways: Many countries offer alternatives to early retirement through disability or unemployment benefits. These alternative early exit pathways dilute the effect of raising the normal retirement age. The model quantifies these undermining effects to give policymakers a clearer idea of the potential impact of policy changes.

A more worthwhile reform than expected

The model predicts that raising the normal retirement age can lead to much larger employment effects than predicted by previous cross-country macro models and closer to empirical research using microdata from individual countries. For example, a one-year increase in the normal retirement age is projected to raise the employment rate of those aged 55-74 by 1.5 to 2.3 percentage points, depending on the country. This is a significant improvement over earlier estimates from traditional models. Countries with the lowest employment rates, like Greece and France, stand to gain the most.

Figure 1. Model innovations give larger employment effects from raising the retirement age

Range of effects on employment rate of people aged 55-74, from raising the normal retirement age

Note: The graph compares the long-term effect on the old age employment rate and on the average age of labour market exit of a raise of the normal retirement age by 1 year among the models expressed in percentage points. On the x-axis, for each model, the main innovation introduced with respect to the previous model is shown. For the models including the effects of minimum retirement age and of the pipeline effects, these are also assumed to move by 1 year. The red horizontal marks show the median of the distribution of the effects among the countries in the sample; the blue boxes show the distance between the fifth and the ninety-fifth percentile; and the whiskers show the minimum and the maximum values. The effects are calculated using the data for year 2020 or latest year available.
Source: Author’s calculations.

Moreover, closing the gap between minimum and normal retirement ages, or eliminating early exit pathways, could lead to even greater employment boosts, especially in countries with large discrepancies.

Figure 2. Policy simulations changing the gap between the minimum and normal retirement ages

Note: This graph shows the effects of a set of policy changes by country based on the preferred model using the data for the year 2020: the effects of raising the normal retirement ages by 1 year (without any changes in the minimum retirement ages), raising the minimum retirement ages by 1 year; eliminating the early exit pathways, if present, for all the countries in the sample, based on the estimated model.
Source: Author’s calculations.

The right time to policy changes

While the model predicts more substantial long-term benefits of raising the normal retirement age than previously thought, it also emphasizes the importance of timing. Policy changes in retirement ages take time to bear fruit—often decades due to “grandfathering” provisions that protect current workers. Policymakers, therefore, need to act early to mitigate future fiscal challenges.

The OECD’s new model offers a fresh perspective on an age-old policy debate, providing countries with a more refined tool to navigate the complexities of pension reforms.

Reference:

Morgavi, H. (2024) “Is it worth raising the normal retirement age? A new model to estimate the employment effects”, OECD Economics Department Working Papers, No. 1823, OECD Publishing, https://www.oecd.org/en/publications/is-it-worth-raising-the-normal-retirement-age_5f2a3b40-en.html.

Related research and resources:

Turner, D. and H. Morgavi (2020), “Revisiting the effect of statutory pension ages on the participation rate“, OECD Economics Department Working Papers, No. 1616, OECD Publishing, Paris, https://doi.org/10.1787/3f430e2b-en.

Guillemette, Y. and D. Turner (2021), “The long game: Fiscal outlooks to 2060 underline need for structural reform”, OECD Economic Policy Papers, No. 29, OECD Publishing, Paris, https://doi.org/10.1787/a112307e-en.

OECD (2023), Pensions at a Glance 2023: OECD and G20 Indicators, OECD Publishing, Paris, https://doi.org/10.1787/678055dd-en.

André, C., P. Gal and M. Schief (2024), “Enhancing productivity and growth in an ageing society: Key mechanisms and policy options”, OECD Economics Department Working Papers, No. 1807, OECD Publishing, Paris, https://doi.org/10.1787/605b0787-en.