New OECD long-run scenarios focus on the trade-off between carbon mitigation and climate damage

by Yvan Guillemette, OECD.

Last week the OECD released the latest update of its long-term scenarios, which are designed to quantify some of the most important long-term macroeconomic trends and policy challenges facing the global economy. One central challenge is the need to accelerate the transition toward renewable energy sources to reduce greenhouse gas emissions and attenuate the impacts of climate change. How this might impact future output trajectories is the focus of this update.

The analysis considers two “business-as-usual” scenarios in which decarbonisation of the energy mix and improvements in energy efficiency continue along recent trends. The first is based on a median climate damage curve and the second on a high climate damage curve within the wide range found in the scientific literature. In the scenario with a median climate damage curve (scenario BAU1), global annual potential output growth is projected to moderate gradually from around 2.9% today to 2.7% in the first part of the 2030s, 2.1% in the early 2040s and remain at around 1.3% in the second half of the century. This moderation reflects declining working-age population growth and slowing trend labour efficiency growth in the emerging-market economies as their productivity levels get gradually closer to the frontier. China remains the world’s largest economy until the mid-2060s when it is surpassed by India.


Global annual potential output per capita growth slows by less than overall output, but still declines from about 2% today to 1¼ per cent by 2050, remaining broadly stable thereafter.


Insufficiently rapid progress on reducing greenhouse gas emissions implies continued global warming. The global average surface temperature anomaly – the increase in the global average temperature since pre-industrial times – continues to increase throughout the projection period and reaches 2½ °C in 2100. The reduction in global output associated with climate change, estimated to be approximately 1¾ per cent of global GDP today, rises to nearly 9% by 2100. With a steeper climate damage curve, at the high end of recent estimates, projected climate damages reduce global output by 36% by 2100 (scenario BAU2).

An illustration of the potential impacts of an accelerated energy transition on future output must consider two main impact channels. The first is faster carbon mitigation. This is a negative supply shock in the short to medium run (relative to a business-as-usual scenario), with the size varying across countries according to their current energy mixes and ease of substitutability. The second is the avoidance of climate-related damages, a positive supply shock in the medium to long run (again, relative to a business-as-usual scenario) that is also country specific. To highlight the uncertainty surrounding these channels, four energy transition scenarios are considered with differing assumptions about the pace at which carbon mitigation costs might decline over time and the steepness of the global climate damage curve.

  • With a median climate damage curve and a slow decline in mitigation costs (scenario ET1), global output remains lower in 2100 than in the corresponding business-as-usual scenario.
  • With a median climate damage curve and a quick decline in mitigation costs (scenario ET2), the energy transition becomes a net positive for global output around 2085.
  • With a high-damage curve and a slow decline in mitigation costs (scenario ET3), the energy transition becomes a net positive for global output in the mid-2050s.
  • With a high-damage curve and a quick decline in mitigation costs (scenario ET4), the energy transition becomes a net positive for global output in the mid-2040s. All 139 countries modelled individually are net beneficiaries by 2080.


The new long-term scenarios also incorporate several key improvements to the underlying projection framework: 1) the geographical coverage is now  global, including 139 countries modelled individually; 2) the projection horizon has been extended from 2060 to 2100; 3) the approach for long-run productivity convergence across countries has been revised; and 4) the framework now allows for the impact of climate damages on output via a global climate damage curve and country-specific climate sensitivities that can be altered to consider different assumptions and scenarios.

Selected series for the scenarios are available on the OECD Data Explorer and additional data visualizations are available on this web page.

Additional readings:

OECD (2025), “OECD global long-run economic scenarios: 2025 update”, OECD Economic Policy Papers, No. 36, OECD Publishing, Paris, https://doi.org/10.1787/00353678-en.


The market implications of industrial subsidies

By Valentine Millot, Łukasz Rawdanowicz, Jehan Sauvage and Elisabeth van Lieshout, OECD.

Do government subsidies fuel firm growth or just distort competition? Our latest study reveals that subsidies boost market share but they do not have positive effects on investment and productivity. This raises important questions about efficiency and spillovers in industrial policies.

Governments are increasingly employing subsidies and other types of industrial policies in general. This calls for not only quantifying support measures, but also investigating their market implications. The OECD has played an important role in improving transparency regarding industrial subsidies. One of notable contribution is the recent creation of the OECD MAnufacturing Groups and Industrial Corporations (MAGIC) database (OECD, 2025a). This database provides detailed information on the amount of government subsidies received by the largest global manufacturing firms in 14 industrial sectors. In our latest study, we add to the empirical literature about subsidy effects by estimating the causal impacts of government subsidies on the performance of these firms using the OECD MAGIC database (OECD, 2025b).

Subsidies have ambiguous theoretical implications and mixed empirical outcomes

The impact of subsidies on firm performance is ambiguous in theory. Subsidies can encourage investment by lowering firms’ cost of capital, with potential positive effects on productivity and competitiveness. This, in turn, can help firms gain market shares or boost profitability. However, subsidies may also support inefficient investment or reduce incentives to innovate, especially if paired with protectionist measures.

The impacts of government subsidies on market outcomes can also vary over time and across specific policy tools. For instance, one-off support measures to distressed companies during crises are likely to have a different impact on firm performance than ongoing subsidies disbursed in the context of sustained industrial policy strategies.

Ultimately, the impact of subsidies on firm performance is an empirical question. However, econometric evidence thus far tends to vary across studies, which mostly use data for one jurisdiction or one sector only (Aghion et al., 2015; Criscuolo et al., 2019; Branstetter and Li, 2023; Brandão-Marques and Toprak, 2024). Our recent paper seeks to fill this gap by providing cross-sector and cross-country evidence.

Main empirical findings

According to our panel estimations using two methods to address reverse causality, on average, across the largest manufacturing firms operating in 14 sectors and numerous countries, total government subsidies:

  • increase market shares. This impact is economically sizeable, relative to observed small annual changes in market shares, with an increase of one percentage point in subsidies as a share of revenue corresponding to between the 27th and 51st percentile of the observed distribution of annual absolute market share changes, depending on the estimation method.
  • do not seem to have an impact on firms’ investment rate but appear to increase nominal spending on investment. This implies that subsidies do not substantively shift firms’ overall tendency to invest.
  • have no or a negative effect on real productivity growth, in line with most frequent findings in the literature that subsidies do not enable firms to become more productive.
  • have no significant contemporaneous impact on various measures of profitability. This suggests that firms generally do not translate subsidies into simple windfall profits.

Given that overall subsidies appear to have no or negative impact on the investment rate and productivity, the finding that subsidies are associated with increases in market shares does not seem to be explained by efficiency gains. Instead, this relationship could result from the ability of firms receiving subsidies to cover part of their operating costs and lower their prices. This narrative is consistent with evidence that subsidies do not boost profitability.

Effects tend to vary across subsidy types and firm characteristics

For several performance indicators, the effects of subsidies differ across their types, with most frequent and consistent findings for tax concessions.

  • Several specifications point to a positive impact of tax concessions on investment levels and rates, productivity, and profitability. These effects can stem from their perceived predictability, in particular if they are part of the tax code, as compared to other forms of subsidies that are often discretionary. Moreover, they generally allow firms to make independent decisions, unlike grants tied to individual projects. Thus, tax incentives could be more conducive to investment and productivity improvements.
  • In contrast, there is some evidence that below-market borrowings lower real productivity growth and profitability. This can reflect the fact that this policy tool at times has been used to support distressed firms, when it is less likely to have positive contemporaneous effects on productivity and profitability. Below-market borrowings may just help firms to survive in the market that would not otherwise have done so without seeking to increase their productivity.

These heterogenous results for individual subsidy types suggest that the effects of government support can differ significantly depending on the nature and design of individual support measures. There is also some tentative evidence about differentiated effects of subsidies across various characteristics of firms. Some of them relate to China-based companies. For instance, the negative impact of below-market borrowings on productivity and profitability is less strong for China-based firms. This could be because, in contrast to other countries, below-market borrowings are a systemic rather than an emergency type of government support to companies.

Future research

While our paper has enhanced understanding of some market implications of subsidies, continued efforts are needed to improve the transparency and measurement of government support and to broaden the scope of analysis of possible subsidy effects.

References

Aghion, P et al. (2015), “Industrial policy and competition”, American Economic Journal: Macroeconomics, Vol. 7/4, pp. 1-32, https://doi.org/10.1787/e40b793f-en.

Brandão-Marques, L and H Toprak (2024), “A Bitter Aftertaste: How State Aid Affects Recipient Firms and Their Competitors in Europe”, IMF Working Papers, Vol. 2024/250, https://doi.org/10.5089/9798400295706.001.

Branstetter, L and G Li (2023), “The actual effect of China’s “Made in China 2025” initiative may have been overestimated, VoxEU.org, 11 August.

Criscuolo, C. et al. (2019), “Some Causal Effects of an Industrial Policy”, American Economic Review, Vol. 109/1, pp. 48-85, https://doi.org/10.1257/aer.20160034.

OECD (2025a), “How governments back the largest manufacturing firms: Insights from the OECD MAGIC Database”, OECD Trade Policy Papers, No. 289, OECD Publishing, Paris, https://doi.org/10.1787/d93ed7db-en.

OECD (2025b), “The market implications of industrial subsidies”, OECD Trade Working Papers, No. 296, OECD Publishing, Paris, https://doi.org/10.1787/e40b793f-en.


What has been holding back investment?

By Dennis Dlugosch, Max Glanville, John Hooley, Fatih Ozturk and Ben Westmore, OECD.

Despite strong corporate profits and historically low financing costs, investment has remained subdued across many OECD economies since the Global Financial Crisis (GFC), according to our recently released OECD paper. What has been holding it back?

Investment has stalled—why does it matter?

Investment is a key driver of long-term economic growth. Yet since the GFC, real investment has failed to keep pace with pre-crisis trends, weighing on potential output growth. Real investment in both advanced and emerging market economies is still roughly 20% below its pre-GFC trend (Figure 1). Even in economies with relatively strong business investment—most notably the United States—investment remains below its pre-crisis trajectory.

This slowdown reflects both major cyclical shocks—the GFC and the COVID-19 pandemic—and deeper structural forces. Moreover, these effects are interrelated: cyclical downturns can themselves bring structural change by inflicting lasting ‘scars’ on firm balance sheets, labour-market dynamics and patterns of technological adoption.

For business investment, weak demand is only part of the puzzle

In the wake of the GFC and pandemic, aggregate demand fell sharply, discouraging firms from expanding capacity. While demand has partially recovered, business investment has not. Analysis using a simple investment ‘accelerator’ model shows that subdued demand explains about one-third of the shortfall in business investment (Figure 2, Panel A). The rest is an unexplained “gap” deriving from non-demand factors weighing on investment.

The size of these unexplained gaps differs by country, from relatively low gaps, in the case of Japan and Finland, to gaps of above 30 percent of predicted investment, in the case of Australia, Korea, and the Netherlands (Figure 2, Panel B).  

Financing costs are low, profits are high. But where are the profits going?

Other traditional explanations for weak investment like high capital costs or weak profitability are not behind the slowdown. Borrowing costs and corporate tax rates have fallen. Tobin’s Q, an indicator of market incentives to invest, has remained above one in many countries, suggesting firms’ returns on investments exceed their costs. At the same time, corporate profits have surged, but businesses are investing less of their earnings in fixed capital.

Instead, firms have been accumulating financial assets or returning funds to shareholders in the form of dividends or share buybacks. In many countries, the corporate sector has shifted from being a net borrower to a net lender, meaning firms are saving more than they are investing. High “hurdle rates” suggest firms demand very high returns before committing their capital, possibly due to perceived risk or reduced competitive pressures.

Uncertainty is a major factor holding back investment

Policy-related uncertainty has risen steadily since 2016, which can discourage long-term investment. Firms tend to delay or scale back projects when they perceive uncertainty to be high. OECD estimates suggest that uncertainty may explain up to one-sixth of the investment shortfall across OECD countries, or one-quarter of the unexplained gap. And the outlook is not great; uncertainty indicators have increased dramatically since late 2024 and recent survey evidence suggests that perceived uncertainty is increasingly a major obstacle to business investment.

The digital transition and intangible economy are changing the nature of investment

Investment patterns have shifted toward digital and knowledge-based assets, such as software, data, and R&D. These assets now account for over 35% of business investment across OECD economies, up from 28% in 2000. Investment in digital capital has been particularly strong in tech-intensive industries, particularly in firms specialising in the use of artificial intelligence.

But digital assets come with challenges. They depreciate faster, meaning more investment is needed just to maintain the capital stock. Digital assets are also more difficult to finance externally, because of their limited use as collateral. These challenges push firms, especially smaller ones, to rely on retained earnings and limits investment capacity.

Market power and declining business dynamism may be reducing the pressure to invest

Another relevant part of the puzzle is the rise in market concentration and the decline in business dynamism observed across many advanced economies. As market concentration increases, investment becomes more heavily concentrated among a few large firms, while competitive pressures weaken. In this context, dominant players may prefer to buy back shares or acquire competitors rather than invest in new capacity, especially when faced with limited competition or regulatory uncertainty.

Housing investment has been lagging, leading to affordability issues

Residential housing investment has also slowed in recent decades, failing to keep up with rising demand from population growth, urbanisation and increased immigration. This supply shortfall has resulted in persistent affordability problems. Across the OECD, the share of consumption allocated to housing has increased by nearly 3 percentage points since 2000. The low levels of investment likely reflect various supply constraints, including regulatory barriers, increasing construction costs, zoning restrictions, and labour shortages.   

Public policies can help revive investment  

Reviving investment will require a range of public policy reforms tailored to the circumstances of each country. This was reflected in the policy recommendations in the country notes of the June 2025 OECD Economic Outlook. Many of these recommendations focused on promoting stronger business investment, with changes to competition policy the most commonly suggested area for reform (Figure 4). Efforts to address skills shortages, improve access to finance and reduce barriers to foreign direct investment were other priority areas. Outside of the business sector, there is scope to boost housing investment in some economies, with regulatory reforms that include the easing of land-use restrictions and rental market regulations seen to be beneficial in certain countries. Furthermore, high-quality public investment – particularly in green and digital infrastructure, research and development, health, and education – is often needed and can boost potential output growth, especially if it crowds-in private investment spending.

In the current environment of heightened policy uncertainty, improving the general clarity and predictability of economic policies is also crucial for promoting stronger investment rates. Rules-based trade policies, stable fiscal and tax regimes, clear regulatory processes and affirming climate commitments would all help address the substantial rise in policy uncertainty seen over the past decade.

References

Dlugosch, D., M. Glanville, J. Hooley, F. Ozturk and B. Westmore (2025), “Understanding the weakness in business investment: A cross-country analysis”, OECD Economics Department Working Papers, No. 1836, OECD Publishing, Paris, https://doi.org/10.1787/89bd437d-en.

OECD (2025), Economic Outlook June 2025, OECD Publishing, Paris.


Winds of change: The effects of tariffs on equity markets

By Caroline Roulet and Srdan Tatomir

The international trade landscape is changing. The new tariffs introduced by the United States (US) this year up to mid-May are estimated to have raised the effective tariff rate on US merchandise imports to 15.4%, from just over 2% in 2024, the highest rate since 1938 (OECD, 2025). This has led to retaliation from China and, to a more limited extent, Canada. At the same time, indicators of trade policy uncertainty are at the highest levels since 1960 and several magnitudes higher than in 2018-2019 (Caldara et al, 2019).

Higher tariffs and higher trade-related uncertainty are expected to weigh on global trade and economic growth as outlined in the latest OECD Economic Outlook. It will take some time for the full effects of these changes on the real economy to emerge. Financial markets can provide an early signal about the potential impact of trade developments on companies around the world.

During the US-China trade tensions in 2018-2019, the equity prices of exposed companies weakened and this was subsequently associated with lower levels of activity. In the US, equity prices for publicly listed companies exposed to Chinese tariffs experienced a significant and persistent decline following tariff-related policy announcements, with larger declines for firms that were indirectly exposed to higher tariffs through their supply chains (Amiti et al, 2025; Yilmazkuday, 2025). US firms competing with imported Chinese goods benefited from less competition, but the rise in their equity prices was small (Huang et al, 2020). The tariff-related equity price declines were strongly correlated with lower profits and weaker output, employment and productivity levels, and higher perceived risks of corporate default (Amiti et al, 2025; Huang et al, 2020). In China, publicly listed firms exposed to the US also experienced declines in their equity prices (Huang et al, 2020). Higher US tariffs dented firms’ output and employment in Chinese regions more exposed to trade (Chor and Li, 2021).

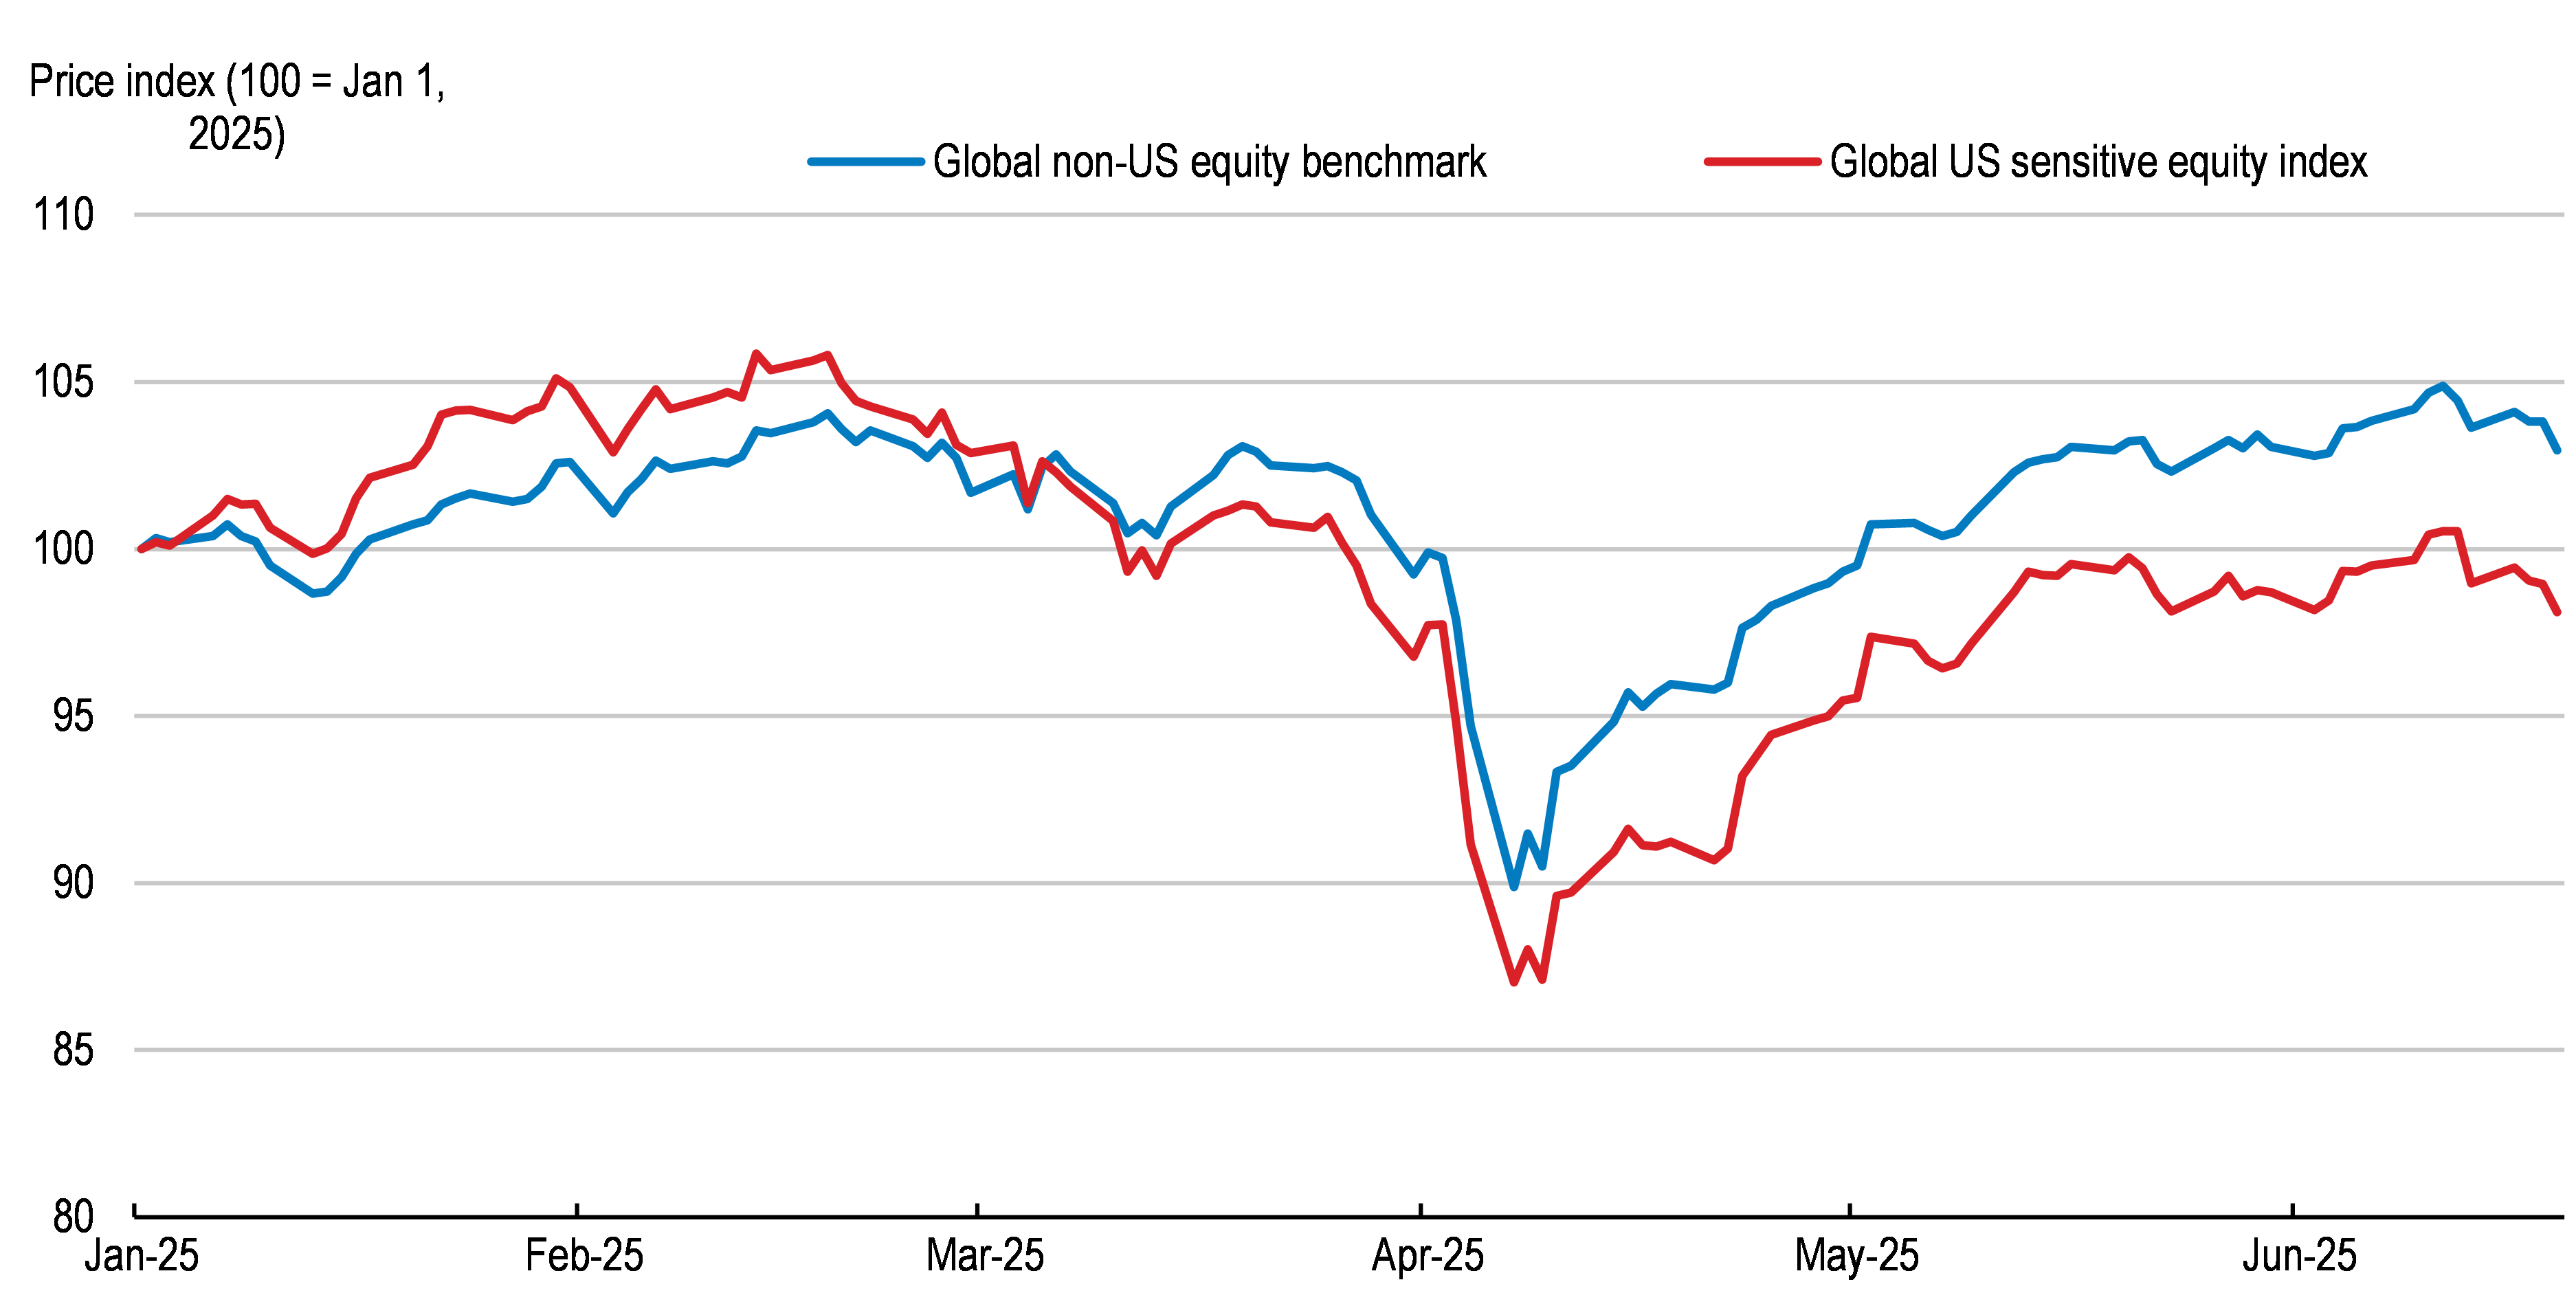
A similar set of concerns have appeared in 2025 in corporate equity markets. The equity prices of foreign companies highly exposed to the US economy have lagged behind the broader market since February. Following the substantial increase in US tariffs announced in April, the gap relative to January 1 widened to around 5 percentage points, which has persisted to date (Figure 1). Publicly listed companies in China, other emerging-market economies and in the Asia-Pacific region have been hit the hardest relative to their respective broader regional benchmarks, with European companies hit to a lesser extent so far (Figure 2).

Figure 1: Equity markets point to weaker performance for companies exposed to the US

Note: Based on data up to 19 June using a sample of 1,884 non-financial corporates in 28 selected advanced and emerging-market economies. The global US exposed index reflects the equity market performance of firms that are particularly sensitive to recent US policy changes, while the global non-US equity benchmark represents the broader non-financial corporate equity market. Exposed corporates are defined as ones with sales in the United States of 20% or more of their total sales. Indices are weighted by market capitalisation.
Source: OECD calculations.

In China, this could reflect the much higher increase in tariffs compared to most other US trading partners, as well as the sizable boost to domestically focused companies from policy support (OECD, 2025). In contrast, risks of a slowdown in growth have affected the equity prices of all companies in North America, resulting in smaller differences between companies exposed to the US and those who are domestically focused. The announced increase in tariffs has been relatively broad across different categories of goods and, when comparing sectors across countries, the negative effects have weighed on equity prices in many of them. However, companies exposed to the US in the discretionary consumer sector have tended to be more strongly affected relative to their respective sectoral benchmark, whereas technology and healthcare companies have seen little impact so far. Imports of pharmaceuticals and semi-conductors have remained exempt from new US import tariffs up to now.

In the United States, US companies with a relatively strong reliance on foreign sales initially traded at a discount in March and April, but the gap with other US companies has subsequently closed and become positive more recently (Figure 3). This could reflect initial expectations of retaliatory tariffs that have generally not materialised so far. Weaker US growth prospects relative to other countries, partly due to high uncertainty as well as higher costs of imported intermediate inputs, might be also disproportionately affecting US companies focused on the domestic market. However, historical experience suggests that the full impact of tariffs and trade-related uncertainty on equity prices develops over time (Adolfsen and Harr, 2025; Yilmazkuday, 2025). US companies are accumulating inventories ahead of anticipated tariff increases but surveys suggest they are already receiving fewer new orders, revising earnings forecasts downwards and scaling back investment plans (OECD, 2025).

Figure 3: Tariff effects have receded in US equity markets

Note: Based on data up until 19 June using a sample of 2,157 US non-financial corporates. Internationally exposed US corporates are defined as those with international sales of 20% or more of their total sales. Corporates that are not internationally exposed have a ratio of international sales to total sales of 0%. The US equity benchmark is the S&P 500 equity benchmark, excluding financials. All indices are weighted by market capitalisation.
Source: OECD calculations.

Overall, there have been clear signs in equity markets of differences across companies according to their potential exposure to tariff barriers, with the equity prices of foreign companies more highly exposed to the US market having underperformed others. As the announced tariffs have been relatively broad, the negative effects have weighed on the equity prices of most companies, but especially ones in the consumer goods sector. The equity prices of US companies with significant international exposure have recovered since falling sharply as tariffs began to be raised, but potential remains for further and unexpected trade policy events to disrupt markets again.

References

Adolfsen, J., F. and T. Harr (2025), Disentangling trade policy uncertainty and equity market performance, VOXEU column, May.

Amiti, M., Gomez, M., Kong, SH, and D. Weinstein (2025), Trade protection, stock-market returns, and welfare, NBER Working Paper No. 28758.

Caldara, D., Iacoviello, M., Molligo, P., Prestipino, A., and A. Raffo, (2019), The Economic Effects of Trade Policy Uncertainty, Journal of Monetary Economics, data retrieved from https://www.matteoiacoviello.com/tpu.htm on June 2, 225.

Chor, D., and B. Li (2021), Illuminating the effects of the US-China tariff war on China’s economy, NBER Working Paper No. 29349. 

Huang, Y., Che, L., Sibo L., and T. Heiwei, (2020), Trade Networks and Firm Value: Evidence from the U.S.-China Trade War, Centre for Economic Policy Research Working Paper DP14173.

OECD (2025), Economic Outlook June 2025, OECD Publishing, Paris.

Yilmazkuday, H (2025), U.S. Tariffs and Stock Prices [forthcoming], Finance Research Letters.


New time-series data shed light on regulatory trends in energy, transport, and telecoms since 1975

By Cassie Castle, OECD.

The OECD has released the 2023 update of its Energy, Transport & Communication Regulation (ETCR) indicators.

This harmonised annual time series spans from 1975 to 2023 and captures the scope and development of regulatory frameworks in six network sectors: electricity and natural gas; transport by air, road, and rail; and telecommunications by focusing on key dimensions such as barriers to entry; the degree of concentration of market participants; and the degree of public ownership.

The data cover 34 countries, including all OECD members except the most recent additions (Colombia, Costa Rica, Latvia and Lithuania). The ETCR indicators range between 0 and 6, with higher scores reflecting a less competition friendly regulatory framework. For details on how the ETCR indicators are constructed, see the methodology slides here.

Figure 1 presents the ETCR scores over the 50-year period for which data have been collected and shows a marked decline across all six network sectors since the 1980s, reflecting a broad trend toward more competition-friendly regulation across OECD members. The pace of liberalisation was particularly rapid during the late 1990s and early 2000s.

Figure 1. ETCR over time, OECD average

To fully capture the effects of regulation in network sectors, the OECD has also published the Regulatory Impact (REGIMPACT) indicators. The REGIMPACT indicators capture how regulation in network sectors indirectly affects downstream industries that rely on them for intermediate inputs. Given that network sectors supplied approximately 20% of the intermediate inputs used by other industries in 2022, understanding both direct and indirect regulatory impacts is crucial for evaluating their broader economic significance.

REGIMPACT indicators are calculated by combining ETCR indicators with measures of sectoral exposure derived from input-output tables. The time-series is available annually from 1975 to 2023 for the 34 OECD countries covered by the ETCR. The REGIMPACT indicators are calculated for 21 downstream sectors, with coverage varying by country and sector based on data availability.

A recent OECD study uses the updated ETCR and REGIMPACT indicators to assess the long-run impact of pro-competition reforms in network sectors on economic performance. The paper, ”Regulation and growth: Lessons from nearly 50 years of product market reforms” (Andrews et al., 2025), finds that the lack of pro-competitive reforms in upstream network sectors, particularly those aimed at removing barriers to entry, significantly hampers growth in downstream industries.

On average across the OECD, liberalising network sectors between 1980 and 2023 is estimated to have raised labour productivity by around 5 percent cumulatively, driven by gains in value added (6 percent), employment (2 percent), and capital stock (4 percent). Notably, the productivity gains in manufacturing, which relies heavily on inputs from regulated upstream sectors, were more than twice as large.

The study further finds that rapid reforms in the late 1990s and early 2000s added approximately 0.25 percentage points annually to labour productivity growth. As reform momentum slowed, their positive effects weakened, possibly contributing to as much as one-sixth of the slowdown in productivity growth since 2005.

Yet, there is still room for improvement. Countries with more regulated network sectors could still raise productivity by up to 1.7% by aligning with the most liberalised peers. The findings underscore the continued value of pro-competitive reforms, especially where regulatory barriers remain high.

To learn more about the OECD’s Product Market Regulation indicators, please visit the PMR webpage.

References

Andrews, D., B. Égert, C. de La Maisonneuve and C. Castle (2025), “Regulation and growth: Lessons from nearly 50 years of product market reforms”, OECD Economics Department Working Paper No. 1835, https://doi.org/10.1787/3b3285df-en.


Higher defence spending brings forward hard fiscal policy choices and has an uncertain economic impact

By Ben Conigrave, OECD.

After falling relative to overall public expenditure and GDP in the three decades after the Cold War ended, military spending is rising again in many OECD countries. Among those that are also NATO members, a large step up in defence outlays has recently occurred in Central and Eastern European countries (Figure 1). A broader pick-up in defence spending has seen expenditures also increase in Japan, the Nordic countries and Israel.

Poland and the Baltic states (Estonia, Latvia and Lithuania) were among those quickest to increase defence spending following Russia’s invasion of Ukraine in 2022. All plan to keep military spending at high levels in the coming years, or even increase it. Earlier this year, all four countries pledged to lift their defence budgets to 5% of GDP. Spending on this scale could absorb up to 15% of their tax revenues based on outcomes for recent years (OECD 2024). In recent months, Czechia, Denmark, Finland, Norway and Sweden have also signalled ambitious goals for defence spending, as have larger European economies including France, Germany and the United Kingdom (Figure 2 panel A). In a NATO summit this week, members are expected to agree to a new, higher defence spending target.

Many countries plan to borrow more, at least in the near term, to finance higher military expenditure. Sweden and Germany have loosened their fiscal rules – changing the Constitution in Germany’s case – to make more room for higher future defence outlays. A larger group of countries (16 by the end of April) hope to make use of national escape clauses in EU fiscal rules (Council of the EU, 2025). If cleared by the Council, this would allow these member states to deviate from approved budget plans by spending an extra 1.5% of GDP on defence up to 2028 (compared with levels in 2021).

Financial market pressure may make it difficult to meet defence spending ambitions in high debt countries. While Germany and Sweden have fiscal space to let debt rise for a period of time, higher-debt OECD economies could face increased borrowing costs if they fail to cut non-defence spending or raise taxes. Tax increases have often accompanied past military build-ups after a temporary period of higher borrowing (Marzian and Trebesch, 2025). But in many of the OECD countries now promising to raise defence spending, tax burdens are already high (Figure 2 panel B). Postponing to the “long run” tough fiscal policy choices – already unavoidable for countries grappling with heavy costs from changing demographics and climate (OECD 2025) – may not be an option.

The broader economic effects of higher defence spending are uncertain and will vary from country to country. Near-term growth payoffs from increased defence expenditure are likely to be larger in economies with spare capacity and established local defence industries, particularly if monetary policy accommodates a fiscal expansion. But many countries could expect the positive gains from higher defence spending to be offset by some combination of higher imports and reduced private sector activity due to increases in inflation or interest rates.  

The impact of higher spending may also vary by type of spending. Defence infrastructure projects or spending on equipment could generate relatively high multipliers by boosting public sector investment directly, and if they generate domestic private sector activity and jobs, and rely mainly on locally-sourced materials. Raising the number of military personnel also contributes to domestic output – directly through public final consumption and indirectly via household consumption – and is likely to have larger net effects in economies below full employment.

To the extent that European countries are able to source defence equipment, inputs or services from each other, and stretched availability of supplies does not raise costs, regional multipliers from increased defence spending could exceed those in individual European countries. Recent analyses suggest that a collective 1.5% of GDP lift in military spending could boost Europe-wide GDP by between 0.5% and 1.5% (Ilzetzki, 2025; European Commission, 2025). Across all but the very top of this range, a combination of higher imports and some crowding out of private sector activity would mean a less than one-for-one translation of increased government spending to GDP.

Longer-run benefits might still come from defence investments that boost the economy’s productive capacity, for instance through better infrastructure or innovation to respond to the shifting technological demands of modern warfare. These benefits are hard to quantify, though there is good reason to expect defence R&D to eventually benefit other industries (Steinwender, Van Reenen and Moretti, 2019). Gains from innovation and higher productivity might be more likely to spill over national borders if allied countries coordinate strategic investments and military procurement. Such coordination could be a powerful lever for more efficient defence spending if it reduces the cost of achieving intended improvements in military capability.

References

Council of the EU (2025), “Coordinated activation of the National Escape Clause”, press release of 30 April 2025.

European Commission (2024), Opening remarks by President von der Leyen at the joint press conference with President Michel and Belgian President De Croo following the meeting of the European Council of 27 June 2024.

European Commission (2025), “European Economic Forecast Spring 2025: Moderate growth amid global economic uncertainty”, Institutional Paper, 318.

Ilzetzki, E. (2025), “Guns and Growth: The Economic Consequences of Defense Buildups”, Kiel Report, No. 2.

Marzian, J. and C. Trebesch (2025), “How to Finance Europe’s Military Buildup? Lessons from History”, Kiel Policy Brief, 184.

OECD (2024), Revenue Statistics 2024: Health Taxes in OECD Countries, OECD Publishing, Paris, https://doi.org/10.1787/c87a3da5-en.

OECD (2025), Economic Outlook, Volume 2025/1, OECD Publishing, Paris, https://doi.org/10.1787/83363382-en.


Developments in Artificial Intelligence markets: New evidence on model characteristics, prices and providers

By Christophe André, Manuel Bétin, Peter Gal and Paul Peltier.

The release of Deepseek’s R1 model on January 20th stunned the world. This “sputnik moment” in AI showed that an almost unknown Chinese company could develop an AI model at the very top of AI capabilities at a fraction of the development costs of other leading models, release its parameter set (“weights”) for open use and offer ten times cheaper access to users. 

Our recent OECD paper, “Developments in Artificial Intelligence markets: New indicators based on model characteristics, prices and providers” (André, Bétin, Gal and Peltier, 2025), shows that while important risks for competition in digital markets persist, the strong position of digital incumbents in the supply of AI has not curbed innovation and prevented potential AI-users from accessing better and cheaper AI models, which provides strong preconditions for adoption across many sectors of the economy.

New data and indicators to monitor AI markets

After the skyrocketing popularity of OpenAI’s GPT models in late 2022, concerns emerged that AI may further entrench dominant positions in digital markets, with incumbents gaining a definitive advantage by controlling the three key AI inputs to AI development: access to data, computing capacity and top AI talents (OECD, 2024). However, emerging empirical evidence offers some nuance regarding such concerns.

The paper relies on an extensive data collection on AI foundation models on the market and shows that, so far, there have been several signs indicating dynamism in three segments of the AI value chain (AI model development, AI model provision from the cloud and AI downstream applications). First, the number of available AI foundation models has been rising exponentially (Figure 1), developed by an increasing number of companies and offering several interaction modalities. 

Second, using common industry benchmarks to evaluate AI models’ performances and collecting prices of AIfrom cloud providers, we construct an AI Economic Frontier by identifying, each month, the best models in terms of the price-performance trade-off (Figure 2). Results suggest that in the last two years, the positions at this AI Economic Frontier have shifted continuously towards lower prices and higher quality. Moreover, the developers and models that make it to the frontier have been changing, with five to six players alternating at the frontier (OpenAI, Meta, DeepSeek, Anthropic, etc.) and around ten others following closely.

Figure 2. The AI Economic frontier shows the continuous improvements of AI 

Note: Performance is defined by a normalised weighted performance index on industry benchmarks. Each dot represents the model with the best available price-performance trade-off within Text-to-Text models.
Source: André, Betin, Gal and Peltier, 2025.

This variety of models at the frontier is important from an economic perspective. Many users may not always need the best available models and would rather pay an order of magnitude less to access “good enough” models specialised for specific tasks or preferences. In addition to the offer of closed models directly from the cloud, open-weight models offer an option for cheaper (with no license fee), transparent and easily customable (fine-tuned) models used outside of the public cloud environment. This option provides opportunities for better tailored performance and greater control in specific business applications and enhanced data privacy.

AI is getting better, cheaper and more accessible

Figure 2 illustrates the upward shift of the AI economic frontier, implying that AI has become more efficient and cheaper. Indeed, our quality-adjusted AI price index has fallen by on average 80% in two years (Figure 3) and, on average, 30% of models at the frontier have been replaced every month by cheaper and better models.

AI-adopting firms have benefited from greater access to AI models via a widespread offer accessible through several cloud providers (for business use) and an increasing number of AI-powered consumer services (consumer-facing applications). According to our data collection, around 60 cloud providers offer access to AI models, on average from five different AI developers. Downstream, in consumer facing applications, we recorded more than 12 000 AI tools ranging from chatbots to image editing software, customer support applications or domain specific services. While this offer is large and growing, only a few of them (like ChatGPT) attract most users.

 AI market developments have been favourable for AI users, but risks for competition exist

Dynamic AI markets are a necessary condition for the diffusion of AI across the economy via widespread AI adoption in various sectors, a central determinant of long-term productivity gains from AI (Filippucci et al., 2024). Our evidence so far suggests that the supply of AI has been more open than initially expected in various segments of the AI value chain, driving innovation and generating the optimal conditions for broad AI adoption (lower price, better quality, broader accessibility). If current trends persist, dynamic AI markets can foster adoption and boost innovation which in turn are preconditions for widespread economic and welfare benefits.

Nonetheless, several uncertainties and risks persist about the future dynamism of AI markets. For instance, the capacity of digital incumbents to leverage existing compute infrastructure and user base in adjacent markets is high. Furthermore, the high concentration of the necessary inputs for AI development — data, compute, and talent — creates additional risks for long-term competition.

References

André, C. et al. (2025), “Developments in Artificial Intelligence markets: New indicators based on model characteristics, prices and providers”, OECD Artificial Intelligence Papers, No. 37, OECD Publishing, Paris, https://doi.org/10.1787/9302bf46-en.

Filippucci, F., P. Gal and M. Schief (2024), “Miracle or Myth? Assessing the macroeconomic productivity gains from Artificial Intelligence”, OECD Artificial Intelligence Papers, No. 29, OECD Publishing, Paris, https://doi.org/10.1787/b524a072-en.

OECD (2024), “Artificial intelligence, data and competition”, OECD Artificial Intelligence Papers, No. 18, OECD Publishing, Paris, https://doi.org/10.1787/e7e88884-en.

Live data from OECD.AI


Improving education and skills in Czechia

By Federica De Pace, OECD

Czechs, young and old, possess solid skills. Since 2012, 15-year-olds have consistently outperformed the OECD average across all subjects in the Programme for International Student Assessment (PISA). Adult skills, measured by the 2023 OECD Survey of Adult Skills, are broadly in line with the OECD average, but numeracy stands out as a particular strength. Yet, averages hide important inequalities in educational outcomes, with disadvantaged students falling further behind their advantaged peers than in most other OECD countries (Figure 1). In addition, high educational mismatches suggest that the education system does not always provide students with the right skills (Figure 2).

With skill shortages already biting, expanding the skilled workforce is vital for sustaining growth. Demographic decline, digitalisation, and the green transition will only heighten the pressure. Against this background, the 2025 Economic Survey of Czechia explores ways to enhance equality of opportunities and the quality of education for all students, and ensure that workers can upskill and reskill throughout their careers.

Expanding capacity and participation to high-quality affordable early childhood education and care will be paramount to improve educational outcomes of the most vulnerable, besides facilitating mothers’ participation in the labour market. Directing support to schools with a high proportion of disadvantaged students as well as better diagnostics to reduce Roma overrepresentation in special schools are also key to tackling educational inequality. Meanwhile, Czechia’s early school tracking disadvantages talented students lacking strong family support. Delaying tracking and narrowing quality gaps between general and vocational education would help Czechia make the most of its talent.

Strengthening the teaching workforce and improving the efficiency of the school network are essential for enhancing the quality of education. However, limited career prospects and challenging working conditions make it difficult for Czechia to attract and retain qualified teachers, with adverse effects on educational outcomes. Teacher shortages have worsened, particularly in scientific subjects and in both remote regions and Prague. The problem is exacerbated by an abundance of small schools, a consequence of a highly decentralised education system and administrative fragmentation. Enhancing working conditions—notably by diversifying career pathways—could help draw and retain talent. At the same time, consolidating the school network, by setting minimum school sizes to encourage mergers and cooperation, would allow resources to be redirected from administration to teaching.

Reforms are needed to better align skills with labour market demands. The vocational education and training (VET) system often falls short of equipping students for the workplace, partly due to limited exposure to work-based learning—only 16% of VET students participate, compared to an EU average of 64.5%. Reducing over-specialisation and expanding work-based learning, for example by tying VET school funding to student participation in work placements and strengthening the role of social partners in shaping curricula and delivering training, could help bridge this gap. Meanwhile, adult learning participation should be expanded, particularly for low-skilled workers. Offering flexible, modular learning options—where long programmes are broken into self-contained units, each with its own learning outcomes and qualifications (micro-credentials)—would make upskilling more accessible.

Tertiary attainment must also rise to meet growing demand for highly skilled graduates, particularly in technical fields such as civil engineering, ICT, and the natural sciences. In 2022, just 34.6% of young adults held a tertiary degree, well below the OECD average of 47.4%. Expanding access and improving completion rates—including through grants and loans for students from vulnerable backgrounds—would help ensure a better match between skill supply and labour market needs.

References

OECD (2025), OECD Economic Surveys: Czechia 2025, OECD Publishing, Paris, https://www.oecd.org/en/publications/oecd-economic-surveys-czech-republic_19990561.html


Unlocking Chile’s productivity growth

By Claudia Ramirez Bulos and Adolfo Rodriguez-Vargas

Thanks to its strong macroeconomic framework, the Chilean economy has weathered significant challenges in recent years showing resilient growth. The economy recovered in 2024 from weak growth compared to 2023, and the economy is projected to grow around 2.2% on average in 2025 and 2026, as detailed in the recently published 2025 Economic Survey of Chile.  However, the Chilean economy is about 50% less productive than the average OECD country, and productivity has failed to catch up over the last decade. Chile can reverse this trend and accelerate productivity growth to allow more sustainable increases in living standards by encouraging efficient resource allocation and taking advantage of its digital connectivity and vast natural resources. To address productivity challenges and leverage the opportunities created by the digital and green transitions, including the development of the lithium and hydrogen industries, it will be necessary to foster women’s participation in the labour market, enhance skills development, promote investment and a more dynamic innovation environment, while improving business and environmental regulations, as described in the 2025 Economic Survey of Chile.

Fully unlocking the labour market potential

Fostering women’s participation in the labour market can lead to a better allocation of talent, increasing the country’s potential growth. OECD estimates suggest that fully closing gender gaps in labour market participation and hours worked by 2060 could lift Chile’s potential GDP per capita by over 0.25 percentage points per year—a bigger boost than the OECD average. Yet, women’s participation still lags 16 percentage points behind men at 77.6%, remaining below the OECD benchmark (Figure 1, Panel A). Unlocking women’s full economic potential requires addressing unpaid work imbalances and closing education gaps in high-skill fields. Policies that expand access to high-quality childcare and elderly care, improved parental polices, alongside efforts to encourage more women into STEM careers by addressing gender stereotypes from a young age, will be key to closing gender gaps.

Enhancing skills development

Chile’s workforce needs a skills upgrade to fully seize the opportunities of the digital and green transitions. As industries evolve, workers will need to adapt—but many currently lack the necessary capabilities. In 2023, only 11.7% of Chilean adults were proficient in problem-solving in technology-rich environments, far below the OECD average of 32.3%. Additionally, 41% of employed adults felt underqualified for their jobs, citing inadequate computer or software skills, close to the OECD average of 42%. The green transition adds another layer of complexity. Chile’s green transition plans require sufficiently skilled workers to set up, operate, and improve equipment based on novel technologies, some of them still in development. Strengthening education and training systems will be crucial. Raising teaching quality, integrating more digital skills into the national curriculum, and expanding access to tailored digital training for workers can help ensure that Chile’s workforce is prepared for the jobs of the future.

Promoting investment and innovation while improving business and environmental regulations

Promoting the diffusion of knowledge across firms is key to taking advantage of Chile’s good digital connectivity and vast natural resources. Encouraging the adoption of advanced technologies can stimulate innovation and yield significant productivity gains. However, Chile invests relatively little in R&D, at 0.3% of GDP, well below the OECD average of 2.1% in 2022, with most resources coming from the public sector (Figure 1, Panel B). Furthermore, the percentage of companies that introduced technological innovations was 16.7% in 2019-2020, compared to 35% in the rest of the OECD. Simplifying access to public research and development support can help boost innovation, while strengthening the collaboration between businesses and universities, that in Chile remains low, would also help. In the medium-term, increasing R&D spending based on cost-benefit analysis would be advisable.

Figure 1. A more efficient resource allocation is needed to accelerate productivity growth

Note: LAC is a simple average of Argentina, Colombia, Costa Rica, and Mexico. Panel B: Data for Chile refer to the year 2020.
Source: OECD Labour force statistics; OECD Main Science and Technology indicators database.

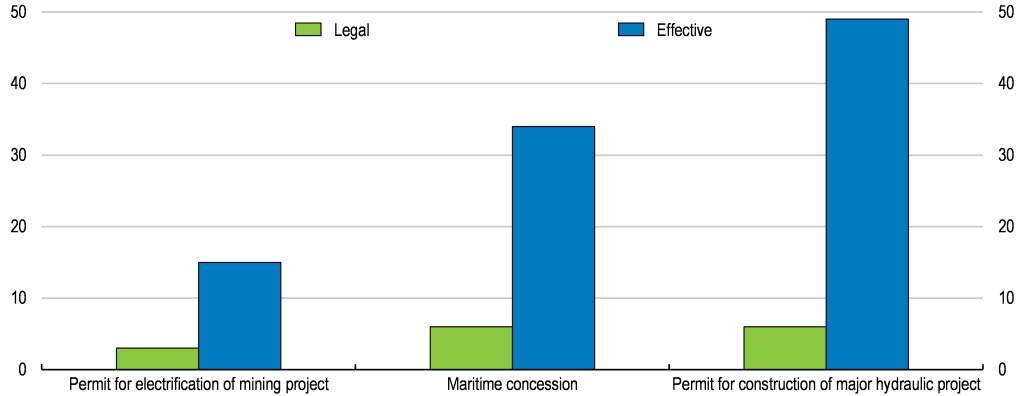
Chile is well positioned to benefit from increased world demand for lithium, as it has the largest share of known lithium reserves and produces around a quarter of world lithium. The country has a unique opportunity to create jobs, attract investment, and move up the lithium value chain. At the same time, the government envisions a strong state role in lithium development alongside the private sector. However, committing to multiple high-profile initiatives risks diluting efforts. A more focused approach would yield better results. Prioritizing key areas—such as strengthening state mining companies’ lithium expertise, establishing the planned National Lithium and Salt Flats Technological and Research Institute, and ensuring sustainable extraction practices—should be a priority. Strategic partnerships with private firms can also help bridge the knowledge gap and accelerate development.  Additionally, regulatory and administrative burdens remain comparatively high in Chile, with complex sectoral permitting processes that lack systematised and readily available supporting information, with long durations (Figure 2). Reducing administrative burdens on businesses and strengthening competition can create a more dynamic economic landscape conducive to growth.

Figure 2. The review of permits often exceeds legal times

Permit reviewing times, months, 2018-2022 average

Source: Consejo Nacional de Evaluación y Productividad, 2023, Análisis de los permisos sectoriales prioritarios para la inversión en Chile.

Read more:

OECD Chile Economic Snapshot – https://www.oecd.org/en/topics/sub-issues/economic-surveys/chile-economic-snapshot.html


Poland: Towards a strong and healthy economy

By Zuzana Smidova

Link to the blog in Polish

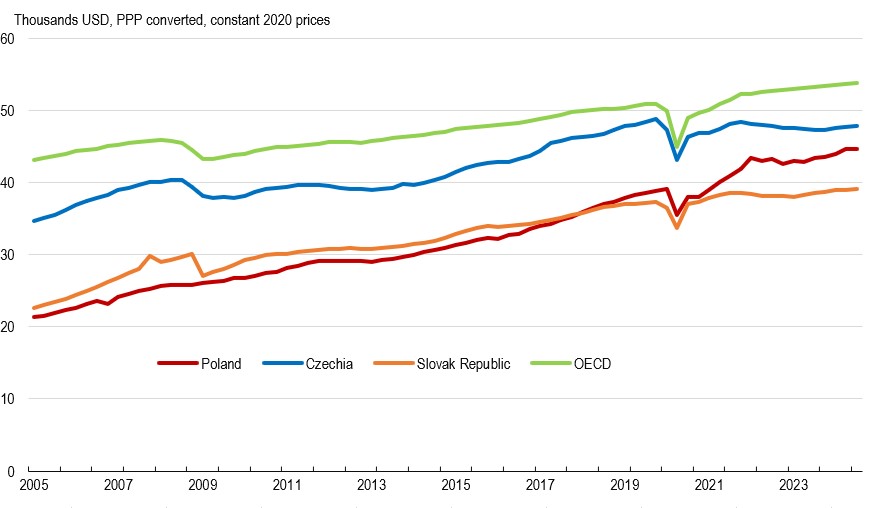
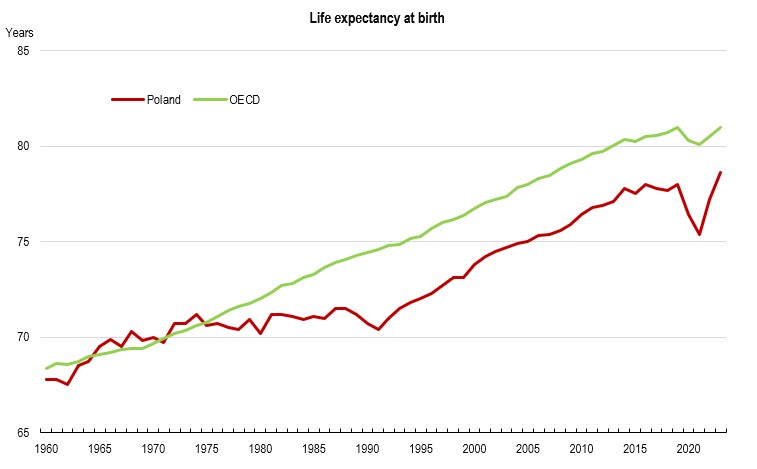
Living standards in Poland have increased significantly over the past two decades, as the economy doubled in size, when measured by GDP per capita. Poland has narrowed the gap with its regional peers, Czechia and the Slovak Republic (Figure 1), and average life expectancy has risen to 78.6 years.

Progress has slowed more recently due to two external shocks: the COVID-19 pandemic and repercussions from Russia’s war of aggression against Ukraine. Nevertheless, the economy recorded a robust growth of almost 3% last year and the momentum is expected to continue this year and next. This strong economic performance is reflected in the labour market, where the unemployment rate has reached historic lows and the number of people in work has exceeded pre-pandemic levels.

Figure 1. Strong growth led to significant catching up in economic standards
Note: Seasonally and calendar adjusted data.
Source: OECD Economic Outlook database.

The Economic Survey of Poland, published today, takes stock of this progress and examines the main short- and long-term challenges facing the economy.  The most immediate challenge is to bring down inflation. Although the inflation rate has come down substantially from its peak of 18% in February 2023, it is still above the central bank’s target. Core inflation also remains elevated, at over 4%. In this context, monetary policy should remain restrictive, but interest rates should gradually ease as wage growth slows and inflationary pressures durably subside.

Poland’s fiscal deficit has deteriorated in recent years due to rapid increases in social, health and defence spending. To finance current government priorities and prepare for future spending pressures, Poland needs a sustained fiscal adjustment as planned by the authorities. On the expenditure side, certain universal family benefits could be withdrawn for higher earners. On the revenue side, tax expenditures, environmental and property taxation could raise more revenue. Changing the taxation of buildings, currently based on the surface area, to a system based on the value of the property, which exists in most of OECD countries, would help.  

A supportive business environment, combined with a well-educated population, has attracted foreign investment and innovative companies. However, Polish companies face challenges in moving up the value chain, population ageing and a shortage of skills. The skills shortages should be addressed through increased training and upskilling, especially among small and medium-sized companies, as well as through targeted awareness campaigns and a comprehensive migration strategy.

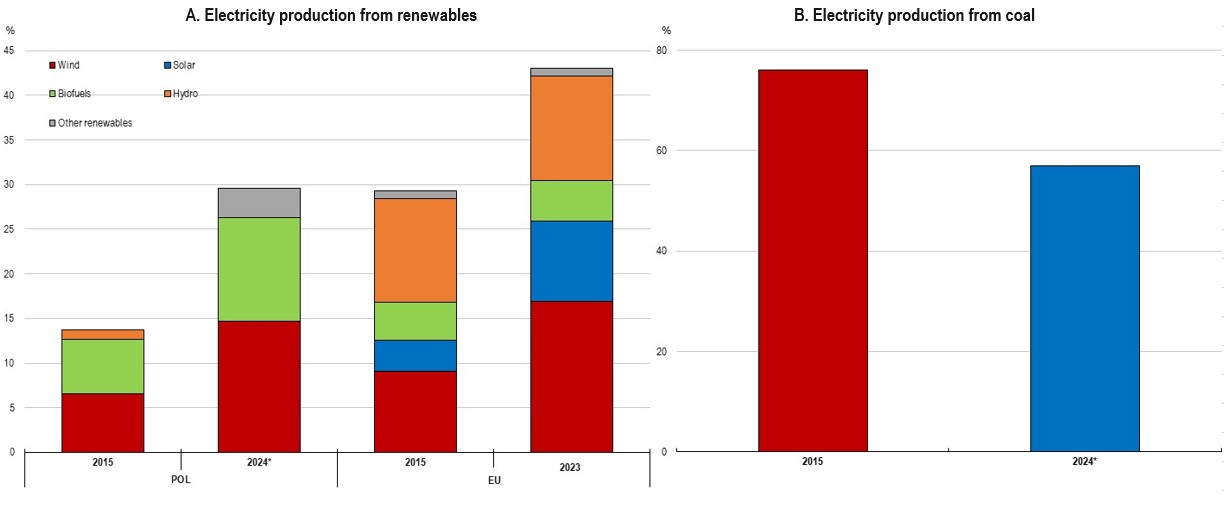
Given Poland’s continued reliance on coal, the transition to an economy that produces net zero emissions by 2050 is challenging (Figure 2). It requires stepping up implementation of the policies outlined in the draft National Energy and Climate Plan 2030, strengthening price incentives, and a range of supports for the most vulnerable. A more ambitious phase out of coal and shorter permitting times for renewables would help achieve the necessary long-term private sector investment. Emissions from the transport sector have doubled in the last thirty years. To reverse this trend, a comprehensive motor vehicle taxation covering all cars, would strengthen price signals, and should be accompanied by continued investment in public transport.

Figure 2: Electricity production from renewable sources has increased but coal remains important
Note: * Preliminary estimates for 2024.
Source: Forum Energii (2025), OECD Green Growth Indicators database, International Energy Agency.

While life-expectancy has increased, it remains behind many OECD countries and there is a scope to improve health outcomes (Figure 3). Funding of the health system has increased, but rationalising excess bed capacity in hospitals and making more use of incentives in primary care would allow to raise efficiency and improve care. Improvements to treatment and a greater focus on prevention, particularly when it comes to risky behaviour such as drinking and smoking, can significantly improve health outcomes. With pressures from the ageing population, the authorities need to expand long-term care in a sustainable way.

Figure 3: Life expectancy improved significantly but remains below the OECD average
Note: The OECD average is weighted.
Source: OECD Health Statistics.
Reference:
OECD (2025), OECD Economic Surveys: Poland 2025, OECD Publishing, Paris, https://doi.org/10.1787/a35a56b6-en