Romper el círculo vicioso entre productividad e informalidad en América Latina: Reflexiones de la Conferencia Ministerial 2025 en Lima

Harvesting in Guatemalal

Por Paula Garda, Jens Arnold, Luca Marcolin, Departamento de Economía de la OCDE

Disponible en inglés

Alrededor la mitad de los trabajadores en América Latina se encuentra en empleos informales, una realidad que mantiene la productividad estancada y las desigualdades elevadas. Estos fueron los temas centrales de la Conferencia Ministerial sobre Productividad e Informalidad celebrada el 30 de octubre de 2025 en Lima, Perú. Ministros, altas autoridades públicas, académicos y representantes de organismos internacionales se reunieron en la conferencia ministerial “Hacia Economías Más Productivas: Enfrentando la Informalidad en América Latina”, coorganizada por el Ministerio de Economía y Finanzas de Perú, el Foro Global de Productividad y el Departamento de Economía de la OCDE y el Banco Interamericano de Desarrollo. El evento reunió a más de cien participantes para intercambiar experiencias y extraer lecciones sobre qué políticas han funcionado, cuáles no, y cómo rediseñar las reglas del juego para un crecimiento más productivo e inclusivo.

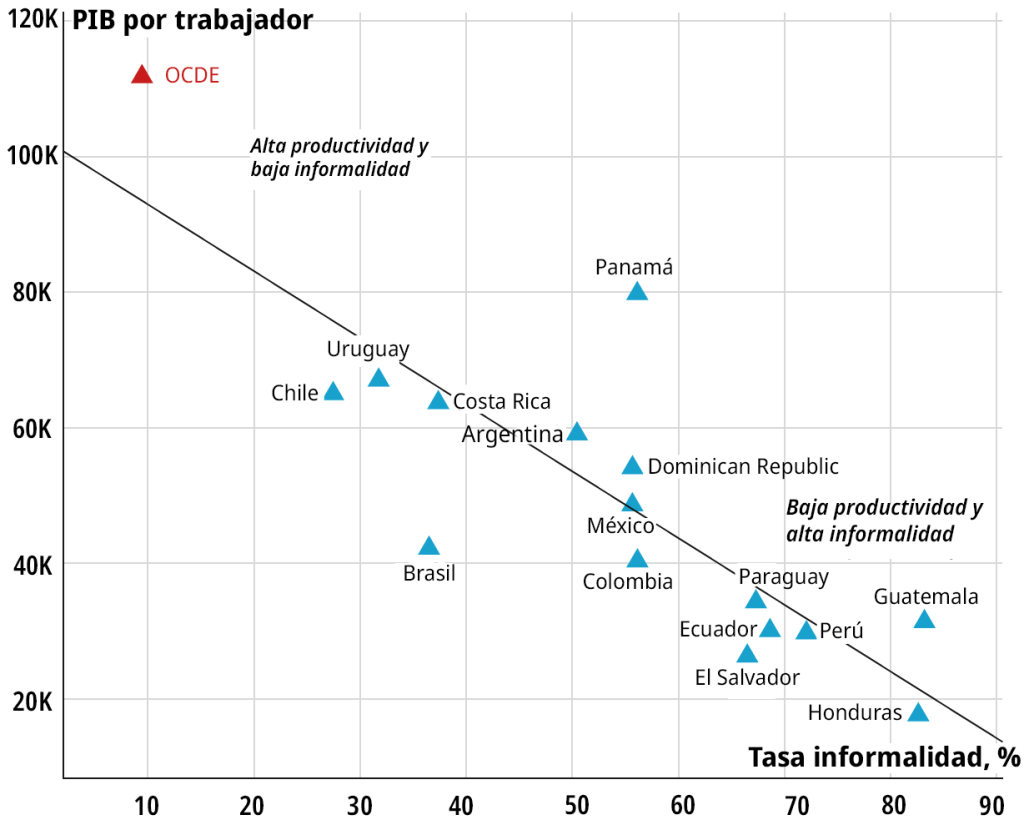
La reunión abordó una pregunta central: ¿cómo puede América Latina romper el círculo vicioso de baja productividad y alta informalidad? La figura siguiente ilustra claramente esta relación, mostrando que los países con mayores tasas de informalidad suelen ser aquellos con menor productividad laboral. Este blog resume los mensajes clave que surgieron del debate para contribuir a convertir la reflexión en decisiones de política pública.

Donde la informalidad es alta, la productividad es baja
La estructura empresarial de la región refuerza la informalidad

Las discusiones resaltaron que el desafío de productividad en América Latina no se relaciona tanto con qué produce la región, sino con cómo se produce. La estructura empresarial está fuertemente sesgada hacia las microempresas: alrededor del 60% de los trabajadores se emplea en firmas con menos de 10 empleados, frente a menos del 20% en los países de la OCDE. En América Latina, el autoempleo representa más de un tercio del empleo total, más del doble que el promedio de la OCDE. La mitad de los puestos de trabajo siguen siendo informales.

Este predominio de unidades pequeñas y de baja productividad refleja desafíos estructurales y también debilidades de política — bajo capital humano, escasa innovación, débil difusión tecnológica, limitado acceso al crédito y regulaciones laborales y empresariales mal alineadas. Estos factores alimentan y se alimentan de la informalidad, atrapando a las economías en un ciclo de baja productividad y alta desigualdad.

Abordar estas debilidades requiere una estrategia integral. A largo plazo, mejorar la calidad de la educación y el aprendizaje a lo largo de la vida es fundamental para fortalecer habilidades transversales y específicas. Las políticas de innovación deben apoyar la adopción tecnológica, la digitalización y la transferencia de conocimiento entre empresas. El acceso al financiamiento también debe ampliarse para permitir que las empresas crezcan e inviertan. A corto plazo, es necesario reducir las barreras que perpetúan la informalidad, como sistemas de seguridad social basados en contribuciones, salarios mínimos altos en relación con la productividad y, en algunos casos, regulaciones laborales rígidas. Las políticas que generan incentivos para que las empresas permanezcan pequeñas e informales, como regímenes tributarios o regulatorios diferenciados según el tamaño, deben usarse con extrema cautela.

La informalidad como síntoma de políticas disfuncionales

La informalidad es menos una causa que una consecuencia de políticas mal alineadas. Incluso en contextos de estabilidad macroeconómica, crecimiento y apertura externa, la productividad puede estancarse cuando los incentivos protegen a empresas pequeñas y de baja productividad en lugar de permitir que las más dinámicas crezcan. La experiencia de México ilustra este fenómeno: a pesar de un crecimiento sostenido y éxito exportador, la productividad agregada permaneció estancada, ya que muchas firmas poco productivas permanecieron en el mercado, y aquellas que salieron fueron reemplazadas por otras igual de poco productivas.

Regímenes tributarios y laborales simplificados dirigidos a empresas pequeñas —como monotributos u otros esquemas similares— pueden inducir a más firmas a formalizarse, pero a menudo desincentivan su crecimiento. En su lugar, los objetivos de productividad e inclusión deben avanzar conjuntamente. Para generar condiciones equitativas, el acceso a la protección social básica debe desvincularse de la situación laboral y financiarse preferentemente mediante ingresos tributarios generales en lugar de contribuciones sobre la nómina. Este cambio reduciría la diferencia de costos entre generar empleos formales e informales, permitiría a las empresas competir en igualdad de condiciones y facilitaría la movilidad laboral sin pérdida de protección.

Proteger a los trabajadores y promover la productividad pueden ir de la mano

Un nuevo libro de la OCDE, Ampliar la protección social y combatir la informalidad en América Latina, muestra que los sistemas de protección social pueden diseñarse para promover tanto la inclusión como la productividad. La clave es garantizar acceso aprotección básica independientemente de la participación en el mercado laboral formal, financiada principalmente con ingresos tributarios generales y complementada con esquemas contributivos progresivos. Estos sistemas reducen los costos laborales no salariales —especialmente para trabajadores de bajos ingresos— y disminuyen el costo adicional de la formalización, al tiempo que apoyan el crecimiento de las empresas y la asignación eficiente de recursos. Una protección social universal, portable y fiscalmente sostenible puede así fomentar la creación de empleo formal, mejorar la equidad y fortalecer la resiliencia. El costo fiscal estimado (1–4% del PIB, según el país) es manejable y probablemente pequeño en relación con los beneficios potenciales.

El libro incluye capítulos específicos para Argentina, Brasil, Chile, Colombia, Costa Rica, México y Perú, con recomendaciones y estimaciones de costo fiscal adaptadas a cada país.

Gobernanza y confianza: el motor invisible de la informalidad

Los países con menor informalidad suelen exhibir también mejor gobernanza, mayor confianza y menor captura del Estado. No es casualidad que los países más productivos sean también los más transparentes y previsibles. La erosión de la confianza en el Estado —su incapacidad para proveer bienes públicos de calidad como educación, justicia e infraestructura— debilita la legitimidad y empuja a millones hacia la informalidad. Las agendas de productividad deben integrar una dimensión de gobernanza para fomentar la inversión y el crecimiento sostenido.

Lecciones de las experiencias nacionales

La conferencia también permitió destacar esfuerzos de reforma en varios países:

  • Brasil está implementando una ambiciosa reforma tributaria que reemplazará cinco impuestos al consumo por un sistema dual de IVA con reglas armonizadas, una base más amplia y menores costos de cumplimiento. Se espera que la reforma mejore la competitividad y la productividad al eliminar distorsiones que obstaculizan el crecimiento y la inversión de las empresas.
  • Chile subrayó que la informalidad se redujo durante periodos de fuerte crecimiento y consolidación de instituciones de apoyo productivo. La Comisión Nacional de Productividad está analizando cómo sostener estos avances en un contexto de menor dinamismo económico.
  • Costa Rica está avanzando hacia convertirse en un verdadero aliado de las pequeñas empresas. Su estrategia combina simplificación regulatoria con servicios de apoyo empresarial — facilitando la formalización, el acceso al financiamiento y el fortalecimiento de capacidades de gestión en micro y pequeñas empresas.
  • Perú enfatizó la necesidad de una estrategia integral. El Plan Nacional de Competitividad y Productividad 2024–2030 busca corregir la fragmentación institucional mediante la modernización de los servicios públicos, la inversión en capital humano, la expansión del acceso al crédito y el impulso a la innovación. Además, se están llevando adelante esfuerzos para generar un shock de simplificación regulatoria con el fin de reducir cargas administrativas y facilitar la formalización y el crecimiento empresarial.

Conciliar productividad y objetivos sociales

El mensaje desde Lima es claro: abordar la informalidad no es solo deseable, es indispensable para impulsar la productividad y un crecimiento más inclusivo. Promover la productividad y

asegurar la protección social son objetivos que pueden reforzarse mutuamente. Una mejor educación y formación, sistemas tributarios que incentiven el crecimiento empresarial, instituciones laborales que faciliten la movilidad y esquemas de protección social de carácter universal pueden elevar la productividad al favorecer la reasignación de recursos, estimular la inversión en capacidades y reducir las distorsiones que mantienen a las empresas pequeñas y poco productivas.

Las reformas incrementales en la dirección correcta son importantes, pero no bastarán para romper el círculo vicioso de informalidad y baja productividad. Lograr un crecimiento sostenido e inclusivo requerirá reformas profundas y coordinadas que alineen los sistemas tributario, laboral, educativo y de protección social, y que reconstruyan la confianza necesaria para que esas reformas perduren.

Para más información:

OECD (2025), Ampliar la protección social y combatir la informalidad en América Latina, OECD Publishing, Paris, https://doi.org/10.1787/b03f2e18-es.

Foro Global de Productividad de la OCDE

Página web LAC del Departamento de Economía de la OCDE


Breaking the vicious cycle between productivity and informality in Latin America: Insights from the 2025 Ministerial Conference in Lima

Harvesting in Guatemalal

By Paula Garda, Jens Arnold, Luca Marcolin, OECD Economics Department

Available in Spanish

Around half of all workers in Latin America are in informal jobs – a reality that keeps productivity stagnant and inequality high. These were the central themes of the 2025 Ministerial Conference on Productivity and Informality held on 30 October 2025 in Lima, Peru. Ministers, senior policymakers, academics, and representatives from international organisations met for the ministerial conference “Towards Productive Economies: Confronting Informality in Latin America”, co-organised by Peru’s Ministry of Economy and Finance, the OECD Economics Department and Global Forum on Productivity and the Inter-American Development Bank. The event brought together over a hundred participants to exchange experiences and lessons about which policies have worked, which have not, and how to redesign the rules of the game for more productive and inclusive growth.

The meeting tackled a central question: how can Latin America break the vicious cycle of low productivity and high informality? The figure below captures this relationship vividly, showing that countries with higher informality rates tend to be those with lower labour productivity. This blog summarises the main messages that emerged from the discussions to help turn reflection into policy action.

Where informality is high, productivity is low

The region’s firm structure reinforces informality

Discussions highlighted that Latin America’s productivity challenge is not so much related to what the region produces, but more to how production is organised. The region’s firm structure is strikingly skewed towards microenterprises: around 60% of workers are employed in firms with fewer than 10 employees, compared with less than 20% in OECD economies. In Latin America, self-employment accounts for more than a third of total employment, more than double the OECD average. Half of all jobs remain informal.

This dominance of tiny, low-productivity units reflects structural challenges but also policy weaknesses — low human capital, limited innovation, weak technological diffusion, scarce access to credit, and poorly aligned labour and business regulations. These factors both stem from and reinforce informality, trapping economies in a cycle of low productivity and high inequality.

Addressing these weaknesses requires a comprehensive strategy: In the longer run, improving education quality and lifelong learning is key to strengthen transversal and job-specific skills, while innovation policies should support technology adoption, digitalisation, and knowledge transfer across firms. Access to finance must also be expanded so that firms can invest and scale up. In the shorter term, barriers that reinforce informality — such as contribution-based social security systems, high minimum wages relative to productivity and in some cases stringent labour regulations — should be addressed. Policies that create incentives for firms to remain informal and small, including size-dependent special tax or regulatory regimes, should be used with extreme caution.

Informality as a symptom of policy incoherence

Informality is less a cause than a consequence of poorly aligned policies. Even in contexts of macroeconomic stability, strong growth, and open markets, productivity can stagnate when incentives protect small, low-productivity firms instead of enabling dynamic ones to expand. Mexico’s experience illustrates this paradox: despite sustained growth and export success, aggregate productivity flatlined as many low-productivity firms stayed in the market, and those inefficient firms that exited were replaced by others that were just as unproductive.

Simplified tax and labour regimes targeted to small enterprises — such as monotributos or related schemes — may induce more firms to join the formal sector, but often discourage them from growing. Instead, social and productivity objectives must advance together. To create a level playing field, access to core social protection should be clearly separated from labour market status and financed preferably through general tax revenues rather than payroll-based contributions. Such a shift would align the cost of creating formal and informal jobs, allowing firms to compete on equal terms and enabling workers to move safely between jobs without losing protection.

Protecting workers and boosting productivity can go hand in hand

A new OECD report, Expanding Social Protection and Addressing Informality in Latin America, shows that social protection systems can be designed to promote both inclusion and productivity. The key is to provide access to basic protection irrespective of formal labour-market participation, financed mainly through general tax revenues, and complemented by progressive contributory schemes. Such systems can lower non-wage labour costs—especially for low-income workers— and reduce the extra cost of formalisation, while supporting firm growth and efficient resource allocation. Universal, portable, and fiscally sustainable protection can thus foster formal job creation, improve equity, and strengthen resilience. The estimated fiscal cost of such reforms (1–4% of GDP, depending on the country) is manageable and likely small relative to potential gains in inclusion, productivity, and resilience. The new OECD report also includes country chapters for Argentina, Brazil, Chile, Colombia, Costa Rica, Mexico, and Peru, providing tailored policy recommendations and fiscal assessments to guide reform implementation.

Strong governance and trust:  hidden driver of informality

Countries with lower informality often also display stronger governance, higher trust, and less evidence of state capture. It is no coincidence that the most productive countries are also the most transparent and predictable. The erosion of trust in the state — its inability to deliver quality public goods such as education, justice, and infrastructure — undermines legitimacy and pushes millions into informality. Productivity agendas should integrate a governance dimension to foster business investment and sustained growth.

Lessons from country experiences: what has worked and what hasn’t

The Lima conference was also an opportunity to highlight the reform efforts of selected countries in the region, as there are no one-size-fits-all solutions.

  • Brazil is implementing an ambitious tax reform, replacing five complex consumption taxes with a dual VAT system that will harmonise rules, broaden the base, and reduce compliance costs. This reform is expected to boost competitiveness and productivity by removing distortions that penalise firm growth and investment.
  • Chile highlighted that informality fell when growth was strong and business support institutions were consolidated. The National Productivity Commission is studying how to sustain the reduction of informality in a context of weaker growth. 
  • Costa Rica focused on becoming a true “ally of small firms.” Its strategy combines regulatory simplification with active business support — helping micro and small enterprises formalise, access financing, and strengthen managerial skills.
  • Peru stressed the need for a comprehensive approach across policy areas. The National Competitiveness and Productivity Plan 2024–2030 aims to address institutional policy fragmentation by modernising public services, investing in human capital, expanding credit access, and promoting innovation. Recent efforts also aim at generating a deregulatory shock to simplify administrative procedures and reduce the regulatory burden on firms, with the goal of facilitating formalisation and business growth.

Bridging productivity and social objectives

The message from Lima is clear: tackling informality is not just a good idea, it’s essential to foster productivity and more inclusive growth. Promoting productivity and ensuring social protection can be mutually reinforcing objectives.  Better education and training, tax systems that encourage firm growth, labour institutions that foster labour mobility, and social protection schemes that are universal can enhance productivity by supporting reallocation of both labour and capital, encouraging investment in skills, and reducing distortions that keep firms small and unproductive.

Incremental reforms in the right direction matter, but they will not be enough to break the vicious circle of informality and low productivity. Achieving sustained and inclusive growth will require deep, coordinated reforms that align tax, labour, education and social protection systems — and rebuild the trust needed to make them last.

FOR MORE INFORMATION

OECD (2025), Expanding Social Protection and Addressing Informality in Latin America, OECD Publishing, Paris, https://doi.org/10.1787/86c1fd38-en.

OECD Global Forum Productivity webpage

Economics Department LAC webpage


The fiscal impact of population ageing: How can we afford getting older?

By Vassiliki Koutsogeorgopoulou and Hermes Morgavi, OECD.

Populations are ageing in most countries, including emerging economies. The share of population aged 65 years and over has more than doubled between 1960 and 2022 across OECD countries on average, to around 18%, and is projected to reach 30% by 2060. To illustrate the magnitude of the demographic transition, the share of population aged 80 and over will rise even more dramatically, by almost two and half times between 2022 and 2060 (Figure 1).

Note: OECD refers to the simple average among the OECD countries, G20 emerging economies include Argentina, Brazil, China, India, Indonesia, Russia, Saudi Arabia, and South Africa. Other OECD partner countries include Bulgaria, Croatia, Romania, Peru, Morocco, Tunisia, and Egypt. The highlighted area refers to the projection period, starting in 2024. Projections are based on the “medium variant” population projections from the United Nations.
Source: United Nations World Population Prospects: The 2024 Revision.

Living longer and ageing in better health are major accomplishments, boosting people’s potential to remain active and work at a later age, participate in society and live independently for longer (Scott, 2021). However, life expectancy has increased in OECD countries in tandem with steadily declining fertility rates – currently well below replacement levels in most OECD economies (OECD, 2023). The old-age dependency ratio (defined as the number of people aged 65+ per 100 people of working age, 20-64 years old) in the OECD area has more than doubled between 1960 and 2022, as the population aged 65 and over grew at an annualised rate of 2.2% during the period, while the working-age population by merely 0.9% (United Nations World Population Prospects: The 2024 Revision).

From a fiscal perspective, population ageing can have profound consequences for the public finances, according to a recent OECD paper (Koutsogeorgopoulou and Morgavi, 2025). This is because, as previous studies have also shown (Rouzet et al., 2019; Guillemette and Turner, 2021; Guillemette and Château, 2023), age-related government spending, notably on pensions, healthcare and long-term care, exerts substantial pressure on public finances. Defined-benefit, pay-as-you-go pension systems are particularly vulnerable, as contribution rates struggle to keep up with growing retirement cohorts and longer benefit durations. While public spending on long-term care as share of GDP is generally low, it has been rising more rapidly than pension and health care expenditure over the past decades and will continue to do so, especially as the share of population 80 years and over is increasing rapidly (OECD Health database). According to OECD Long-Term Model, in the absence of corrective policy action, fiscal pressure would increase in the average OECD country by nearly 6¼ percentage points of GDP between 2024 and 2060, with ageing accounting for more than 40% (Figure 2).


Policies can help economies to adapt to population ageing, harnessing the benefits of longevity, and address the mounting fiscal pressures stemming from ageing, thereby safeguarding public finance sustainability. While the scope of demographic change varies across countries, a comprehensive policy approach is indispensable. The strategy needs to encompass measures to promote healthy ageing, including through disease prevention policies, fiscal reforms to manage the rise in age-related spending, and structural reforms to boost labour force participation of older workers and other under-represented groups.

Indicative of the large fiscal gains of comprehensive reforms, changes in retirement policies that reduce early exit pathways and link retirement ages to two-thirds of projected increases in life expectancy, in combination with labour market reforms, would lower the fiscal pressure in 2060 by around 4 percentage points of GDP for the average country, compared to a baseline no-policy change scenario, based on OECD Long-Term Model (Source: Update of (Guillemette and Château, 2023) based on OECD Economic Outlook No. 115 May 2024 database).

Policy efforts to address the fiscal implications of ageing can be complemented by measures to boost fertility and immigration. While today’s fertility rates would only raise the share of workers in the population in around two decades, ensuring continuity of support over the child’s early life course by avoiding “spending dips” is essential (OECD, 2024). Immigration can help ageing countries to address labour shortages in the short- or medium-term, though is unlikely to fully offset population ageing (André, Gal and Schief, 2024). Addressing integration challenges and enabling immigrants to reach their potential are essential.

* This blog is based on the paper by Koutsogeorgopoulou, V. and H. Morgavi (2025), “Ageing populations, their fiscal implications and policy responses”, OECD Economics Department Working Papers, No. 1844. The paper was prepared as part the work programme of the OECD Crete Centre on Population Dynamics. The Centre, established in 2023 in partnership with the Greek Government, is dedicated to advancing policy-oriented research and advisory work on demographic issues and their impact on economic prosperity: https://www.oecd.org/en/about/programmes/oecd-crete-centre-on-population-dynamics.html.

References

André, C., P. Gal and M. Schief (2024), “Enhancing productivity and growth in an ageing society: Key mechanisms and policy options”, OECD Economics Department Working Papers, No. 1807, OECD Publishing, Paris, https://doi.org/10.1787/605b0787-en.

Guillemette, Y. and J. Château (2023), “Long-term scenarios: incorporating the energy transition”, OECD Economic Policy Papers, No. 33, OECD Publishing, Paris, https://doi.org/10.1787/153ab87c-en.

Guillemette, Y. and D. Turner (2021), “The long game: Fiscal outlooks to 2060 underline need for structural reform”, OECD Economic Policy Papers, No. 29, OECD Publishing, Paris, https://doi.org/10.1787/a112307e-en.

Koutsogeorgopoulou, V. and H. Morgavi (2025), “Ageing populations, their fiscal implications and policy responses”, OECD Economics Department Working Papers, No. 1844, OECD Publishing, Paris, https://doi.org/10.1787/6aec03b3-en.

OECD (2024), “Fertility trends across the OECD: Underlying drivers and the role for policy”, in Society at a Glance 2024: OECD Social Indicators, OECD Publishing, Paris, https://doi.org/10.1787/fa367bad-en.

OECD (2023), Pensions at a Glance 2023: OECD and G20 Indicators, OECD Publishing, Paris, https://doi.org/10.1787/678055dd-en.

Rouzet, D. et al. (2019), “Fiscal challenges and inclusive growth in ageing societies”, OECD Economic Policy Papers, No. 27, OECD Publishing, Paris, https://doi.org/10.1787/c553d8d2-en.

Scott, A. (2021), “The Longevity Economy”, Health Policy, Vol 2, pp. 828–35.

Further related research

Crowe, D. et al. (2022), “Population Ageing and Government Revenue: Expected Trends and Policy Considerations to Boost Revenue”, Economics Department Working Papers, No. 1737, OECD Publishing, Paris, https://doi.org/10.1787/9ce9e8e3-en.

de Biase, P. and S. Dougherty (2023), “From local to national: Delivering and financing effective long-term care”, OECD Working Papers on Fiscal Federalism, No. 45, OECD Publishing, Paris, https://doi.org/10.1787/578b296f-en.

Morgavi, H. (2024), “Is it worth raising the normal retirement age?: A new model to estimate the employment effects”, OECD Economics Department Working Papers, No. 1823, OECD Publishing, Paris, https://doi.org/10.1787/5f2a3b40-en.

Rawdanowicz, Ł. et al. (2021), “Constraints and demands on public finances: Considerations of resilient fiscal policy”, OECD Economics Department Working Papers, No. 1694, OECD Publishing, Paris, https://doi.org/10.1787/602500be-en.


A balancing act: Reforms to tackle the Dutch housing crunch

An empty construction site in the Netherlands
To ensure affordability, the government should rebalance tax incentives, reform the rent control system, and make it easier to build.


By Daniela Glocker and Nicolas Gonne, OECD Economics Department

The Dutch housing market is under pressure. Young families trying to buy their first home face high housing prices, while long waiting lists for accessing the limited supply of social and other non-market housing leave many tenants burdened by high rents in the private market. Despite past government’s ambitious goals to build 100 000 new homes each year, affordable housing options remain elusive for too many, as discussed in the latest OECD Economic Survey of the Netherlands.

Three issues stand out: a tax system that is biased towards homeownership, rent controls that squeeze the private rental sector, and persistent barriers that hold back the supply of new housing. Addressing these will be key to creating a more affordable housing market.

Tax breaks for home ownership fuel demand — and prices

For decades, generous tax incentives have made buying a home in the Netherlands more attractive than renting (Figure 1). Homeowners can deduct mortgage interest payments from taxable income, face low taxation of the imputed rental value of their property, and first-time buyers benefit from transfer tax exemptions. These perks boost demand and push up prices. While the mortgage interest deduction has been trimmed in recent years, it remains large by OECD standards. Meanwhile, other investments like rental housing or financial assets face higher effective tax rates.

This imbalance widens wealth gaps between owners and renters. Households who can buy benefit from lower real housing costs over time, while renters face rising rents and fewer pathways to build wealth. In 2022, the median mortgage cost as a share of income was far lower than the rent burden for many tenants, especially those on lower incomes. 

A gradual rebalancing is needed. Reducing the mortgage interest deduction further, aligning the taxation of owner-occupied housing with other assets, and capping tax breaks for high-value homes could help. This would have the added benefit of easing fiscal pressures and maintaining strong public finances. Doing so gradually would reduce the risk of housing market correction, while freeing up resources for more targeted rental support.

Bottlenecks weigh on housing supply

Even as demand remains high, the supply of new housing struggles to keep up (Figure 2). Regulatory bottlenecks, long permitting times, limited land availability, and rising construction costs all contribute to a sluggish response, compounding the detrimental effects of persistent labour shortages on increasing the housing stock.

While past governments aimed to build 100 000 new homes each year, actual delivery often fell short. Complex planning procedures are a major obstacle, including due to strict zoning rules and environmental constraints. Measures to curb nitrogen emissions add further delays and push up costs.

This means too few homes are built, especially affordable, smaller dwellings for low- to middle-income households. Local governments often face conflicting incentives: they bear the costs of new infrastructure and services for growing communities but may see limited benefit from higher property values or new residents.

Some promising steps are underway. “Parallel planning” — allowing different permitting steps to happen at the same time — could shorten approval times. The last government agreed to provide financial bonuses for municipalities that deliver enough new homes, which will help align local and national goals.

But more is needed. Local authorities should have better tools and clearer incentives to make land available and unlock sites for housing. For example, well-designed land value capture instruments can help communities share in the benefits of rising land prices and reinvest in infrastructure and services.

Rent controls squeeze the private rental market

While tax breaks make buying an attractive option, strict rent controls make renting out on the private market less so. The Netherlands has a large non-market rental sector, mostly run by housing association, but the private rental market is small and shrinking.

Rent controls aim to keep housing affordable for low- and middle-income households. But frequent policy changes and tighter rules have made private investors wary. The 2024 Affordable Rent Act expanded rent regulation into the mid-priced segment. While this protects some tenants, it also reduces the incentive for private landlords to build or maintain rental homes. Many private landlords have started selling their properties to occupant-owners, further shrinking private rental supply.

A balanced approach is needed. Excessively tight rent controls should be relaxed to leave room for investment. Adjusting how rent caps are set, ensuring they reflect rising costs, and allowing modest rent increases for new builds could help. More predictable, stable rules would also reduce uncertainty for investors.

At the same time, strengthening the role of housing associations is vital. These organisations provide affordable homes for millions but face rising costs and tight financial rules. Updating funding and regulation to ensure they can maintain and expand supply is crucial.

A more balanced housing market for the future

Housing is central to people’s well-being and the economy’s resilience. A housing market that locks out new buyers and limits where people can afford to live weakens growth and deepens social divides.

The Netherlands has the tools to break this cycle. By steadily rebalancing tax incentives, reforming the rent control system, and adjusting permitting and related processes to make it easier and faster to build new homes, policymakers can deliver more affordable housing for everyone.

For more facts, figures and policy recommendations from our 2025 Economic Survey of the Netherlands, please visit the Netherlands economic snapshot page.

REFERENCES

OECD (2025), OECD Economic Surveys: The Netherlands 2025, OECD Publishing, Paris, https://doi.org/10.1787/2dd1f4aa-en.


Reducing public debt: When growth meets sound fiscal policy

By Álvaro Pina, Mauricio Hitschfeld and Takashi Miyahara, OECD.

Across the OECD, public debt reached 112% of GDP at the end of 2024, almost 40 percentage points higher than in 2007, before the global financial crisis (OECD, 2025). In the absence of offsetting fiscal policy adjustment, mounting spending pressures from ageing, defence and climate change will make debt ratios rise further. To help address these challenges, countries can draw on the lessons from past episodes of large and sustained reductions in debt-to-GDP.

In a recent paper (Pina, Hitschfeld and Miyahara, 2025), we have analysed 34 such episodes since the late 1970s, with 25 different OECD countries having experienced at least one episode. Favourable cyclical conditions have been the main driver of declining debt-to-GDP ratios, both through denominator effects and through their positive impact on budget balances. Discretionary fiscal consolidation efforts, mostly on the expenditure side, have been a more modest driver during debt reduction episodes, but have often helped to prepare the ground in the run-up to episodes. Overall expenditure restraint appears to have been accompanied by growth-friendly shifts in the composition of public spending.

Growth has helped to achieve and sustain primary surpluses

Debt reduction episodes are defined as ones that persist for a minimum of five years and bring down the gross debt-to-GDP ratio by at least 10 percentage points. All episodes start immediately after a debt ratio peak and end when the debt ratio bottoms out. The analysis considered 33 OECD advanced economies over 1976-2019, though data availability is limited for some countries.

Average GDP growth was 3.7% in years belonging to debt reduction episodes, against only 2.3% in the rest of the sample. Stronger economic growth has thus been a potent driver of debt-to-GDP ratio reduction by making the denominator grow faster, but also by enhancing tax revenues and reducing outlays on certain social transfers, such as unemployment benefits. In about 80% of the episodes the primary balance (excluding net debt interest payments) has improved relative to the year when the debt ratio peaks. Figure 1 decomposes this improvement into three parts, respectively due to:

  • changes in cyclical conditions
  • changes in budget one-offs (large and non-recurrent fiscal operations)
  • deliberate fiscal policy action (measured by changes in the underlying primary balance – the primary balance adjusted for cyclical conditions and for one-offs – as a share of potential GDP)

Better cyclical conditions clearly outweigh the other two components, featuring in 29 of the 30 episodes shown and making the largest contribution to the primary balance improvement (1.4 percentage points on average).

In good times, policy has rebuilt fiscal buffers and reformed the composition of the public finances

The contribution from improved underlying primary balances has been more modest, at only 0.4% of potential GDP on average (Figure 1). Nonetheless, fiscal consolidation efforts have often prepared the ground in the run-up to debt reduction episodes. When comparing average underlying primary balances during episodes with those in the preceding years (up to five years instead of just the previous year as in Figure 1), the improvement reaches 1.8% of potential GDP.

Debt reduction episodes have also seen important changes in the composition of spending and revenue. Consolidation has been expenditure-based, but spending items generally regarded as growth-friendly, such as health, education or investment (Cournède et al., 2014; Fournier and Johansson, 2016), have been relatively spared (Figure 2, bars). This no longer holds for investment if consolidation efforts in run-up years are included (Figure 2, diamonds), but nonetheless investment cuts in episodes and their run-ups have been, on average, considerably smaller than in other consolidation years that failed to deliver sustained debt reduction. Other spending categories have been more heavily constrained, including pensions, with the upward trend observed in recent decades halted during debt reduction episodes. Total underlying primary revenues as a share of potential GDP have on average declined slightly, with a sizeable shift from labour taxation to corporate income taxes.

Figure 2. Fiscal consolidation in debt reduction episodes has been expenditure-based and changed public finance composition
Changes in ratios to potential GDP, percentage points, average across episodes


Note (hover to read the text)
Source: OECD Economic Outlook 98 database; OECD Economic Outlook 115 database; AMECO database, European Commission’s Directorate General for Economic and Financial Affairs; and authors’ calculations.

Future reductions in the debt-to-GDP ratio may be harder to achieve, as governments face multiple spending pressures and growth is now more subdued than in many earlier episodes. New circumstances call for new approaches to fiscal adjustment, where a larger contribution from revenue increases will likely be required. Nonetheless, governments can draw lessons from past episodes in which countries have achieved large and sustained reductions in their debt ratios and changed the composition of public expenditure. A key policy insight is that governments should take advantage of good times to rebuild fiscal buffers and bring down debt ratios. It has also been possible to make significant savings in particular spending items such as subsidies and certain transfers, including pensions. Such savings need to be accompanied by improvements to the overall targeting and design of spending programmes to maintain support for those who need it most.

References

Cournède, B., A. Goujard and Á. Pina (2014), “Reconciling Fiscal Consolidation with Growth and Equity”, OECD Journal: Economic Studies, vol. 2013/1, https://read.oecd.org/10.1787/eco_studies-2013-5jzb44vzbkhd

Fournier, J. and Å. Johansson (2016), “The Effect of the Size and the Mix of Public Spending on Growth and Inequality”, OECD Economics Department Working Papers, No. 1344, OECD Publishing, Paris, https://doi.org/10.1787/f99f6b36-en

OECD (2025), OECD Economic Outlook, Volume 2025 Issue 1: Tackling Uncertainty, Reviving Growth, OECD Publishing, Paris, https://doi.org/10.1787/83363382-en

Pina, Á., M. Hitschfeld and T. Miyahara (2025), “Drivers of public debt reductions: Lessons from past episodes in OECD countries”, OECD Economics Department Working Papers, No. 1841, OECD Publishing, Paris, https://doi.org/10.1787/89a45c05-en


Monetary policy and productivity: Unpacking multifaceted links

By Guido Franco and Filiz Unsal, OECD.

Over the past decades, productivity growth has experienced a significant slowdown across most advanced economies. Existing studies point to a range of structural explanations contributing to this deceleration (André and Gal, 2024), but the recent swift tightening and subsequent easing of the monetary policy stance in many jurisdictions have also renewed interest in understanding whether, and through which mechanisms, monetary policy shifts can influence productivity dynamics.

Our new paper (Franco and Unsal, 2025) provides a comprehensive analysis of the impacts of monetary policy shocks on productivity through both (i) within firm productivity, via modified incentives and capabilities to innovate, adopt new technologies, and invest in capital and labour; and ii) variations in the reallocation of resources across firms with different productivity levels, via the heterogeneous transmission across sectors and firms. The analysis relies on the use of the local projection methodology and a large firm-level dataset, covering both manufacturing and services industries across 24 countries over the 1995-2019 period, matched to a newly published database on monetary policy shocks across countries (Choi, Willems and Yoo, 2024). This setting allows us to overcome the potential endogeneity arising from firms’ expectation of changes in policy rates.

Within firm productivity effects

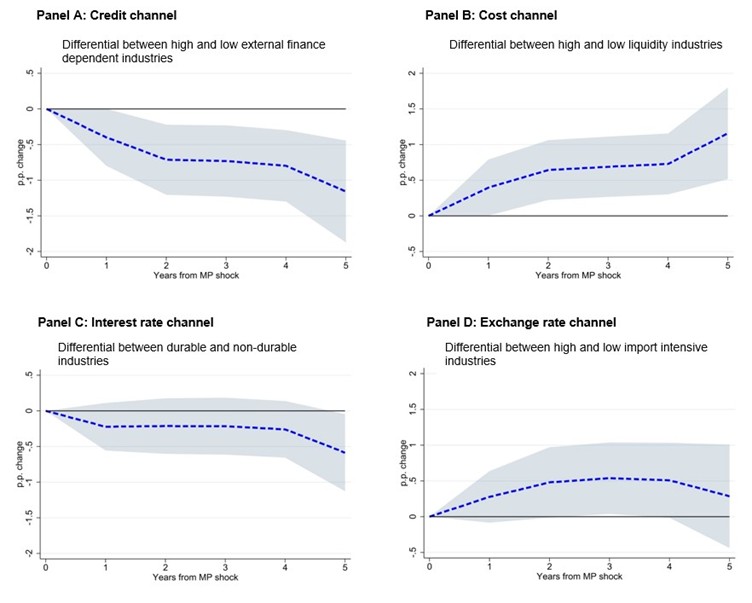
We find that, on average, firm-level productivity growth reacts significantly to changes in the monetary policy stance. A 25 basis points tightening (easing) monetary policy shock implies a cumulative decrease (increase) in productivity growth of 0.7 p.p. over a 5-year time span. Evaluating separately easing and tightening episodes, the former are found to entail slightly larger effects, but the estimates are not far from symmetry. Exploiting the differential effects across sectors and types of firms (Figure 1), we find that the credit and cost channels of the monetary transmission appear to play a relevant role in determining the dynamics of productivity after a monetary policy shock, while the interest-sensitive demand and the exchange rate channels seem to have a more limited and delayed impact.[1]

These effects are amplified or mitigated depending on the country-specific framework conditions and the counter-cyclical response of the policy to the state of the economy. Firms’ productivity is more sensitive to monetary policy shifts in countries with low financial development, in line with the relevance of the credit and cost channels of the monetary transmission. For instance, a developed financial system could allow firms to seek external capital from a variety of sources, attenuating the consequences of a tightening shock.  Moreover, firm-level productivity losses (gains) associated with monetary tightening (easing) are only observed when the economy is in a downturn, hinting that a “leaning against the wind” approach to monetary policy appears favourable not only for providing macroeconomic stability but also from a productivity perspective.

Figure 1. The credit and cost channels of monetary policy transmission appear the most relevant in determining productivity dynamics after monetary policy shocks.

Note: In each panel, the graph simulates the impact of a 25 basis points monetary policy shock. The dashed line reports the size of the effect, while the shaded area displays the 90% confidence intervals. Positive (negative) shocks stand for tightening (easing) shocks. Estimates on the interest-sensitive demand channel (Panel C) refer to industrial sectors only.
Source: OECD calculations based on Authors’ calculations based on Orbis, Choi et al. (2024), Demmou and Franco (2021), Durante et al. (2022) and OECD data.

Reallocation effects

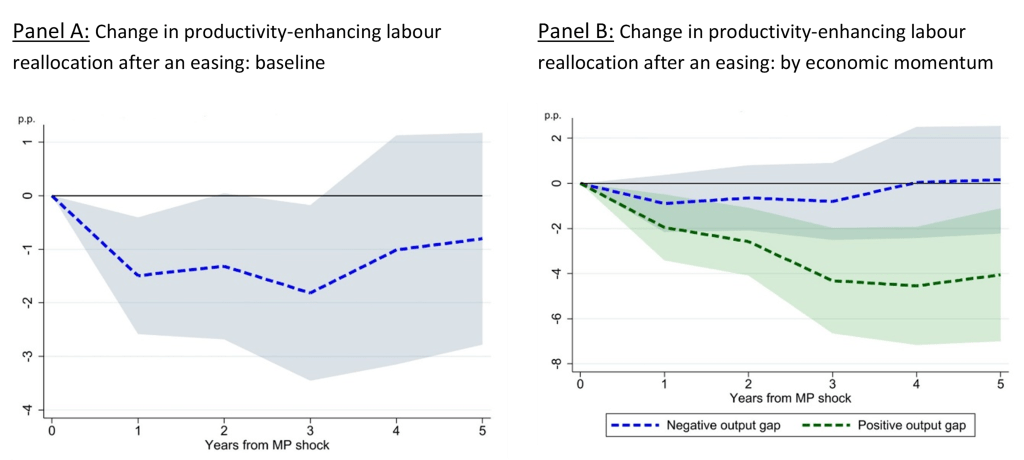
Changes in the monetary policy stance also affect the efficiency with which resources are allocated across firms. Easing episodes are associated with lower productivity-enhancing reallocation, as well as a higher share of labour and capital sunk in zombie firms.  The estimated impacts are not extensive but could imply up to a 7% reduction in the efficiency of resources reallocation over 3-years in the aftermath of a monetary easing episode (Figure 2, Panel A).

Critically, the impact is heterogeneous across countries, as it is the case with respect to within-firm productivity effects. Low barriers to competition and a deep and efficient financial system are essential to offset the misallocation effects that may follow a monetary easing episode, for instance by reducing the risk of credit flowing towards zombie firms and ensuring an effective allocation of the credit inflows arising from the relaxation of lending standards. Importantly, a monetary easing reduces the extent of productivity-enhancing reallocation only when it is pro-cyclical: increased misallocation of resources with easing shocks disappears during economic downturns, as the monetary easing may partially compensate for intensified frictions that productive firms may face when the economy is contracting (Figure 2, Panel B).

There is no significant evidence, instead, of the potentially cleansing effects of tightening episodes. Similarly, monetary policy shocks do not alter the productivity-enhancing nature of business dynamism through the extensive margin, as our estimates show that the strength of the (inverse) relationship between firm exit and productivity is unaffected. Still, when turning to business dynamism more broadly and using sector-level data, we find that the entry and exit margins adjust in opposite directions: a tightening (easing) implies higher (lower) bankruptcies and lower (higher) 1-year survival rate of newly born enterprises.

Figure 2. Monetary easing reduces the productivity-enhancing reallocation of labour, prevalently when it is pro-cyclical.

Note: Productivity-enhancing labour reallocation is measured as the strength of the relationship between firms lagged productivity and employment growth, and hence as the differential employment growth of higher productivity firms compared to lower productivity ones. The graphs simulate the impact of a 25 basis points monetary policy easing surprise.
Source: OECD calculations based on Orbis, Choi et al. (2024) and OECD data.

Conclusion

Productivity dynamics are significantly influenced by monetary policy shocks, but the impacts may depend on the transmission channels involved, country-specific framework conditions and cyclical alignment of the monetary policy responses.

Specifically, a monetary easing boosts firm-level productivity in the medium-term, mainly through investment, but also tends to slow down the productivity-enhancing nature of labour and capital reallocation across firms. On the other hand, tightening episodes are detrimental for firm-level productivity and neutral from a misallocation perspective. The productivity benefits are larger and the losses smaller when sound policies are implemented. Developing a deep and stable financial system, ensuring competitive product markets, while avoiding pro-cyclical changes in the monetary policy stance, helps leverage the advantages and minimise the productivity damages associated with policy rates shifts.

References

André, C. and P. Gal (2024), “Reviving productivity growth: A review of policies”, OECD Economics Department Working Papers No. 1822, OECD Publishing, Paris, https://doi.org/10.1787/61244acd-en.

Choi, S., T. Willems and S. Y. Yoo (2024), “Revisiting the monetary transmission mechanism through an industry-level differential approach”, Journal of Monetary Economics, Vol. 145, 103556, https://doi.org/10.1016/j.jmoneco.2024.103556.

Demmou, L. and G. Franco (2021), “Mind the financing gap: Enhancing the contribution of intangible assets to productivity”, OECD Economics Department Working Papers No. 1681, OECD Publishing, Paris, https://doi.org/10.1787/7aefd0d9-en.

Durante, E., A. Ferrando and P. Vermeulen (2022), “Monetary policy, investment and firm heterogeneity”, European Economic Review, Vol. 148, 104251, https://doi.org/10.1016/j.euroecorev.2022.104251.

Franco, G. and F. Unsal (2025), “Monetary policy and productivity: Unpacking multifaceted links”, OECD Economics Department Working Papers No. 1843, OECD Publishing, Paris, https://doi.org/10.1787/e1d617b2-en.


[1] The credit channel relates to the sensitivity of the external financing premium to changes in policy rates. The interest rate channel is the driven by the impact of changes in interest rates on the interest-sensitive component of demand. The exchange rate channel concerns the negative impact that a tightening (easing) could have on exporting (importing) industries through the appreciation (depreciation) of the domestic currency. The cost channel is instead related to firms’ need to pay factors of production before receiving sale revenues, and thus to borrow some working capital; a change in the cost of borrowing would then be alike to a change in inputs prices.


Generando espacio fiscal para un crecimiento sólido, sostenible y ampliamente compartido en el Perú

Por Aida Caldera-Sánchez, Paula Garda y Michael Koelle, OCDE.

Disponible en inglés

El Perú tiene la oportunidad de combinar un mayor crecimiento económico con finanzas públicas sostenibles. Durante las dos últimas décadas, Perú fue una de las economías de más rápido crecimiento en América Latina, apoyada en un robusto macro macroeconómico que incluye reglas fiscales, una política monetaria creíble y una supervisión financiera robusta. Una gestión fiscal prudente permitió elevar los niveles de vida y atraer inversión, y ayudó a afrontar diversos choques externos y domésticos. Sin embargo, el crecimiento se ha desacelerado desde el fin del boom de las materias primas, lastrado por la debilidad de la inversión privada y una productividad estancada. Al mismo tiempo, en los últimos años los déficits fiscales han superado las metas de la regla fiscal, con medidas que aumentan el gasto sin un claro financiamiento y otras medidas que erosionan la base tributaria. Si estas tendencias se mantienen, existe el riesgo de debilitar el sólido marco macroeconómico que hasta ahora ha sustentado la resiliencia de la economía peruana.

Como proyecta el recientemente publicado Estudio Económico de la OCDE sobre el Perú, el crecimiento se moderará a 2,8% en 2025 y 2,6% en 2026, en un contexto de incertidumbre global y doméstica, y tasas de crecimiento cercanas a la capacidad de crecimiento de largo plazo de la economía. Esto hace que la sostenibilidad fiscal sea aún más urgente, ya que, con un menor crecimiento, estabilizar la deuda se vuelve más difícil. Adicionalmente, las proyecciones de la OCDE muestran déficits fiscales por encima de los límites de la regla fiscal en los próximos años, requiriendo un ajuste adicional de alrededor de 0,4% del PIB. Sin un mayor esfuerzo de movilización de ingresos y un control más estricto del gasto, cumplir las reglas fiscales seguirá siendo un desafío incluso en el mediano plazo.

Por qué importa el espacio fiscal

Para aumentar la capacidad de crecimiento de largo plazo, el Perú necesita espacio fiscal para invertir en educación, protección social, infraestructura y adaptación al cambio climático. Sin reformas para financiar gasto público ya comprometido, la deuda aumentará de forma sostenida incluso desde un punto de partida bajo (línea roja de la Figura 1). En cambio, una mayor eficiencia en el gasto, una reforma tributaria integral (línea naranja) y una ambiciosa agenda de reformas pro-crecimiento (línea verde) para elevar la productividad, reducir la informalidad y fortalecer las instituciones mantendrían la deuda en una trayectoria sostenible. En conjunto, estas reformas le darían al Perú los medios para acelerar la convergencia de su ingreso  per cápita a los países de la OCDE y elevar los niveles de vida.

Cumplimiento de la regla fiscal

La prioridad inmediata es reducir el déficit fiscal para que vuelva a estar dentro de los límites de la regla. Esto es fundamental para mantener la confianza de los inversionistas, conservar bajos los costos de financiamiento y preservar la capacidad del gobierno para responder a choques futuros. Cumplir con la regla fiscal puede lograrse controlando el gasto corriente —en especial la planilla, que tiende a aumentar en años electorales— eliminando gradualmente el subsidio al diésel bajo el Fondo de Estabilización de Precios de los Combustibles (FEPC) y limitando la proliferación de gastos tributarios. El apoyo financiero a Petroperú, la empresa estatal de petróleo, debe acompañarse de un plan creíble para restaurar su viabilidad, incluyendo la alineación con los estándares de gobernanza de las empresas estatales de la OCDE.

Gastar mejor

Lograr que el gasto e inversión públicos sean más eficientes debe ser una prioridad. El gobierno peruano ya invierte más que muchos países de la OCDE y de la región, pero la calidad de la infraestructura sigue siendo baja, mientras que la cobertura de la protección social es incompleta y mal focalizada. La tarea es garantizar que cada sol gastado entregue servicios de calidad y llegue a quienes más lo necesitan. Perú puede reorientar recursos hacia protección social, educación y resiliencia climática, al tiempo que fortalece los registros sociales para mejorar la focalización, mejora la evaluación de proyectos de inversión mediante análisis sistemáticos de costo-beneficio y fortalece las capacidades de los gobiernos subnacionales, todo lo cual permitiría mejores resultados.

Aumentar los ingresos

La eficiencia del gasto por sí sola no será suficiente. Con ingresos tributarios de apenas 17% del PIB, el Perú tiene ingresos entre los más bajos de América Latina y muy por debajo del promedio de la OCDE de 34% del PIB (Figura 2). Esto refleja una extendida evasión fiscal, alta informalidad, una administración tributaria ineficiente y una estructura tributaria dependiente del IVA y del impuesto a la renta corporativa, pero debilitada por la baja recaudación del impuesto a la renta personal y gastos tributarios.

Por ello es necesario mejorar la administración tributaria y avanzar en una reforma tributaria integral. Fortalecer la administración tributaria implica modernizar su capacidad para garantizar el cumplimiento. Inversiones en digitalización, facturación electrónica, intercambio de datos entre entidades y auditorías basadas en riesgos harían más eficaz la fiscalización. La reforma tributaria debería incluir varios elementos:

  • Revisiones sistemáticas de los gastos tributarios, actualmente estimados en más del 2% del PIB, y cláusulas de caducidad para mantener solo las medidas con beneficios sociales o de productividad claros.
  • Simplificación de los regímenes de impuesto a la renta empresarial para las pequeñas empresas mediante la sustitución de esquemas múltiples y superpuestos por un régimen único que reduzca la evasión e incentive el crecimiento de las empresas y la formalización empresarial.
  • Ampliación de la base del impuesto a la renta personal reduciendo gradualmente el umbral a partir del cual se empieza a pagar y reemplazando las contribuciones a la seguridad social basadas en el tamaño de la empresa por contribuciones progresivas basadas en el ingreso laboral, más bajas para quienes ganan menos, para incentivar la formalización laboral.

Junto con una mayor recaudación de impuestos a la propiedad, ambientales y selectivos al consumo, estas medidas crearían un sistema tributario más justo, eficiente y con una base de ingresos más amplia.

El desafío del Perú es reactivar el crecimiento salvaguardando al mismo tiempo la sostenibilidad fiscal. El cumplimiento de la regla fiscal debe ir de la mano de una mayor eficiencia del gasto, mayores ingresos fiscales y reformas para elevar la productividad y fortalecer las instituciones, sentando las bases de la prosperidad a largo plazo.

Para más información: Panorama económico de la OCDE para el Perú.

Referencia

OCDE (2025), Estudios Económicos de la OCDE: Perú 2025, https://www.oecd.org/es/publications/estudios-economicos-de-la-ocde-peru-2025_626594d0-es.html, Publicaciones OCDE, París.


Building fiscal space for stronger, sustainable and broadly shared growth in Peru

By Aida Caldera-Sanchez, Paula Garda and Michael Koelle, OECD.

Available in Spanish

Peru has the opportunity to combine stronger growth with sustainable public finances. Over the past two decades, Peru was among the fastest-growing economies in Latin America, supported by fiscal rules, credible monetary policy, and robust financial supervision. Careful fiscal management boosted living standards, attracted investment, and helped weather repeated shocks. But growth has slowed since the end of the commodity boom, held back by weak private investment and stagnant productivity. At the same time, recent years have seen fiscal deficits exceed the fiscal rule targets, with measures that increase spending without adequate financing, and erosion of the tax base. Unless addressed, these trends risk weakening the strong macroeconomic framework that once underpinned resilience.

As the recently launched OECD Economic Survey of Peru projects, growth will moderate to 2.8% in 2025 and 2.6% in 2026, amid global and domestic uncertainty and close to the economy’s current capacity to grow in the long run. This makes fiscal sustainability even more pressing. With weaker growth, debt is harder to stabilise, and OECD projections show fiscal deficits above rule limits in both years, requiring an additional adjustment of about 0.4% of GDP. Without stronger revenue mobilisation and stricter control of spending, meeting fiscal rules will remain challenging even over the medium term.

Why fiscal space matters

To raise the economy’s capacity to grow in the long run, Peru needs fiscal space to invest in education, social protection, infrastructure and climate adaptation. Without reforms to finance already committed spending, debt ratios will rise steadily even from a low starting point (Figure 1, brown line). By contrast, more efficiency in spending, comprehensive tax reform (yellow line), and an ambitious pro-growth reform agenda (green line) to raise productivity, reduce informality, and strengthen institutions would keep debt on a sustainable path. Together, these reforms would give Peru the means to accelerate income convergence and lift living standards.

Complying with the fiscal rule

The immediate priority is to bring the fiscal deficit back within the rule limits. This is critical to retain investor confidence, keep borrowing costs low, and preserve the government’s ability to respond to future shocks. Returning to compliance can be achieved by controlling current spending—especially payroll, which tends to rise in electoral years—phasing out the diesel subsidy under the Fuel Price Stabilisation Fund (FEPC) and limiting the proliferation of tax expenditures. Ongoing support to Petroperú, the state-owned oil enterprise, must be paired with a credible plan to restore its viability, including aligning with OECD-standard governance for state-owned enterprises (SOEs).

Spending better

Making public spending and investment more efficient should be a top priority. Peru’s government already invests more than many OECD countries and those in the region, but infrastructure quality remains low, while social protection coverage remains incomplete and poorly targeted. The task is to ensure that every sol spent delivers quality services and reaches those most in need. Reorienting resources towards social protection, education, and climate resilience, while strengthening social registries for better targeting, improving project evaluation using systematic cost-benefit analysis, and building the capacities of subnational governments would improve outcomes.

Raising revenues

Higher spending efficiency alone will not be enough. At just 17% of GDP, Peru’s tax revenues are among the lowest in Latin America and far below the OECD average of 34% (Figure 2). This reflects widespread tax evasion, high informality, inefficient tax administration, and a tax structure reliant on VAT and corporate income taxes but weakened by low personal income tax collection and tax expenditures.

Improving the tax administration and advancing a comprehensive tax reform are therefore needed. Strengthening the tax administration means modernising its capacity to ensure tax compliance. Investments in digitalisation, electronic invoicing, data sharing across agencies, and risk-based audits would make oversight more effective. The tax reform should have several elements:

  • Systematic reviews of tax expenditures, currently estimated at over 2% of GDP, and sunset clauses to keep only measures with clear social or productivity benefits.
  • Simplification of corporate tax regimes for small businesses by replacing multiple overlapping schemes with a single scheme to reduce evasion and encourage business formalisation.
  • Expansion of the personal income tax base by gradually lowering the threshold at which individuals start paying and replace firm-size-based social security contributions with progressive contributions based on labour income, lower for low earners, to encourage labour formalisation.

Together with stronger property, environmental, and excise tax collection, these measures would create a fairer, more efficient tax system and broaden the revenue base.

Peru’s challenge is to reignite growth while safeguarding fiscal sustainability. Fiscal rule compliance must go hand in hand with higher spending efficiency, higher revenues, and reforms to raise productivity and strengthen institutions, laying the foundations for long-term prosperity.

For more information: OECD Economic snapshot for Peru.

Reference

OECD (2025), https://www.oecd.org/en/publications/oecd-economic-surveys-peru-2025_76f6eb73-en.html, OECD Publishing, Paris.


Reaching equal pay: a pending job

By Claudia Ramírez Bulos and Aida Caldera Sánchez, OECD

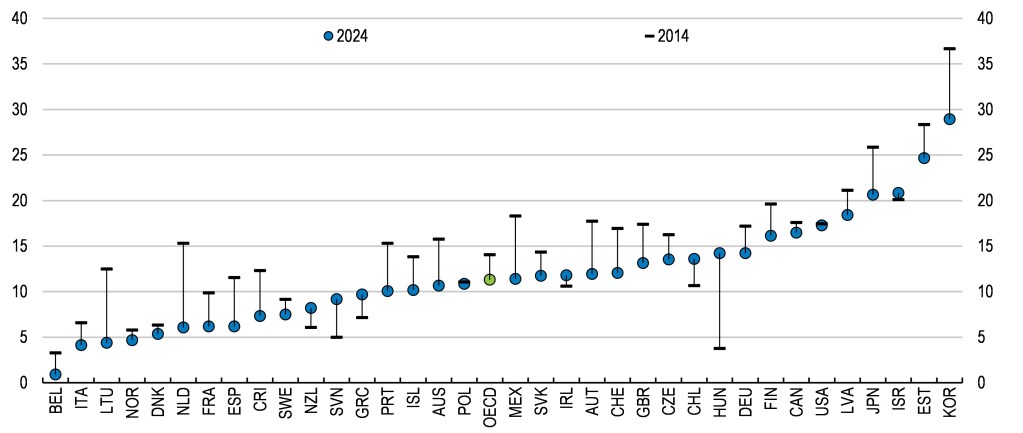
In 2024, a woman working full-time in the average OECD country took home just 89 cents for every dollar earned by a man. But the picture varies significantly by country: in South Korea, women earned 29% less than men, in Japan 22%, while in Italy and Lithuania the difference was closer to 4% (Figure 1). Despite these disparities, one thing is clear: reaching equal pay between men and women is still a pending job across OECD countries.

This picture also emerges clearly in OECD Economic Surveys, which track country-specific progress on gender equality as part of their broader assessment of labour markets and growth. From Germany to Japan, from Korea to Spain, the Surveys show that persistent pay gaps reflect not only individual choices, but structural barriers that limit women’s opportunities to participate fully in the labour market.

Figure 1. The gender wage gap remains large in most OECD countries

Difference in median full-time earnings between men and women, % of the level for men, 2014 and 2024

Note: The data for 2014 refer to 2013 for Chile. The data for 2024 refer to 2023 for Austria, Chile, Denmark, Estonia, Finland, France, Germany, Greece, Hungary, Ireland, Italy, Latvia, Netherlands, Poland, Portugal, Slovakia, Slovenia, Spain, the EU-27, and the OECD. The data for 2024 refer to 2022 for Belgium, Iceland, Israel, Switzerland. For Luxembourg the latest data refer to 2020 (0.4); for Türkiye the latest data refer to 2018 (10.0).
Source: OECD Gender wage gap statistics.

Why equal pay matter

Equal pay isn’t just about fairness, it’s about unlocking economic potential. Paying women fairly for equal work drives higher workforce participation, fuels economic growth, and helps lift families out of poverty. OECD Economic Surveys consistently underline that more equal labour markets are also more productive. Closing today’s gender pay gap builds tomorrow’s gender pension equity, ensuring women enjoy the same financial security in retirement as men.

What is behind the wage gap between men and women?

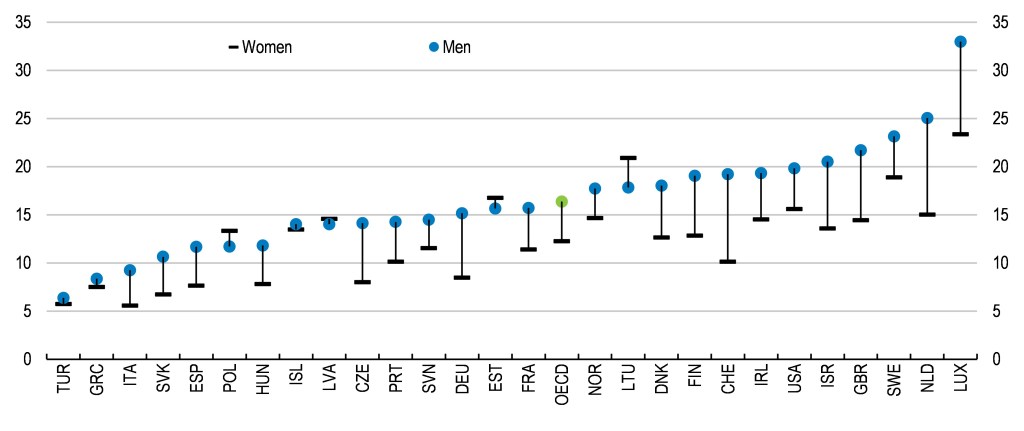
The gender wage gap reflects unequal responsibilities and unequal opportunities. OECD analysis shows that three-quarters of the gap comes from men and women with similar qualifications being paid differently within the same firm, often reflecting differences in tasks and responsibilities, or simply discrimination. The remaining quarter reflects the tendency for women to be clustered in lower-paid firms and industries such as care, health and education, while far fewer make it into high-paying, fast-growing fields like information, communications and technology (Figure 2)  (OECD, 2021[1]).

Economic Surveys highlight additional structural barriers:

  • In Germany, high marginal tax rates on second earners, often women, discourage full time work (OECD, 2025[2]).
  • In Japan, the Surveys stress that limited uptake of parental leave by fathers and unequal career progression for women slows efforts to close the gap (OECD, 2025[3]).
  • In Korea, pay transparency and stronger enforcement of anti-discrimination laws are flagged as priorities to tackle one of the largest gender pay gaps in the OECD (OECD, 2024[4]).

These structural obstacles are compounded by women still bearing a disproportionate share of unpaid household and care work — about four hours a day on average in OECD countries, twice as much as men (Figure 3), leaving less time for paid work, training, or promotions. Also, women’s greater likelihood of working part-time or fewer hours (voluntary and involuntary) limits their experience, career advancement, and access to higher-paying jobs. Hence women not only earn less per hour worked but work less hours on average. 

Figure 2. Fewer women work in high-paid jobs than men

ICT specialists and users in their job by gender, % of all jobs, 2022

Source: OECD Going Digital Toolkit gender indicators.

Figure 3. Women assign more time to unpaid household and care work than men

Average time spent by women on unpaid care and domestic work, female to male ratio

Note: “Unpaid care and domestic work” includes routine housework and care for household and non-household members.
Source: OECD Time use database 2024.

Progress and policy lessons

The gender pay gap has narrowed by around three percentage points across the OECD in the last decade (Figure 1), thanks to reforms in education, labour market and social policies. OECD Economic Surveys show how tailored policy packages deliver results.

  • Austria reduced its gap through a mix of measures that strengthened pay transparency and reporting laws, reinforced equal treatment and anti-discrimination legislation, and supported women with mentoring programs and initiatives to balance family and work responsibilities — all while encouraging more women to take on leadership roles.
  • Spain has also made significant progress, reducing its pay gap by 5.3 points over the past decade. This improvement reflects higher labour market participation, more women moving into full-time roles and higher-paying industries, and the implementation of stronger pay transparency rules to target gender discrimination, which apply to companies with more than 50 employees.
  • Australia narrowed its gap through expanded parental leave, subsidised childcare, growth of more flexible work arrangements, wage setting reforms and mandatory pay reporting.

These cases illustrate that progress is possible, but also that achieving pay equity requires a comprehensive approach that tackles barriers at home and in the workplace.

The road ahead

A consistent message across OECD Economic Surveys is that progress requires coordinated action on childcare, family leave, tax design, and workplace practices (Gonne and Trincão, 2024[5]):

  • Expanding affordable childcare, improving shared and flexible parental leave.
  • Reforming tax and benefit systems to remove disincentives to work for second earners, often women.
  • Making fair wage-setting practices including mandatory pay transparency policies, requiring employers to publish gender wage gaps and giving workers the right to know what colleagues in comparable roles earn the norm.
  • Supporting women’s access to leadership and decision-making roles such as temporary quotas, mentorship programs, and women’s networks.
  • Awareness campaigns and data collection to monitor, evaluate, and improve the effectiveness of policies.

Equal pay will not come automatically. It requires deliberate policy action, sustained monitoring, and a commitment to use all the available talent to strengthen economies and societies.

OECD Economic Surveys will continue to track country-specific progress, helping governments design and implement reforms ensuring that equal pay is not only a principle, but a reality.

References

Gonne, N. and M. Trincão (2024), “Gender mainstreaming in OECD Economic Surveys”, OECD Economics Department Working Papers No. 1831, https://dx.doi.org/10.1787/4d7041d7-en. [5]
OECD (2025), “OECD Economic Surveys: Germany 2025”, https://doi.org/10.1787/39d62aed-en. [2]
OECD (2025), “OECD Economic Surveys: Japan 2024”, https://doi.org/10.1787/41e807f9-en. [3]
OECD (2024), “OECD Economic Surveys: Korea 2024”, https://doi.org/10.1787/c243e16a-en. [4]
OECD (2021), “The Role of Firms in Wage Inequality: Policy Lessons from a Large Scale Cross-Country Study”, https://doi.org/10.1787/7d9b2208-en. [1]


Estonia’s new car tax and registration fee: Are they changing consumer demand?

By Zuzana Smidova and Vaiva Šeckute, OECD

At the beginning of the year, Estonia introduced a vehicle registration fee and an annual car tax linked to the vehicle’s greenhouse gas (GHG) emissions. Until then, it was one of the few European countries without motor vehicle taxes.

OECD countries increasingly use vehicle taxation to encourage drivers to switch to cleaner cars and reduce emissions, as well as to raise revenue, by linking these taxes to emissions. Although motor fuels are already taxed, consumers tend to undervalue the long-term savings from choosing more efficient vehicles, so registration fees can help change purchasing patterns.

Estonia’s car fleet is one of the oldest in the EU and has some of the largest engines (Figure 1). Transport emissions account for around one fifth of Estonia’s total greenhouse gas emissions. Achieving the target of a 25% decrease by 2035 compared to the 2005 level is proving challenging with emissions remaining stable in recent years.

In 2023, the average CO2 emissions per kilometre from new passenger cars were among the highest in the EU (Figure 2).  This partly reflects reliance on purchases of second-hand cars from western Europe and the absence of an emissions-based motor vehicle tax.

Data from the first eight months of the year show that, since the tax was introduced, purchasing has moved more rapidly than before towards cars emitting less emissions (Figure 3). The overall number of passenger car registrations dropped as many consumers who had planned to buy a car did their purchases last year in anticipation of the tax. Looking at the breakdown by vehicle type, there has been a shift towards cleaner vehicles. The data shows that the registrations of electric vehicles increased, while registrations of hybrid cars declined less than petrol and diesel cars compared to the same period of last year. As a result, the share of electric vehicles rose from about 5% last year to 10% and the share of hybrid vehicles grew from some 25% to almost 40%. Encouragingly, based on these first estimates, average emissions from newly registered cars also fell by 10% (ERR, 2025).

Introducing the registration fee and annual tax are a significant achievement and the link to emissions and engine size seem to be bearing fruits. Nevertheless, some of its features could be improved further. The annual tax decreases with vehicle age. While this aims to make it more affordable for those on low incomes who tend to have old cars, it undermines the incentives to switch to more efficient cars. Instead, a targeted car scrappage scheme for older vehicles financed by the revenues from the motor tax could be considered.

Decreasing emissions from transport will require strong incentives on multiple fronts – increasing availability of public transport, introducing stricter minimum emission standards and moving towards distance-based charging, which can allow for higher charges where alternatives for cleaner modes of transport exist (OECD, 2024; van Dender, 2019).

References

ERR (2025): Automaks on pannud ostma väiksema heitega autosid

OECD (2024), OECD Economic Surveys – Estonia, OECD Publishing, Paris.

Van Dender, K. (2019), Taxing vehicles, fuels and road use: Opportunities for improving transport tax practice, OECD Taxation Working Papers No. 44, OECD Publishing, Paris.