Why Regulating Lobbying Matters for Competition: New Insights from the OECD PMR Indicators
Category: Product market regulation,Uncategorized
written by oecdecoscope | January 28, 2026
By Cristiana Vitale, OECD Economics Department.
Effective competition is central to vibrant economies. It keeps prices low for consumers, encourages firms to improve their products, foster an efficient use of resources, and helps innovative new firms enter markets. But market competition depends on well-designed regulation and critically, on the way policymakers interact with the stakeholders affected by those rules. A new OECD working paper highlights how stakeholder consultation is a key part of an effective regulatory framework, but inadequate transparency and accountability in interactions with interest groups risk tilting the playing field in favour of well-resourced incumbent firms.
A growing body of research shows that well-connected firms often use political influence to shape rules in ways that protect their market position by pushing for complex regulatory requirements that are disproportionately costly for smaller or newer competitors, or to obtain preferential access to contracts and loans. Political connections can help less productive firms survive while preventing more innovative ones from scaling up. The consequences are clear: markets become less contestable, innovation slows, and productivity growth suffers.
The latest update of the OECD Product Market Regulation (PMR) indicators, which track laws and regulations across 47 countries, shows that most governments require stakeholders to be consulted when new laws and regulations are drafted. This could improve policy design as stakeholder engagement helps policymakers to better understand the real-world effects of regulatory intervention. But the same data also reveal major gaps in how countries manage lobbying activities and ensure integrity standards, leaving policymaking vulnerable to undue influence (see Figure 1 below).
It is notable that more than one-half of the surveyed countries lack basic integrity safeguards for public officials involved in regulatory processes. One-third lack comprehensive conflict-of-interest rules, and over one-third do not require any cooling-off period if senior officials leave office for the private sector. Strikingly, the two countries in the survey that have none of these two integrity standards are OECD members.
Transparency in lobbying interactions is even more limited. Only two countries—Chile and Poland—meet all four key disclosure requirements assessed in the PMR data, including maintaining a public lobbyist registry and requiring policymakers to disclose both their meeting agendas and the identities of the interest groups they meet. Twelve countries have none of these obligations.
Even when lobbying registries exist, they often cover only some types of interest groups or are voluntary. Public officials’ disclosure obligations are also rare: just 28% of countries require officials to reveal which interest groups they meet, and only 23% require meeting agendas to be published online.
As governments increasingly use industrial policies to promote innovation, encourage decarbonisation, and support strategic sectors, strong safeguards against undue influence are becoming more important. Lobbying is not inherently negative; policymakers benefit from engaging with stakeholders who understand the real-world effects of regulations. However, unregulated lobbying can redirect subsidies and support toward well-connected incumbents rather than potential innovators. This undermines the effectiveness of public spending and entrenches market power instead of encouraging technological dynamism and reducing barriers to the entry and growth of new companies.
With evidence of rising market concentration across advanced economies, the risk that lobbying will impede competition is likely to grow. The new PMR data reveal a clear message: while most countries value stakeholder engagement, many do too little to ensure transparency and integrity in lobbying practices. Strengthening rules on conflicts of interest, expanding disclosures by both lobbyists and public officials, and ensuring open registers of interest groups would help restore trust and support competitive markets.
References
Vitale, C. and R. Bitetti (2026), “Regulating lobbying activities to protect competition: New evidence from the OECD PMR indicators”, OECD Economics Department Working Papers, No. 1855, OECD Publishing, Paris, https://doi.org/10.1787/ad88f58a-en.
Akcigit, U., S. Baslandze and F. Lotti (2023), “Connecting to Power: Political Connections, Innovation, and Firm Dynamics”, Econometrica, Vol. 91/2, pp. 529-564, https://doi.org/10.3982/ecta18338.
Alexander, R., S. Mazza and S. Scholz (2009), “Measuring Rates of Return for Lobbying Expenditures: An Empirical Case Study of Tax Breaks for Multinational Corporations”, SSRN Electronic Journal, https://doi.org/10.2139/ssrn.1375082.
Koltay, G., S. Lorincz and T. Valletti (2023), “Concentration and Competition: Evidence From Europe and Implications For Policy”, Journal of Competition Law & Economics, Vol. 19/3, pp. 466-501, https://doi.org/10.1093/joclec/nhad012.
Estancados a los 52? Repensar el subsidio de desempleo para las personas mayores en España
Category: Uncategorized
written by oecdecoscope | January 28, 2026
Por Aida Caldera, Claudia Ramírez y Dimitris Mavridis, Departamento de Economía de la OCDE
El mercado laboral español se ha recuperado con fuerza en los últimos años y creó 3,5 millones de empleos entre 2018 y 2025, pero muchos trabajadores mayores siguen desempleados. Aunque el empleo entre las personas mayores aumentó del 41% en 2004 al 61% en 2024, alrededor de la mitad de los desempleados de larga duración son trabajadores de 50 años o más. Alrededor de medio millón de solicitantes de empleo de 52 años o más llevan años sin trabajar —muchos desde la crisis de la vivienda— y afrontan grandes obstáculos para reinsertarse en el mercado laboral.
Ayudar a estas personas a reinsertarse en un empleo que aproveche sus capacidades no es solo una necesidad social o económica; es también una oportunidad. A medida que aumenta la esperanza de vida y más personas llegan a edades avanzadas en buen estado de salud, España puede hacer más para apoyar a los trabajadores mayores a mantenerse activos. Pero para lograrlo es necesario repensar reglas de prestaciones que han quedado desfasadas y reforzar los sistemas de apoyo. Con una población que envejece y una natalidad baja, alargar las carreras laborales de trabajadores sanos y con experiencia es crucial para fortalecer el crecimiento y las finanzas públicas hoy, y para proteger las pensiones en el futuro.
¿Qué está pasando?
Una de las razones detrás del alto desempleo de larga duración entre los trabajadores mayores de 52 años en España es el diseño del subsidio por desempleo. El sistema de prestaciones por desempleo en España se apoya en dos pilares. El primer pilar es la prestación contributiva, que sustituye una parte de los ingresos previos durante un máximo de 24 meses, siempre que el trabajador haya acumulado suficientes cotizaciones. Cuando se agota la prestación contributiva, o si no se cumplen los requisitos, entra en juego el subsidio por desempleo, que ofrece una cuantía fija.
El subsidio por desempleo tiene características específicas para las personas de 52 años o más. La ayuda puede mantenerse hasta la jubilación, y la elegibilidad se basa en la renta individual y no en la del hogar. Más importante aún, el Servicio Público de Empleo Estatal (SEPE) cotiza a la Seguridad Social por cuenta del beneficiario como si estuviera trabajando a jornada completa. Para quienes tienen 52 años o más, el tiempo en subsidio genera derechos de jubilación de forma similar al empleo, con cotizaciones registradas al 125% de la base mínima de cotización. Así, hoy alrededor del 70% de quienes reciben un subsidio por desempleo de larga duración tienen 50 años o más (Figura 1).
Aunque este apoyo protege a quienes realmente lo necesitan, su diseño puede, de forma no intencionada, debilitar los incentivos a volver al trabajo, incluso para quienes desearían hacerlo. Para muchos beneficiarios mayores, aceptar un empleo a un salario bajo implica perder tanto el subsidio como las cotizaciones a la pensión que se acreditan durante el desempleo, de modo que la ganancia neta de trabajar puede ser muy reducida. La evidencia reciente muestra que el desempleo de larga duración aumenta bruscamente a los 52 años, el punto en el que se accede al subsidio especial. Mientras que a los 50 años menos del 5% de los beneficiarios lleva más de un año en desempleo, a los 52 esa cifra supera el 40% (AIReF, 2024).
Una reforma reciente reconfiguró el subsidio por desempleo
Una reforma importante que reconfigura el subsidio asistencial por desempleo comenzó a aplicarse en 2025. Amplió la elegibilidad a personas previamente excluidas, extendió la duración de la ayuda para algunos beneficiarios, aumentó las cuantías de base, e introdujo una reducción gradual con el tiempo para incentivar a retomar un empleo. También se introdujo un nuevo complemento al empleo que permite conservar una parte decreciente del subsidio durante hasta 180 días cuando se vuelve a trabajar. Sin embargo, no modificó el régimen especial del subsidio para demandantes de empleo de 52 años o más, donde persisten los mayores desincentivos a la reincorporación laboral.
Prioridades de reforma
Para facilitar carreras laborales más largas y reducir el desempleo de larga duración entre los trabajadores mayores, España podría reformar la asistencia no contributiva para las personas mayores de 52 años. Es clave igualar el apoyo entre edades, con un enfoque y una activación más precisos. En concreto, España podría reformar el subsidio por desempleo mediante:
armonizar las reglas para que la ayuda no se vuelva indefinida a partir de una edad concreta;
limitar la generación de derechos de pensión únicamente a la fase del seguro contributivo, evitando la acumulación de pensión durante la asistencia;
introducir una prueba de recursos por hogar para orientar los recursos hacia los más necesitados en vez de los mayores de edad;
reducir gradualmente el nivel de la prestación, con el tiempo y/o en función de los ingresos laborales, para evitar incentivos de “todo o nada”;
establecer límites razonables de duración; y
aplicar de forma sistemática requisitos de búsqueda activa de empleo y medidas de activación.
Al mismo tiempo, la reforma podría acompañarse de una mayor inversión en mejora de competencias. Los váuchers de formación cofinanciados por las empresas, especialmente en sectores con escasez de mano de obra o inmersos en transiciones digitales, podrían ayudar a los trabajadores mayores a reincorporarse y prosperar en el mercado laboral. Ampliar los acuerdos de flexibilidad del tiempo de trabajo y mejorar la concienciación entre los empleadores sobre el valor de los trabajadores con experiencia también favorecería la vuelta al empleo.
El mercado laboral español está mejorando, y muchas reformas recientes aún no han mostrado todo su impacto. Con la combinación adecuada de incentivos, oportunidades de recualificación y opciones de trabajo flexible, España puede aprovechar el potencial de los trabajadores con experiencia, impulsar la inclusión y afrontar sus retos demográficos y fiscales.
Spain’s labour market has undergone a strong recovery in recent years adding 3,5 million jobs over 2018-2025, but many older workers are still left behind. While employment among older workers has risen overall, from 41% in 2024 to 61% in 2024, close to half of the long-term unemployed are aged 50 or older. Nearly half a million jobseekers aged 52 and over have been out of work for years, many since the housing crisis, and face major barriers to re-employment.
Helping these older workers return to meaningful work is not just a social or economic need, it’s an opportunity. As life expectancy rises and more people reach older age in good health, Spain can do more to support those older workers to stay active. But doing so means rethinking outdated benefit rules and expanding support systems. With an ageing population and low birth rates, extending the careers of healthy, experienced workers is crucial to strengthen growth and public finances today, and to safeguard pensions for the future.
What is going on?
One reason behind the problem of long-term unemployment among older workers in Spain is how unemployment assistance is designed for workers aged 52 and over. Spain’s unemployment benefit system has two pillars. First, unemployment insurance (UI) replaces a portion of previous earnings for up to 24 months, provided workers have accumulated enough contributions. When the unemployment insurance runs out, or if workers don’t qualify, unemployment assistance (UA) steps in, offering a flat-rate payment.
The unemployment assistance has special features for workers aged 52 and over. The financial support can continue until retirement, and eligibility is based on the individual’s income rather than the household’s. More importantly, the Public Employment Service (SEPE) pays pension contributions on the beneficiary’s behalf as if they were working full time. For those aged 52 and over, time spent receiving unemployment assistance builds pension rights just like actual employment, with contributions recorded at 125% of the minimum contribution base. Today around 70% of those that receive a subsidy for long-term unemployment are aged 50 or older (Figure 1).
While this support helps people who really need it, its design may unintentionally reduce incentives to work, even for those who might want to. For many older recipients, accepting a low-paid job means losing both the benefit and the pension contributions credited while unemployed, which means that the net gain from working can be minimal. Recent evidence shows that long-term unemployment increases sharply at age 52, the point when people become eligible for the special subsidy. While fewer than 5% of assistant recipients are unemployed for over a year at age 50, that figure rises to more than 40% by age 52 (AIREF, 2024).
A recent reform reshaped unemployment assistance
A major reform reshaping unemployment assistance started to be implemented in 2025. It broadened eligibility to groups previously excluded, extended benefits for some recipients, raised payments while gradually reducing them over time to keep incentives strong, and introduced a new employment supplement that allows people to keep part of their subsidy for up to 180 days when they return to work. However, it did not change the special unemployment assistance scheme for jobseekers aged 52 and over, where the strongest work disincentives remain.
Policy priorities
To support longer working lives and reduce long term unemployment among older workers, Spain could reform the non-contributory assistance for workers aged 52 an over. It is key to equalize support across ages, with stronger targeting and clearer activation. Concretely, Spain could reform non-contributory unemployment assistance by:
aligning rules so support does not become indefinite at a specific age;
restricting pension accrual to the unemployment insurance phase only, avoiding pension build-up during assistance;
introducing household means-testing to target resources to those most in need rather than age;
tapering benefit levels gradually, over time and/or with earnings, to reduce “all-or-nothing” incentives;
setting reasonable duration limits; and
enforcing active job search and activation requirements consistently.
At the same time, the reform should go hand in hand with greater investment in upskilling. Training vouchers co-financed by employers, especially in sectors facing labour shortages or undergoing digital transitions, could help older workers re-enter and thrive in the workforce. Expanding flexible working-time arrangements and improving awareness among employers of the value of experienced workers would support reemployment.
Spain’s labour market is improving, and many recent reforms have yet to show their full impact. With the right mix of incentives, re-training opportunities and flexible work options, Spain can unlock the potential of experienced workers, support inclusion and address its demographic and fiscal challenges.
How the Lucky Country Can Stay That Way: Improving Productivity Growth, Housing Affordability and Fiscal Sustainability in Australia
Category: Uncategorized
written by oecdecoscope | January 28, 2026
Australia is often called the “Lucky Country,” but maintaining high living standards will require reforms to lift productivity growth, restore housing affordability, and strengthen fiscal sustainability. Drawing on the OECD Economic Survey of Australia 2026, this blog highlights key priorities—from boosting competition and business dynamism to easing housing supply constraints and improving the tax mix—while keeping long-term resilience and climate risks in view.
By Geoff Barnard and David Cashin, OECD Economics Department
Today Australians are marking their national day, with citizenship ceremonies, community celebrations, awards, speeches and sporting events. As they do each year on this day, they are reflecting on their history and looking to the future. The OECD’s latest Economic Survey of Australia, released last week, confirms that they have good reason to be proud of their achievements and optimistic about what lies ahead.
Australia enjoys enviable macroeconomic stability and some of the highest living standards among OECD countries, supported by strong institutions and abundant human capital. At the same time, policymakers must grapple with a number of challenges to ensure that macroeconomic stability is maintained and living standards continue to rise.
Like much of the rest of the world, Australia’s economy went through a series of large fluctuations in the years since the onset of the COVID-19 pandemic, experiencing multi-decade highs and lows for GDP growth, inflation, unemployment and interest rates, as well as large swings in budget balances. Australia continued, however, to prove relatively resilient, with lower peak inflation than most OECD peers and avoiding recession in the post-pandemic period as interest rates rose. And there is evidence that the turbulence of the recent past is subsiding, with growth picking up, inflation converging on target, unemployment low and public finances stabilising.
While the ratio of public debt to GDP jumped during the pandemic, it remains low compared to most OECD countries, and the general government deficit is likely to narrow slightly over the next few years. Even so, to safeguard fiscal sustainability and maintain room for manoeuvre, budget deficits at the national and state levels will need to be reduced further over the medium term through a well-designed combination of expenditure restraint and revenue-enhancing tax reforms. In doing so, there is scope to improve the efficiency of the tax mix, notably by broadening the base of the Goods and Services Tax via reduced exemptions and perhaps also a higher rate, while reducing the reliance on taxes on labour.
Housing is an especially pressing policy issue. Although Australia is among the countries with the highest average living space per person, housing affordability is severely strained. The ratio of house prices to income rose by more in Australia over the past 30 years than in any other OECD country, and with the sharp rise in interest rates from mid-2022, mortgage payments increased rapidly in the last few years, given Australia’s high share of adjustable-rate mortgages. Rent inflation also surged at this time, and more than half of low-income renters are in rental stress (paying more than 30% of income in rent). The main cause of the affordability crisis is the persistent failure for new housing supply to keep pace with household formation, and the key to resolving it is removing supply constraints, in particular by easing restrictive land-use regulations at the local level. This is especially critical in the major cities, where higher-density construction should be facilitated, particularly around transport connections. It would also be helpful to build more social housing, which accounts for about 4% of the housing stock, down from 6% in 1990 and only about half the OECD average.
Source: OECD Analytical house price indicators and Australian Bureau of Statistics.
While the fall in economy-wide labour productivity since 2021 largely reflects a combination of cyclical and idiosyncratic factors related to the pandemic, trend productivity growth has slowed over the past 20 years, and this has coincided with a fall in business dynamism and a rise in market concentration, markups and profit margins. Firm entry and exit plays a key role in productivity growth via creative destruction and resource reallocation, as more productive firms expand and less productive ones are displaced. To reinvigorate productivity growth and reduce cost-of-living pressures on consumers, reforms are needed to encourage greater competition. The government’s Competition Review that began in 2023 has taken promising steps towards these objectives, including the introduction of a mandatory notification merger regime and an agreement between the Commonwealth, state and territorial governments to revitalise the country’s National Competition Policy. However, additional measures to improve competition will be needed, including successful implementation of the new merger regime, a strengthening of abuse-of-dominance enforcement, boosting the powers of the Australian Competition and Consumer Commission and tackling barriers to competition due to regulatory fragmentation within Australia’s federal system. Adopting an expedited approach to recognising trusted overseas standards and reducing regulatory restrictions on foreign direct investment would also help.
The recent severe bushfires and floods in Victoria are just the latest reminder of Australia’s vulnerability to climate change. Apart from the risk to human life, rising temperatures and extreme weather events can damage infrastructure and other capital (including natural capital) and negatively affect labour productivity. Australia needs both to continue making progress on policies to mitigate climate change and to further develop and implement its relatively advanced plans for adaptation. Carbon emissions, while still among the highest in the OECD in per capita terms, are falling towards Australia’s 2030 target, and the targets for 2035 announced last year reflect a high degree of ambition, but further policy efforts will be needed to achieve the goal of Net Zero by 2050. Challenges remain to expand the share of renewables in the electricity grid and manage the transition as coal exits the electricity system; reduce emissions in transport and agriculture; and ensure that land-use regulation reflects climate risks. Australia has among the lowest net effective price of carbon emissions in the OECD, and greater use of pricing, including via the Safeguard Mechanism for industrial emissions as well as in agriculture, would help to achieve the Net Zero objective.
Stablecoins on the rise: A risk for financial stability?
Category: Digitalisation,Uncategorized
written by oecdecoscope | January 28, 2026
By Caroline Roulet, OECD Economics Department.
Stablecoins are a type of crypto-asset designed to maintain a stable value by anchoring to a reference asset (often US Treasury bills). They offer convertibility on demand at par, and fee-free, immediate and pseudonymous transactions, making them an attractive means of payment, especially across borders. The market value of stablecoins has risen rapidly, with two issuers that mainly rely on USD-denominated collateral accounting for almost 90% of the global market capitalisation (Figure 1). Stablecoins are still only a small part of financial markets, but as they expand and become more intertwined with traditional finance they pose non-negligible risks to financial stability and important challenges for financial regulation and monetary policy.
As discussed in the latest OECD Economic Outlook the total value of payments using stablecoins surpassed that of major traditional digital payment providers in 2024-25 (Figure 2, Panel A). Currently, stablecoins are mainly used to settle trades in other crypto-assets, and now account for around 80% of all trades on crypto-asset platforms (ECB, 2025), although usage for other payments by corporates and households has begun to rise.
Though less risky than crypto-assets as a whole, some stablecoins have experienced significant price volatility, particularly those that are not fiat-collateralised (i.e. not fully backed by assets denominated in currency terms, such as US Treasury bills or bank deposits). Fiat-collateralised stablecoins have been much more stable, but still often deviate from par in secondary markets (Aldasoro et al, 2025). In contrast to the majority of bank deposits, stablecoins are typically uninsured. Variation in the value of their backing assets (and subsequent deviations of stablecoins’ market value from their original face value) can therefore prompt holders to request redemptions, with ensuing risks of liquidity shortages and fire sales of collateral.
The expansion of stablecoins raises financial stability risks. One concern is the potential effects on the pricing and operation of segments of critical funding markets, such as sovereign debt markets (Aldasoro et al., 2025), as stablecoin issuers are now major holders of US Treasury bills (Figure 2, Panel B). Investor inflows into stablecoins and asset sales to meet redemptions could thus affect short-term bond yields and hence monetary policy transmission. Stablecoin issuers’ generation of additional income through reverse repos (lending securities to traditional financial intermediaries who then pledge them as collateral) may also add to potential strains on repo market liquidity at times of stress.
Figure 2. Stablecoin transactions are expanding and holdings of US Treasury bills are sizeable
Note: In Panel A, Visa and Mastercard payments primarily reflect settlements for goods and services, while stablecoins have been primarily used so far to settle trades in other crypto-assets. Payments data (Gross Dollar Volume, GVD) for Mastercard in 2025 is available through Q3, with Q4 estimated using the average GDV from the first three quarters. Panel B reports holdings of US T-bills by selected domestic and foreign holders and major stablecoins issuers (Tether and USD Coin) as of 2025 Q3. Source: Artemis Analytics; Tether and USD Coin transparency reports; US Federal Reserve; US Department of the Treasury; Visa and Mastercard annual reports; and OECD calculations.
The expansion of stablecoins may also pose risks to banks. Companies with crypto-related business models, including stablecoin issuers, also hold bank deposits (as required by regulation in some jurisdictions). This could prove an unstable deposit base if stablecoin issuers suddenly withdraw funds to meet liquidity needs (ECB 2025), potentially disrupting bank credit availability.
The growing adoption and use of stablecoins, alongside their ability to circulate freely across borders, poses economic policy challenges. In emerging-market economies, the use of foreign‑currency denominated stablecoins could raise exchange rate volatility at times of stress and enable foreign exchange regulations to be bypassed. This would make standard indicators of capital outflows harder to interpret. More broadly, usage of foreign currency denominated stablecoins could weaken the control of monetary conditions by domestic central banks (BIS, 2025; Rey, 2025). The potential use of stablecoins for illicit activities is a further concern, raising challenges for the enforcement of anti‑money laundering and financing of terrorism regulations.
Many countries have begun to develop tailored regulations relating to stablecoins, and crypto-assets more generally. Prominent recent examples include the GENIUS Act in the United States (Guiding and Establishing National Innovation for U.S. Stablecoins Act, enacted in July 2025) and the MiCA (Markets in Crypto-Assets) Regulation in the European Union, which became effective from December 2024. However, regulatory approaches differ across countries and significant gaps and inconsistencies remain (FSB, 2025). The limited oversight of cross-border transactions is a key challenge, potentially hampering responses to systemic risks and encouraging regulatory arbitrage. The rapid growth of the stablecoin market, and the impact stablecoin usage may have on other asset markets, highlights the need for enhanced international cooperation to ensure effective regulation, supervision, and oversight of stablecoins in all jurisdictions.
REFERENCES
ECB (2025), “Just another crypto boom? Mind the blind spots”, Financial Stability Review, May, European Central Bank.
BIS (2025), Annual Economic Report, Chapter 3 “The next-generation monetary and financial system”, June, Bank for International Settlements.
FSB (2025), Thematic Review on FSB Global Regulatory Framework for Crypto-asset Activities, Financial Stability Board, Geneva. Rey, H. (2025), “Stablecoins, tokens, and global dominance”, IMF Finance and Development magazine, September.
Rey, H. (2025), “Stablecoins, tokens, and global dominance”, IMF Finance and Development magazine, September.
Powering competitiveness: Europe’s path to energy security and growth
Category: Energy,European Union,Uncategorized
written by oecdecoscope | January 28, 2026
by Ruben Maximiano and Wouter Meester, OECD Economics Department.
Europe’s competitiveness is increasingly linked to the availability of secure, affordable and reliable electricity. As electrification accelerates across industry, transport, heating and digital services, including AI data centres, power has become a strategic input to growth, investment and innovation, a point also underscored by the 2024 Draghi report. However, as outlined in a recent OECD report Diagnostic Tool for Reducing Regulatory Barriers to Solar, Wind and Pumped Hydro Storagein the EU, five key types of regulatory barriers slow the deployment of these technologies in Europe. This results in significant opportunity costs, especially in the European Union, where high import dependence exposes firms and households to price volatility, supply shock and higher prices.
The 2021–22 energy crisis laid bare this vulnerability: the EU’s energy import bill surged from EUR 137 billion in 2020 to nearly EUR 549 billion in 2022. Even after prices eased, the 2023 import bill remained well above historical levels.
Why the electricity system is changing and why rules matter
At the same time, Europe’s power system is being reshaped by technologies with fundamentally different system characteristics, including variable renewables, storage, demand-side response and digital controls. These resources increase the need for flexibility, real-time coordination across grids and more granular planning, particularly as new electricity-intensive loads, such as data centres, concentrate demand in specific locations. This transformation exposes the limits of regulatory frameworks designed for a centralised, thermal-based system. Ensuring the EU’s energy security, including by delivering its new energy mix, depends on fit-for-purpose regulation as much as on physical infrastructure.
Competitiveness increasingly depends on affordable, “always-on” electricity
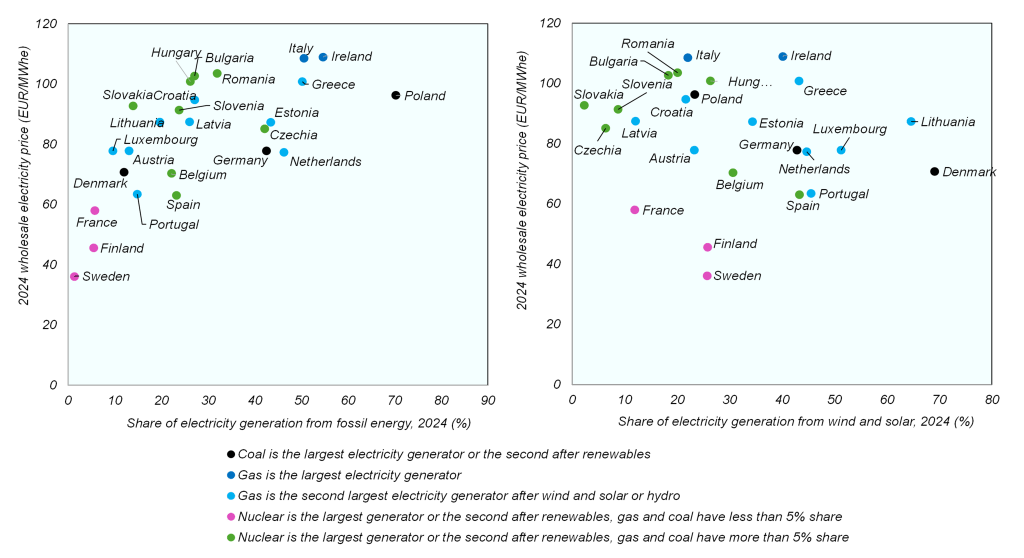
In addressing its energy security, Europe has already made important progress. Since Russia’s invasion of Ukraine, renewable energy has expanded substantially, helping to cushion price shocks (see Figure 1). Evidence suggests that EU countries with higher shares of wind and solar in their electricity mix tend to exhibit lower wholesale prices on average (Figure 2), reflecting the declining technology costs and the downward pressure renewables place on marginal pricing. Moreover, recent system-level modelling by WindEurope shows that, even once the additional cost of grids, storage and backup capacity are taken into account, a renewables-led pathway is the lowest-cost option for Europe’s power system.
Figure 2. Relationship between the average wholesale electricity prices and the share of electricity generation from wind and solar in EU Member States, 2024
Source: OECD calculations based on Ember Yearly and Hourly Electricity Data
Yet the next wave of electrification will put (even greater) pressure on the EU’s electricity system. For example, in the EU, demand from data centres could rise from around 96 TWh in 2024 to about 236 TWh by 2035, increasing their share of total electricity use from 1.5% to nearly 6%.
Energy system upgrades require regulatory upgrades – and a tool to help deliver them
This increasing electrification, with more decentralised generation, new flexibility technologies and large, concentrated loads such as data centres, requires regulatory frameworks that are aligned with these new system characteristics.
In this context, regulation increasingly functions like infrastructure itself: it must be planned ahead of need, operate reliably, and remain aligned with system needs. Outdated or fragmented rules quickly become binding constraints on investment, adding years to project timelines and raising costs. As such, modernising and simplifying regulatory frameworks have become a strategic lever of energy security and competitiveness.
Recent EU legislation, including the Renewable Energy Directive III, provides an important foundation. Implementation at national level, however, will determine whether projects proceed from pipeline to operation.
Across EU Member States, five recurring regulatory barriers consistently slow deployment and undermine system efficiency:
First, unclear or restrictive legal frameworks create uncertainty and deter market entry, particularly for newer solutions. Where rights and permitted uses have been clarified – such as enabling dual land use for both agriculture and PV solar in France and Italy – deployment has accelerated; where ambiguity persists, projects stall.
Second, insufficient remuneration for new system services limits investment, for instance in flexibility. Many frameworks still do not reward services such as inertia or fast frequency response on a standalone basis, despite their growing importance for system stability. Ireland’s recent market reforms to remunerate these ancillary services illustrate how rule changes can unlock these services.
Third, infrequent and inefficient spatial planning and permitting remain a major drag on investment. Complex, sequential procedures involving multiple authorities often result in long timelines distorting siting decisions and raising financing costs. Where procedures have been simplified, impacts have been immediate and significant: reform to grid-permitting rules in Germany have enabled the Federal Network Agency (BNetzA) to approve roughly four times more transmission-line kilometres in 2024–25 than in previous years (see figure 3).
Fourth, outdated grid-connection rules create artificial bottlenecks. First-come, first-served queues allow speculative projects to hold capacity delaying viable investments. Sweden’s readiness-based connection rules show how prioritisation can improve outcomes without new infrastructure.
Finally, grid-investment frameworks still contain structural disincentives that limit system optimisation. Regulation often favours capital-intensive network expansion while constraining anticipatory investment, flexibility procurement, and digital solutions. In some Member States, system operators cannot recover the costs for non-wire alternatives, even when these are faster and cheaper than traditional reinforcement.
These barriers can add years to project timelines and increase financing costs. They affect not only renewable developers but also energy-intensive industries, such as AI infrastructure and advanced manufacturing, that require stable, low-cost electricity to remain competitive.
To address these barriers systematically, the OECD has developed the Diagnostic Tool for Reducing Regulatory Barriers to Solar, Wind and Pumped Hydro Storagein the EU for the European Commission. The Tool helps policymakers at national and sub-national levels identify where rules are misaligned with system needs, prioritise reforms, and coordinate implementation – providing a practical roadmap for accelerating electrification while strengthening both energy security and competitiveness.
With clear rules, coordinated planning and tools such as the OECD Diagnostic Tool, the EU can move from energy dependence toward electric resilience – strengthening both economic competitiveness and energy security.
*We will be launching the Diagnostic Tool on 29th January. You may register here.
Time for a regulatory reset? Clearing the path for productivity and dynamism
Category: Uncategorized
written by oecdecoscope | January 28, 2026
By Dan Andrews, Joana Duran-Franch and Sébastien Turban, OECD Economics Department.
Over recent years, governments across the OECD have expressed concerns that “red tape” is hampering economic activity. Concerns that have been supported by the recent OECD Simplifying for Success survey, in which business organisations report that regulatory requirements and compliance now stand as the most significant challenge for firms, ahead of difficulties in finding workers with the right skills, tax pressures, or geopolitical instability. And crucially, firms perceive that the regulatory burden is mounting over time.
The latest OECD Economic Outlook, in its thematic chapter Time for a Regulatory Reset? (OECD, 2025a), confirms that this is more than a feeling – and that it matters for growth. Labour productivity growth has slowed across most OECD countries since the late 1990s, due to weak business investment (OECD, 2025b) and diminished economic dynamism, which reflects the declining likelihood of new firms to enter and scale-up, workers to change jobs and scarce resources to be reallocated towards more productive firms (Figure 1). Some of this is due to benign forces such as ageing populations or the rise of firm-specific human capital in an intangible-driven economy. But growing regulatory frictions are also part of the story.
Figure 1. Productivity and economic dynamism have slowed down in the last 20 years
Note: In Panel B, the figure reports the average of within-country–industry cumulative changes in percentage points relative to 2004. Estimates are based on data for 12 countries (Austria, Belgium, Finland, France, Germany, Italy, Hungary, Portugal, Slovenia, Spain, Türkiye and the United Kingdom) over the period 2004–2022. Source: OECD Economic Outlook 118 database; Calvino, F., C. Criscuolo and R. Verlhac (2020); Cho, W. et al. (2024); and OECD calculations.
While regulation is essential, the way we regulate matters for growth and dynamism
Regulations are indispensable for correcting market failures, protecting health and safety, safeguarding the environment and addressing distributional concerns. The question is whether these objectives can be met with fewer distortions and lower compliance costs – freeing up talent and capital for innovation and growth. And there is good reason to believe they can.
The growing regulatory environment has absorbed scarce labour resources
A central contribution of the chapter is to develop a new task-based measure of the real resources used to comply with regulation, as in Trebbi and Zhang (2022) and Trebbi, Zhang and Simkovic (2023). The idea is simple: most jobs include some tasks that are linked to regulation compliance – completing forms, reporting, audits, inspections, ensuring legal or standards compliance, and so on. By identifying these tasks across occupations, we estimate the share of wages and employment devoted to regulatory compliance in OECD countries for which data are available.
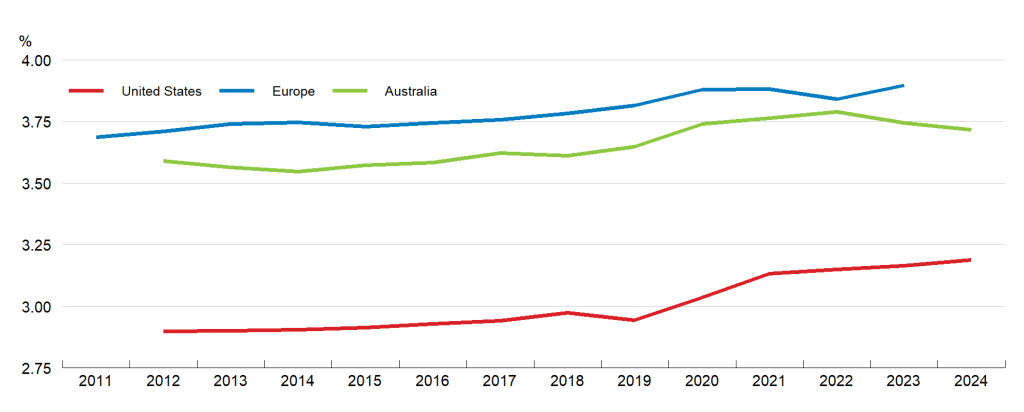
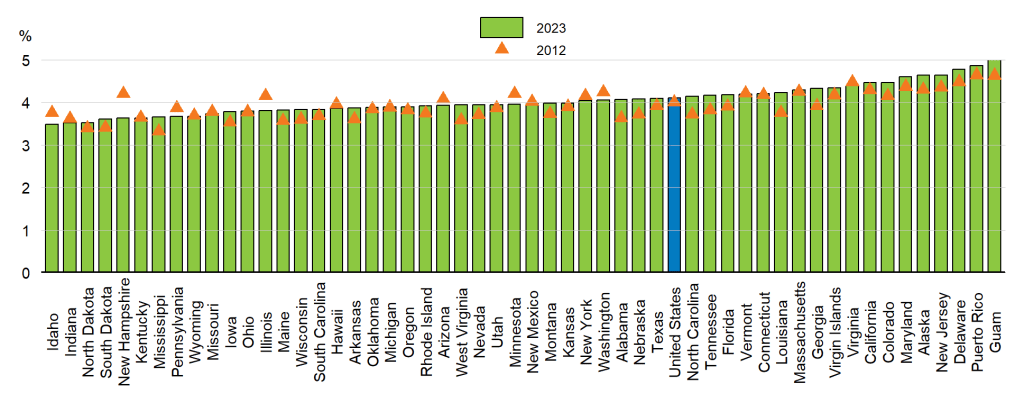
These new measures show that resources devoted to regulatory compliance are significant and growing (Figure 2): In Europe, regulatory tasks accounted for an average of 3.9% of total employment in 2023, up from 3.7% in 2011. This share is higher than in Australia – where the increase has also been smaller over the same period – and notably higher than in the United States, where regulatory tasks account for 3.2% of total employment. In 2024, an estimated 4.2% of the US wage bill was spent on regulation-related tasks (up from 4.0% in 2012), equivalent to around USD 521 billion or 1.8% of GDP. But there is considerable variation across US states, ranging from 3.5% in Idaho to closer to 5% in some states such as New Jersey.
Figure 2. The share of employment devoted to regulatory tasks has risen in selected OECD countries
A. Share of employment
B. Share of US state and territories’ wages spent on regulatory tasks in 2012 and 2023
Note: In Panel A, the index represents the employment-weighted sum of occupations’ regulation task intensity scores in the three regions. “Europe” refers to the average score of EU countries except Bulgaria, Malta, and Slovenia, and includes the United Kingdom (data available up to 2019), Iceland, Norway, and Switzerland. In Panel B, the index represents a similar, wage-weighted sum. The US unweighted average is in blue. The values for the District of Columbia are not displayed, for readability: the numbers were 7.8% in 2012 and 7.5% in 2023. Source: Andrews, Turban and Tyros (forthcoming).
When more rules mean less dynamism
Using variation within US states over time, we find that higher regulatory compliance costs are linked to workers producing less per hour and to new businesses making up a smaller share of employment. In detail, long-difference regressions for US states over 2012–2023 show that the average increase in compliance costs is associated with roughly 0.5% lower labour productivity and a 0.4 percentage point drop in the employment share of young firms. The estimates also suggest the effects build up gradually over time. These results are consistent with a growing body of evidence linking regulatory accumulation to slower GDP and productivity growth in the United States, Europe and Australia (Coffey, McLaughlin and Peretto, 2020; Dawson and Seater, 2013; McLaughlin and Wong, 2024; Pellegrino and Zheng, 2023).
Calling for a regulatory reset: Smarter rules for stronger growth
Against this backdrop, the chapter outlines a plan for a “regulatory reset”. While the specific recommendations vary by country – as highlighted by Chapter 3 of the Economic Outlook and explained in a recent blogpost – a clear common message emerges: this is not about deregulating across the board, but about regulating in a smarter, more dynamic way. The chapter identifies five priorities that governments can act on today:
Simplify and manage regulations systematically. Use non-regulatory tools where appropriate and make regulatory governance more agile and evidence-based. A key step includes managing the stock of regulations through systematic reviews, which currently occur in fewer than one-third of OECD countries (OECD, 2020; OECD, 2025d). Increasing legal certainty and predictability is necessary too: frequent changes, complex drafting, and inconsistent enforcement remain among the top complaints from businesses in the OECD Simplifying for Success surveys.
Make product and labour market regulations more dynamism-friendly. Pro-competitive product market regulation remains a powerful lever for growth, especially in services. Recent OECD evidence suggests that the slowdown in deregulation in network sectors – like energy, transport, and communications – explains up to one-sixth of the post-2005 productivity slowdown. At the same time, easing product market regulations in retail trade and professional services could boost labour productivity significantly. That said, not all regulation harms dynamism and targeted rules can actually enhance it, for example, by addressing the excessive use of non-compete clauses or tightening safeguards against excessive lobbying.
Redesign housing regulation to promote affordability and mobility. Restrictive planning and rental regulations can depress residential construction, push up rents and house prices over time, and reduce labour mobility by locking in tenants. The chapter argues for simpler, more flexible land-use and spatial planning, with fewer barriers to densification and better co-ordination across levels of government, and a gradual phasing-out of strict rent controls.
Regulatory frameworks should harness the productivity benefits of digitalisation and AI. Large-scale AI adoption relies on tangible infrastructure and intangible assets, both shaped by regulation – from data protection and consumer rules to competition and trade policy. The key regulatory challenge is striking the right balance: protecting data without stifling innovation, avoiding fragmented or overlapping rules that raise uncertainty and compliance costs, and ensuring competition and openness in AI markets.
Confront regulatory barriers to energy abundance. As electrification accelerates and AI and data centres push up power demand, renewables have become some of the cheapest sources of new generation. Yet regulatory barriers are slowing investment and deployment (OECD, 2025c). Where these bottlenecks have been tackled – for example through emergency permitting reforms in parts of Europe – renewable deployment has accelerated markedly. The chapter argues for modernising energy regulation to align with decentralised, flexible systems and to make permitting, grid access and remuneration more transparent and predictable.
The bottom line: done well, a regulatory reset can revive economic dynamism and unlock productivity growth, while still delivering on societies’ environmental, social and safety objectives. We should not always regulate less, but we must regulate better.
References
Andrews, D., S. Turban and S. Tyros (forthcoming), “Regulatory compliance costs and productivity: new task-based evidence”, OECD Working Papers.
Calvino, F., C. Criscuolo and R. Verlhac (2020), “Declining business dynamism: Structural and policy determinants”, OECD Science, Technology and Industry Policy Papers, No. 94, OECD Publishing, Paris, https://doi.org/10.1787/77b92072-en
Cho, W. et al. (2024), “Diagnosis and policy action for sustainable and inclusive productivity growth”, OECD Science, Technology and Industry Working Papers, No. 2024/7, OECD Publishing, Paris, https://doi.org/10.1787/1668f250-en.
Coffey, B., P. McLaughlin and P. Peretto (2020), “The cumulative cost of regulations”, Review of Economic Dynamics, Vol. 38, pp. 1-21, https://doi.org/10.1016/j.red.2020.03.004.
Dawson, J. and J. Seater (2013), “Federal regulation and aggregate economic growth”, Journal of Economic Growth, Vol. 18/2, pp. 137-177, https://doi.org/10.1007/s10887-013-9088-y.
OECD (2025c), Diagnostic Toolkit for Reducing Regulatory Barriers to Solar, Wind and Pumped Hydro Storage in European Union: Empowering Policymakers at National, Regional and Local Levels, OECD Publishing, Paris, https://doi.org/10.1787/15f4aed4-en.
OECD (2020), Reviewing the Stock of Regulation, OECD Best Practice Principles for Regulatory Policy, OECD Publishing, Paris, https://doi.org/10.1787/1a8f33bc-en.
Pellegrino, B. and G. Zheng (2023), “Quantifying the Impact of Red Tape on Investment: A Survey Date Approach”, SSRN Electronic Journal, https://doi.org/10.2139/ssrn.4593370.
Trebbi, F. and M. Zhang (2022), The Cost of Regulatory Compliance in the United States, National Bureau of Economic Research, Cambridge, MA, https://doi.org/10.3386/w30691.
Trebbi, F., M. Zhang and M. Simkovic (2023), “The Cost of Regulatory Compliance in the United States”, SSRN Electronic Journal, https://doi.org/10.2139/ssrn.4331146
Uncertainty: A persistent drag on trade
Category: Uncategorized
written by oecdecoscope | January 28, 2026
By Catherine MacLeod and Elena Rusticelli, OECD Economics Department.
Global trade growth has been surprisingly robust in 2025, boosted by strong demand in new AI-related investment and intense front-loading of activity ahead of new tariff increases, as shown in the latest OECD Economic Outlook. However, at the same time, trade policy uncertainty has risen and without concerted efforts to mitigate it, trade growth may be much lower than otherwise over the next three years.
Uncertainty about trade policy has risen markedly recently, with a peak in April following the announced increase in US bilateral tariffs on all its trading partners that month. Although uncertainty has subsequently drifted lower, it still remains elevated by past standards in many countries (Figure 1).
It is likely that trade policy uncertainty will decrease international trade. Prolonged economic uncertainty is already known to discourage long-term investment (OECD, 2025b) and cause households to delay consumption. Several studies have shown a sizeable decrease in international trade in the nine to 12 months period following a trade policy uncertainty episode (Caldara et al., 2019; Sampognaro, 2025). Nonetheless, in the very short term, uncertainty could provide an incentive for firms to increase imports immediately before anticipated, though unpredictable, costly policy changes. This was a factor behind the 38% annualised rise in US imports in the first quarter of 2025 (OECD, 2025a).
Figure 1. Uncertainty around trade policy remains globally high
Trade policy uncertainty indices
Note: All series shown until October 2025. Source: Caldara, et al. (2019); Arbatli, et al. (2022); Davis, et al. (2019).
Persistent uncertainty will lower trade
To explore these effects, the impact of trade policy uncertainty on global trade volumes was estimated using a panel vector autoregression (VAR) model with quarterly data for 56 countries – 33 developed economies and 23 emerging market economies – over the period 2017-2025. The model includes the newspaper-based global trade policy uncertainty index of Caldara et al. (2019).
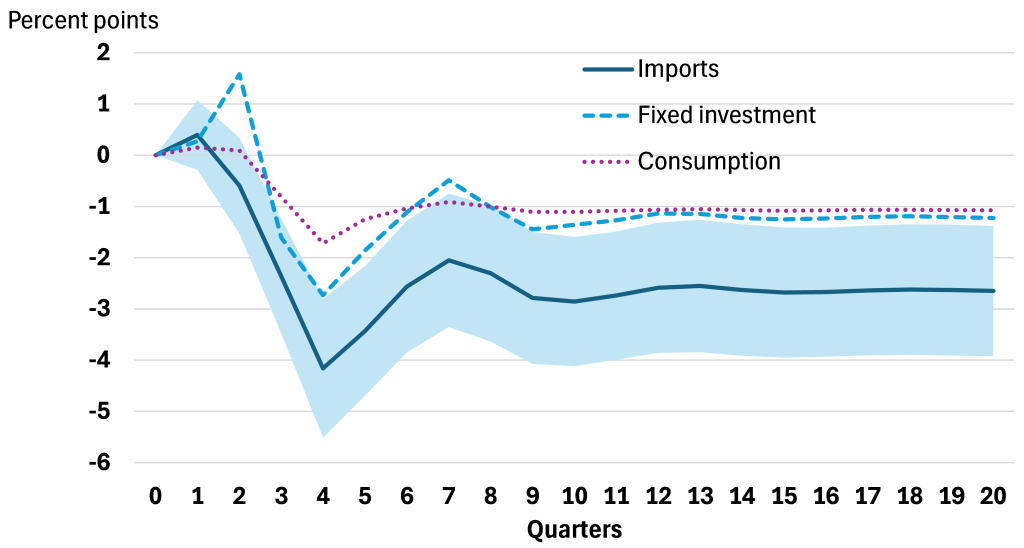
The results from a trade uncertainty shock are shown in Figure 2. Initially, there is a small rise in imports, which is consistent with possible front-loading. A similar pattern is apparent in investment, which again may stem from a wish to bring forward large, planned expenditures ahead of future trade policy changes. However, over time trade policy uncertainty shocks are associated with lower trade, as well as lower consumption and investment. The downside impact of a trade policy uncertainty shock is estimated to peak after one year, with merchandise import growth being reduced by 4.2 percentage points.
Figure 2. Trade uncertainty is accompanied by short-term front-loading effects
Impact of uncertainty on real imports, investment and consumption growth
Note: The figure compares the estimated cumulative impact of a one standard deviation increase in the trade policy uncertainty index on the quarterly growth rate of merchandise import volumes, investment, and household plus government consumption volumes computed across 33 advanced countries and 23 emerging market economies. The shaded area depicts the 90% confidence band around the estimates. The dynamic panel VAR model is estimated using a generalised method of moments approach over 2017Q1-2025Q2 and it includes four lags of all variables. Source: OECD Economic Outlook 118 database; OECD calculations.
Given the wide range of estimates from existing studies of the impacts of trade policy uncertainty, a number of checks were conducted to assess the robustness of these findings. First, the findings are robust even if data from 2024 and 2025 are excluded. Second, a related model using nominal bilateral trade amongst the G20 countries also yielded broadly similar results, albeit with larger negative effects on trade, consistent with the literature (Nana et al., 2025). Finally, the results were found to be robust to using an alternative text-based measure of uncertainty, based on analyst reports, with similar, although not identical, patterns, and without front-loading effects.
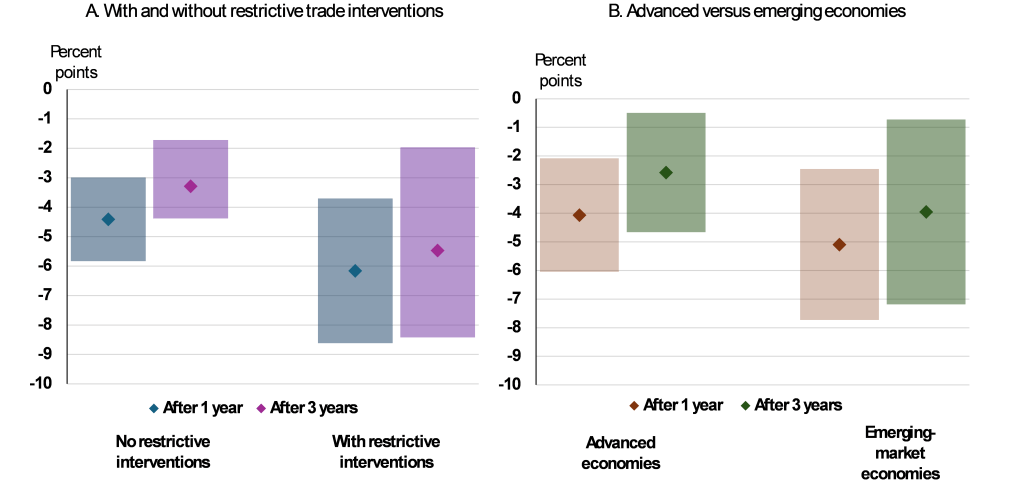
Announcements of policy changes – even if they are restrictive – could mitigate uncertainty by making policy clear and reducing speculation, or they could add to the trade inhibiting effects of uncertainty by increasing the expected probability of negative trade policy outcomes and expected losses (Handley and Limão, 2022). To test this, we added the number of products affected by an import tariff at the date of announcement as a separate variable in the model. Global merchandise import growth is found to be reduced by an additional one and a half percentage points after 1 year following an uncertainty shock and by two percentage points after 3 years (Figure 3, Panel A).
Finally, there is some evidence that emerging market economies have a higher sensitivity to trade policy uncertainty than advanced economies (Figure 3, Panel B). One possible factor behind this is that several countries in the emerging markets sample are manufacturing hubs, with a sizeable share of imports (foreign value added) in their manufactured exports. Trade in such economies is likely to be particularly sensitive to uncertainty (Nana et al., 2025).
Rules-based trade policies would help address uncertainty shocks
The harmful effects of trade policy uncertainty are occurring against a backdrop of elevated policy uncertainty more generally. This negative impact is likely to have been exacerbated this year by the large number of products and countries potentially exposed to trade policy changes. As stressed in the latest OECD Economic Outlook enhanced international cooperation to bolster and ensure rules-based, fair, trade policies would minimise trade-related uncertainty and likely support trade and investment.
Figure 3. Trade uncertainty has heterogeneous effects across countries and products
Note: Panel A compares the estimated cumulative impact of a one standard deviation increase in the trade policy uncertainty index on the quarterly growth rate of merchandise import volume with and without accounting for harmful trade policy interventions proxied by the number of imported products affected by a tariff at announcement date. Panel B compares the estimated impact on merchandise import volumes separately for advanced countries and emerging-market economies. Real investment and consumption have been replaced by the industrial production index to enable the inclusion of China in the country sample. The shaded area depicts the 90% confidence band around the estimates. Source: OECD Economic Outlook 118 database; Global Trade Alert Data Center; OECD calculations.
References
Arbatli Saxegaard, E., S. Davis, A. Ito and N. Miake (2022) “Policy uncertainty in Japan”, Journal of the Japanese and International Economies, Volume 64.
Caldara, D., M. Iacoviello, P. Molligo, A. Prestipino and A. Raffo (2019), “Does Trade Policy Uncertainty Affect Global Econmic Activity?” FEDS Notes September 4, Board of Governors, Federal Reserve System.
Davis, S., L. Dingqian and S. Xuguang (2019), “Economic Policy Uncertainty in China Since 1949: The View from Mainland Newspapers”, Fourth Annual IMF-Atlanta Fed Research Workshop on China’s Economy.
Handley, K. and N. Limão (2022), “Trade Policy Uncertainty,” NBER Working Paper 29672.
Nana, I., R. Ouedraogo, and J.T. Sampawende (2025), “The heterogenous effects of uncertainty on trade”, IMF Working paper, No.139.
OECD (2025a), OECD Economic Outlook, Volume 2025 Issue 2: Resilient Growth but with Increasing Fragilities, OECD Publishing, Paris, https://doi.org/10.1787/9f653ca1-en.
Sampognaro, R. (2025), “Regardless of the outcome, uncertainty in trade policy will have significant effects on global trade”, OFCE blog, April 2025.
Harnessing the Wisdom of Crowds to Assess Recession Risks in OECD Countries
Category: Uncategorized
written by oecdecoscope | January 28, 2026
by Thomas Chalaux, Dave Turner and Steven Cassimon, OECD Economics Department.
Macroeconomic forecasters have struggled to reliably pinpoint the precise timing of business cycle turning points and future recessions. Recognising this inherent difficulty, a growing body of work has shifted focus to probabilistic models, aiming to assess the risk of a future downturn rather than attempting exact prediction.
Researchers from major institutions, including the IMF, ECB, and the Bank of England, have lauded Random Forests (RF), or closely related methods, as the most consistently effective machine-learning method for identifying crisis episodes, often deemed superior to traditional probit/logit modelling [Bluwstein et al. (2020), Hellwig (2021), IMF (2021), Jarmulska (2020)]. However, the OECD Working Paper, “Harnessing the wisdom of crowds to assess recession risks in OECD countries” (Chalaux et al, 2025), challenges this prevailing view, demonstrating that a customised algorithm based on enhanced probit modelling can match, and in some key areas surpass, the performance of Random Forests when predicting recession episodes across 20 OECD countries.
The key to this revitalisation of probit modelling lies in embracing the concept of ensemble forecasting, the “wisdom of crowds.”
The Doombot Algorithm and the Power of Averaging
The working paper introduces the latest version of a highly customised algorithm known as Doombot. While Random Forests achieve superior performance by averaging predictions across many decision trees, the newest Doombot algorithm mimics this strategy by averaging predictions from many well-fitting probit equations. This feature, termed the “wisdom of crowds,” boosts the algorithm’s out-of-sample predictive capability. The benefit of averaging is widely acknowledged in the broader forecasting literature, where simple averages often outperform more complex aggregation schemes.
Doombot’s design features substantial customisation. It employs a “brute force” method to test a large number of combinations of explanatory variables. To ensure the resulting predictions are credible and comprehensible to external audiences, the algorithm retains only well-fitting equations with statistically significant variables and imposes sign restrictions to maintain a coherent and consistent economic narrative across countries and forecast horizons.
An advantage highlighted in the paper is that Doombot is built on country-specific models. This contrasts with Random Forests, which performs best when pooling countries to estimate a single common model. The authors argue that country-specific models inherently produce more intuitively appealing properties, enhancing credibility when communicating with stakeholders.
The Predictive “Horse Race”
The OECD research compared the out-of-sample performance of five methods: Probit employing the “Wisdom of Crowds” [hereafter “Probit (WoC)”], the single-equation Probit, Random Forests estimated for individual countries (IRF), Pooled Random Forests (PRF), and LASSO.
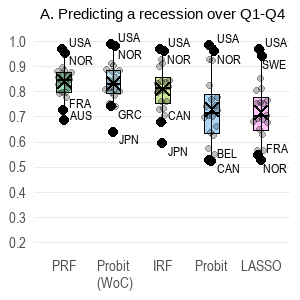
The results show that Probit (WoC) successfully matches the performance of Random Forest methods in rolling out-of-sample quarterly predictions over a two-year horizon, including the turbulent period of the Global Financial Crisis (GFC) (Figure 1). All methods show a much better performance in predicting a recession in the next 4 quarters compared to the subsequent 4 quarters (comparing panels A and B of Figure 1). However, the application of the “Wisdom of Crowds” feature clearly improved the performance of the probit model compared to its single-equation predecessor at all horizons.
Disadvantages of Pooling
While pooling Random Forests (PRF) shows a superior performance to estimation of Random Forests using individual country models (IRF) on some conventional metrics like the median Area-Under-the-Curve score (AUC), the study highlights some disadvantages associated with pooling country data:
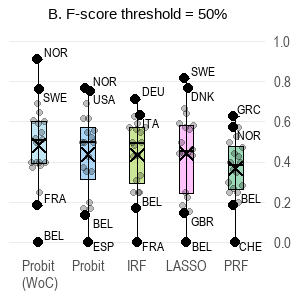
Low Probability Ceiling: PRF rarely generates high recession probabilities that exceed 50%. This makes it difficult to ascertain when a recession is “more likely than not“. When tested using a higher F-score threshold of 50% rather than a low threshold of 15%, PRF dropped from a top performer to the last ranked method (Figure 2), demonstrating its poor ability to distinguish highly elevated risk cases.
High Correlation: PRF predictions are typically highly correlated across countries. This approach may struggle to identify isolated recession risks for single countries or specific groups, such as the concentrated recession risk among European countries observed in 2022 and 2023. The more country-specific Probit (WoC) model successfully picked up a significantly higher differential risk for European countries during this period.
Figure 1. Distribution of out-of-sample AUC scores across 20 countries for 5 methods
Note: The box and whiskers chart summarise the distribution of Area-Under-the-Curve (AUC) scores in the out-of-sample tests for 20 OECD countries: the box shows the interquartile range, the horizontal line is the median; the cross is the average; and the whiskers are the extreme scores. The AUC score is a common measure of evaluating machine-learning models because it shows the accuracy of a model in predicting a binary outcome over different probability thresholds as to whether the occurrence of an event (here a recession) has been predicted or not. The AUC score ranges from 0 to 1, with a higher value indicating better performance. An AUC of 0.5 means the model is no better than chance at distinguishing recession from non-recession quarters, indicating it is essentially uninformative. The ordering of the methods on the x-axis reflects the ranking of their median country scores.
Figure 2. Distribution of F-scores across 20 countries with various thresholds over Q1-Q8
Note: The box and whiskers chart summarise the distribution of F-scores in the out-of-sample tests for 20 OECD countries: the box shows the interquartile range, the horizontal line is the median; the cross is the average; and the whiskers are the extreme scores. The threshold for the F-score test (15% in panel A, 50% in panel B) reflects the threshold at which a probability prediction is classified as a recession or non-recession. The ordering of the methods on the x-axis reflects the ranking of their median country scores.
What Drives a Recession? Variables and Horizons
The robustness of this research comes from applying the same framework across 20 countries and eight consecutive quarterly horizons. This broad application confirms that the importance of explanatory variables shifts dramatically depending on the forecast horizon (Figure 3).
Shorter Horizons (Q1-Q2): Predictors for the immediate quarters are dominated by activity variables such as capacity utilisation, unemployment, and industrial production.
Longer Horizons: For horizons further out, financial cycle variables dominate, particularly credit and house prices.
Other Factors: Interest rates and inflation variables also make significant contributions. Consistent with previous OECD work, international or global indicators are found to be strong predictors of recession risks.
The Real-Time Data Innovation
Another important feature of this paper is the rigorous use of real-real time data for GDP in out-of-sample exercises. This means the estimation uses the precise vintage of data that would have been available at the point in time the predictions were made, rather than the most recent, often-revised data vintage (quasi-real time data).
The distinction is important because revisions to GDP data can be substantial. The study found that while using the latest vintage of data generally results in a slight aggregate performance gain, it can influence (and likely improve) forecast performance just when it matters most, such as on the eve of the GFC. For example, using the latest data vintage for June 2008 forecasts suggested an additional seven countries had already experienced negative GDP growth in Q1 2008 compared to the data available at the time. This change alone increased the predicted overall recession probability for those seven countries by 15 to 30 percentage points (Figure 4).
Concluding Insights
The findings of this working paper challenge the recent consensus regarding machine-learning superiority in crisis prediction. By harnessing the “wisdom of crowds”, averaging predictions from many well-fitting probit equations, the customized Probit (WoC) algorithm achieves out-of-sample performance comparable to Random Forests.
The country-specific nature of Doombot, combined with its ability to generate high probability predictions (exceeding 50%), offers practical advantages over pooled methods. Furthermore, the detailed, multi-horizon analysis confirms the critical role of financial cycle variables (credit and house prices) in predicting medium- to long-term recession risks, offering granular detail that can inform policy and forecasting. The use of real-real time data adds another layer of rigour, ensuring that forecast evaluations reflect the information environment actually available to policymakers at the time.
References
Bluwstein, K. et al. (2020), “Credit Growth, the Yield Curve and Financial Crisis Prediction: Evidence from a Machine Learning Approach” , Bank of England Working Paper No. 848, January, https://doi.org/10.1016/j.jinteco.2023.103773.
Chalaux, T., D. Turner and S. Cassimon (2025), “Harnessing the wisdom of crowds to assess recession risks in OECD countries”, OECD Economics Department Working Papers, No. 1837, OECD Publishing, Paris, https://doi.org/10.1787/46880adc-en.
Jarmulska, B., (2020), “Random forest versus logit models: which offers better early warning of fiscal stress?”, ECB Working paper No 2408, May, doi:10.2866/214327.
Regulating smarter: OECD Economic Outlook recommendations on regulatory policy reforms
Category: Uncategorized
written by oecdecoscope | January 28, 2026
By Young-Hyun Shin, Nivetha Sivakumar and Ben Westmore, OECD Economics Department.
Regulatory policy is critical in shaping the incentives and ability for businesses to innovate and expand and supporting workers to move to the parts of the economy where their skills are needed the most. Assessing regulatory policy settings is thus important in identifying the reasons for the slowdown in labour productivity growth (Figure 1) and business dynamism in OECD economies over the past two decades, as discussed in a special chapter in the December OECD Economic Outlook. This is reinforced by new OECD estimates that highlight that the resources devoted to servicing regulatory compliance have been rising in the United States, the euro area and Australia (Andrews, Turban and Tyros, forthcoming).
But what aspects of regulatory policy need to be addressed? Regulatory environments are multi-faceted and reform priorities will vary across economies. Chapter 3 of the recent OECD Economic Outlook contains country-specific regulatory policy reform priorities. These can be aggregated to give a snapshot by reform category (Figure 2) and highlight two broad types of policy priorities: firstly, the need to reassess the existing stock of regulations and make changes to the methods used to design and implement regulations and, secondly, reducing regulatory impediments in particular markets, especially product markets.
There are also some notable differences between the reform recommendations for advanced and emerging-market economies. For instance, lowering regulatory barriers to firm entry in services sectors, as well as measures that reduce the stringency of housing regulations, are most relevant in advanced economies, while lowering regulatory barriers to foreign direct investment are judged to be particularly necessary in emerging markets (Figure 3).
Delving into the identified country-specific reform recommendations in more detail:
The need for reforms to simplify regulatory processes is widely recommended, including for most OECD countries. Efforts to streamline regulatory processes for business registration are judged to be necessary in many countries, including in Argentina, Brazil, Bulgaria, China, Colombia, Estonia, Hungary, Iceland, Ireland, Israel, Japan, Mexico, Norway, Poland, Peru, Romania, the Slovak Republic and Slovenia. In addition, harmonising regulations across levels of government would simplify the regulatory framework in Australia, Germany, India and Switzerland.
Institutional arrangements for regulatory design and oversight need to be improved in several countries, including through more rigorous use of evaluations of regulations in the euro area, China, Czechia and Denmark. In China, greater consumer protection is also needed along with better institutional oversight of regulations. Initiatives to improve regulatory enforcement are also recommended in some other emerging-market economies, including Argentina and Thailand.
Lowering regulatory barriers to product market entry is commonly needed. This is particularly the case in services sectors, such as in France where there are high barriers to entry for architects and accountants and stringent practice controls for lawyers and real estate agents. Reforms that reduce restrictions on entry to professional services would also be beneficial for growth in Austria, Belgium, Brazil, Czechia, Estonia, Ireland, Israel, Luxembourg and the Slovak Republic. There is also scope for rationalising such barriers in network sectors in some countries, including in Canada, Korea, Lithuania and the United States. Regulatory barriers to inward foreign direct investments could also be eased, including in Costa Rica, Iceland, Indonesia, Korea, Thailand and Viet Nam.
To help facilitate firm exit and improve business dynamism, improved insolvency regulations are recommended for several European economies, including Belgium, Hungary, Iceland, the Netherlands and Romania, as well as in South Africa and Türkiye.
Reforms to housing regulations are identified as a priority for several advanced economies, such as changes to spatial planning policies in Australia, the United Kingdom and the United States. However, such policies are not identified as a key priority for emerging-market economies.
Reducing regulatory barriers to trade, such as those arising from strict local content requirements in Brazil, unwarranted technical requirements on imports in Argentina and slow customs procedures in India, are essential to improving productivity growth. Implementing trade facilitation measures is also highlighted as a priority in other economies, including Iceland and Switzerland.
The summary highlights that smarter regulatory policy, such as reforms that simplify existing regulatory procedures and adjust regulatory design systems and enforcement, are the priority for future growth prospects. While reducing regulatory stringency is also relevant, deregulation should not be the sole focus of policymakers. Indeed, the importance of having regulations in place that effectively target market failures and social objectives, such as safety, environmental and equity concerns, should not be overlooked. Reforms should aim for regulations that serve their objectives and are administered in the most efficient way possible. In the context of an uncertain macroeconomic environment, such an approach can promote the resilience and adaptability of economies to future shocks and long-term economic growth.
References
OECD (2025), OECD Economic Outlook, Volume 2025 Issue 2: Resilient Growth but with Increasing Fragilities, OECD Publishing, Paris, https://doi.org/10.1787/9f653ca1-en
Andrews, D., S. Turban and S. Tyros (forthcoming), “Death by a thousand cuts? New evidence on regulatory compliance costs and productivity”, OECD Economics Department Working Papers.