The UK’s heart is wobbling but there are good reasons to Remain in the Union

By Rafal Kierzenkowski and Nigel Pain, OECD Economics Department

Membership of the European Union contributes to the economic prosperity of the United Kingdom. Real GDP per capita has doubled since the United Kingdom joined the European Union in 1973, to almost 40.000 pounds now. The United Kingdom has outperformed other English-speaking countries that are not EU members over time, but also most other longstanding EU members (EU15) (Figure 1). EU membership has played an important role in this, reinforcing the gains from sound domestic policy settings. Membership expands the markets available to UK businesses, enhances the wellbeing of its citizens and strengthens the influence of the United Kingdom in the global economy.

Brexit fig Since EU membership

The United Kingdom is a trading nation, with nearly 45% of its exports destined for the EU market and 3 million of its jobs associated with trade with the European Union. Development of the EU single market has benefitted UK exporters, and there is more to come as the European Union undertakes new initiatives to reduce remaining internal barriers to services, benefitting the large UK services sector. Membership has also helped to develop UK trade relationships beyond the EU market. The United Kingdom gains from a large network of EU trade treaties with 53 non-member countries. Another 67 new free trade agreements are being negotiated, including with the United States, India and Japan. Collectively, the EU economies account for 12.5% of global trade, enhancing the bargaining power and influence of the United Kingdom, which accounts for only 2% of world trade. This ensures that new trade deals favourable for the UK economy can be struck.

EU membership has also added to the attractiveness of the United Kingdom as a location for foreign companies and investors. Access to the EU Single Market is a key consideration for many of these investors. The United Kingdom receives far more foreign direct investment than other EU member states, gaining over one-fifth of all new investments in the European Union over the past decade. These investments originate from not only from the United States and Japan, but half of them also from other EU countries. Such investment boosts UK exports and ensures strong integration with value chains in Europe and beyond, for instance in the car sector. Foreign-owned firms support jobs, with around 3.5 million people employed in foreign multinationals in the United Kingdom in 2012. They also support productivity and wages by undertaking a substantial share of research and development and other capital investments, and by introducing cutting edge managerial practices. These in turn diffuse to other UK companies.

The UK economy benefits from one of the lowest regulatory burdens in the major economies, both on businesses and labour markets, suggesting that EU membership is not a significant constraint to growth and job creation. Indeed, the UK employment rate is now at almost 75%, a record high. Further reforms are possible of course, but the remaining obstacles are largely home grown, for instance in the post and road sectors. Greater regulatory convergence in the rest of the EU, championed by the UK, would also generate positive spillovers to the UK economy.

The survey of the British Chamber of Commerce released in May shows that businesses of all sizes continue to support EU membership, even those where the burden of regulations is often the most challenging. The Small Business Act for Europe, launched in 2008, is the EU’s key policy initiative to support SMEs. The UK government has implemented the vast majority of its recommendations to reduce administrative burdens, improve access to finance and strengthen the innovative potential of small businesses. Access to bank finance has been an important constraint for UK SMEs. EU financing programmes for SMEs are channelled indirectly through different government levels and financial intermediaries. The EU also introduced legislation to shorten payment delays, a key challenge for many SMEs.

A major policy challenge facing the UK is to upgrade infrastructure to lift productivity and to make society more inclusive. The European Investment Bank, the EU bank, is helping to support this. Between 2011 and 2015, the Bank provided over 20 billion pounds of support to the UK economy, with 50% on transport, water and telecommunications, 30% on energy, and 10% on education and health. Projects it supports include one of the largest UK infrastructure investments to raise transport capacity in London, Crossrail, the development of the port of Liverpool, the construction of energy-efficient social housing in the UK, the roll-out of more than 7 million smart meters in homes across Great Britain, and the expansion of research and teaching facilities at Oxford University.

EU competition and single market policies benefit UK consumers by raising their protection and their rights. There are EU rules on passenger rights in air travel. Last year, UK residents made over 65 million visits abroad and many benefited from EU initiatives to reduce international mobile roaming charges in Europe. Indeed, these will be eliminated from mid-2017. The EU also plans to end unjustified geo-blocking, enhancing the benefits of online commerce. The creation of the digital single market would yield further gains.

After 43 years of EU membership, the sizeable doubts that have emerged about staying in the EU suggest that the UK may be prone to a mid-life crisis. Yet there is strong evidence that EU membership has magnified the underlying strengths of the UK economy and that it can deliver more benefits in the future. Acting together, as part of the EU, makes the UK stronger than standing alone to confront global challenges, such as climate change and profit shifting.

See also: Blog: The Economic Consequences of Brexit: A Taxing Decision

References:

Kierzenkowski,R., et al.  (2016), “The Economic Consequences of Brexit: A Taxing Decision“, OECD Economic Policy Papers, No. 16, OECD Publishing, Paris.

OECD.  (2016), OECD Economic Surveys: Euro Area 2016, OECD Publishing, Paris.

OECD.  (2016), OECD Economic Surveys: European Union 2016, OECD Publishing, Paris.


Boosting Canada’s productivity through greater small business dynamism

By David Carey, Head of Canada Desk, Country Studies Branch, OECD Economics Department

A dynamic small business sector can heighten competition and underpin productivity growth, as discussed in the 2016 OECD Economic Survey of Canada and Carey et al. (2016, forthcoming). Dynamism tends to be reflected in high start-up rates and strong ‘up-or-out’ dynamics. Entry can be viewed as a form of experimentation that introduces new ideas, business models and technologies into the marketplace while exits can be viewed as the end of unsuccessful experiments. High start-up rates increase both the likelihood of radical innovation and competitive pressures on incumbents to innovate. OECD (2015) finds that an increase in the share of firms younger than six years old relative to firms aged 12 years and over is associated with higher multi-factor productivity growth and that this effect is mainly attributable to start-ups.

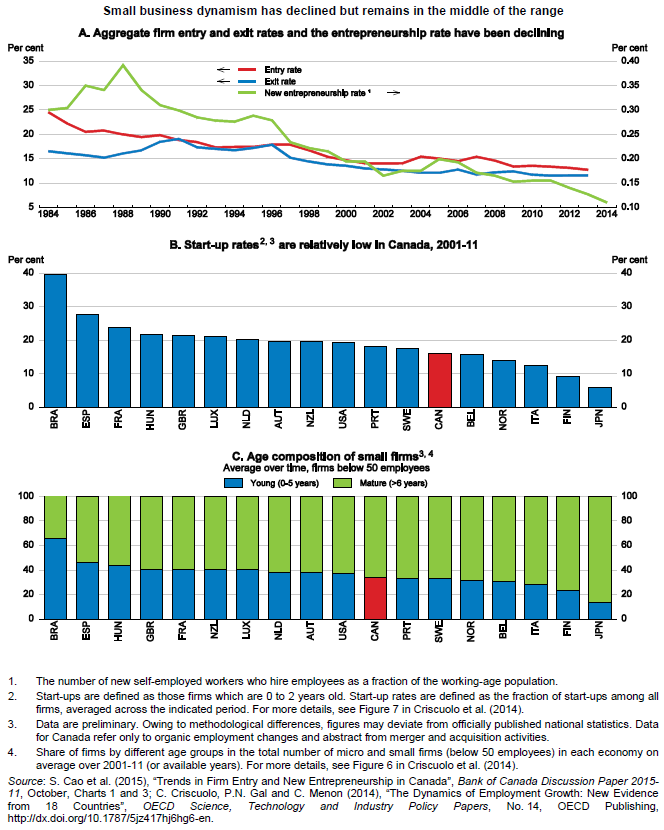
Firm entry and exit rates (which are highly correlated) have been falling since the early 1980s (Figure 1, Panel A) in Canada as in other countries. Canada’s start-up rate appears to be relatively low by international comparison (Panel B), while the share of older small firms is relatively high (Panel C). The relatively low share of younger SMEs (Panel C) may point to weak dynamism, as it is these firms that contribute disproportionately to job creation, destruction and net employment growth (Figure 2), not SMEs in general.

Carey blog CAN

Canada’s framework policies, such as product and labour market regulation, are generally supportive of small business dynamism. Labour market regulation, in particular, poses few barriers to the reallocation of labour, which is critical for a vibrant small business sector. Likewise, product market regulation generally does not obstruct resource reallocation from less to more efficient firms. An exception is Canada’s relatively high barriers to foreign direct investment. Such barriers inhibit allocative efficiency. Another is its high regulatory protection of incumbents, which arises from an above-average use of anti-trust exemptions.

Small business dynamism and productivity would also benefit from focusing small business programmes more clearly on market failures. The most costly programme is the preferential tax rate for small companies (the Small Business Deduction). It is intended to overcome a capital market failure, which starves SMEs of funding, by leaving beneficiaries with more after-tax profits to invest. However, the economic literature on capital market failures does not establish a case for subsidising SMEs based on their size alone. The 2010 UK Mirrlees Review of taxation concluded that there was no evidence of any general capital market failure affecting small firms but rather of a financing gap for new and start-up firms that could be more effectively addressed through targeted measures (Crawford and Freedman, 2010). Canada’s SME financing programmes should be reviewed to identify clear capital market failures and the best instruments for addressing them. For the preferential federal small company tax rate, this should be done in the recently announced federal tax expenditure review.

The other high-cost measure whose review should be a priority is the higher (refundable) R&D tax credit for small companies than for other companies. It is not clear from the economic literature whether market failures warrant a higher or a lower subsidy rate for SMEs than the standard rate: information failures that make it more difficult for SMEs to obtain external finance for innovation justify a higher rate while lower SME R&D spill-overs point in the opposite direction. To resolve this and other R&D subsidy issues, such as the appropriate balance between direct and indirect support and level for the standard tax credit rate, Canadian governments should evaluate R&D subsidy policies to ensure that they are providing good value for money.

Carey blog CAN2

References:

Carey, D., J. Lester and I. Luong (2016, forthcoming), ‘Boosting Productivity in Canada Through Greater Small Business Dynamism’, OECD Economics Department Working Paper.

Crawford, C. and J. Freedman (2010), “Small Business Taxation”, in J. Mirrlees, S.Adam, T. Besley, R. Blundell, S. Bond, R. Chote, M. Gammie, P. Johnson, G. Myles and J. Poterba (eds), Dimensions of Tax Design: The Mirrlees Review, Oxford: Oxford University Press for Institute for Fiscal Studies. Criscuolo, C., P. Gal and C. Menon (2014), “The Dynamics of Employment Growth: New Evidence from 18 Countries”, OECD Science, Technology and Industry Policy Papers, No. 14, OECD Publishing, Paris.


The risks in Canada’s unusual housing market(s)

By Peter Jarrett, Head of Division, Country Studies, OECD Economics Department

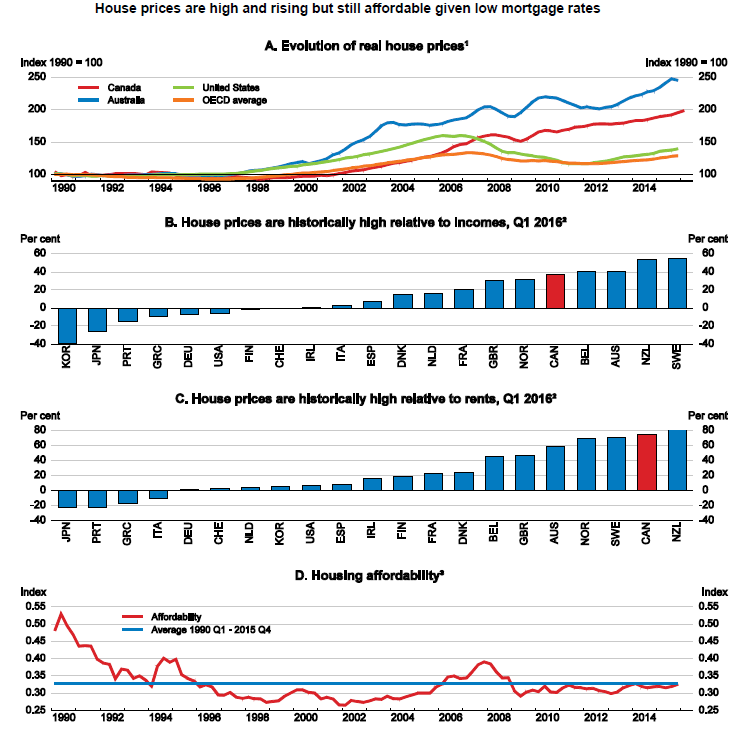
Local housing markets are presently highly disparate in Canada. While in most smaller localities real estate prices are fairly stable and not out of line with the fundamentals (incomes and rents), 10 of the 15 large Census Metropolitan Areas monitored by the Canada Mortgage and Housing Corporation (CMHC) show signs of overvaluation, and seven show moderate or strong evidence of overbuilding. By contrast, prices have fallen quite sharply from previously lofty levels in a few communities whose economies are heavily dependent on resources (Calgary in particular). But house prices in Toronto and especially Vancouver, which together make up one third of the national housing market, are such that, in tandem with high household debt (which nationally reached 167.6% of disposable income at end-2015, near the top of the OECD country range), they represent a significant financial vulnerability. A sharp fall in house prices triggered by a shock that results in a large increase in unemployment could weaken households’ ability to service their debts, resulting in a rise in mortgage defaults that could endanger financial stability.

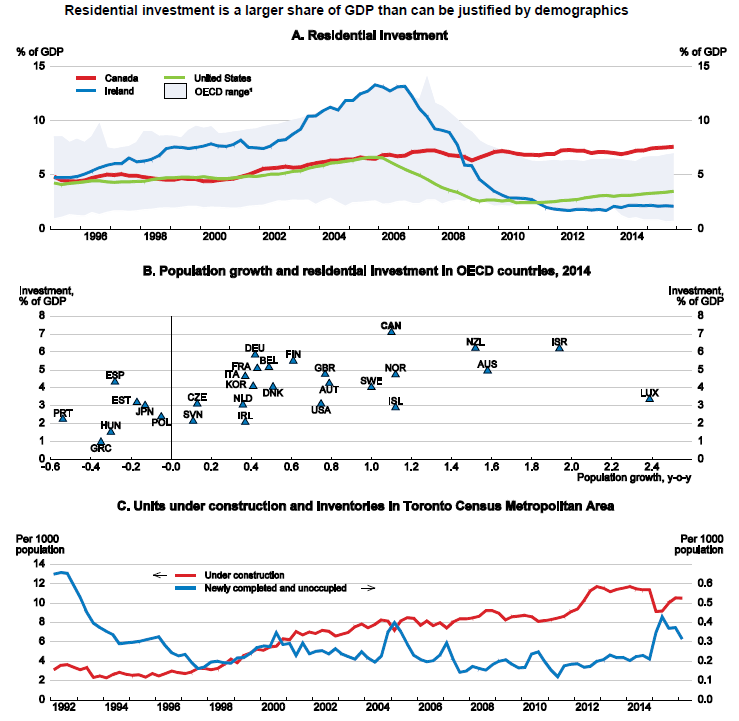
One factor driving market strength in Vancouver and Toronto is foreign buying. Unfortunately, limited data are available on such purchases, but the federal government has allocated some funding for Statistics Canada to begin to gather such data. Another is building site supply constraints: these are both physical – Vancouver is bounded by the Pacific Ocean and coastal mountains, while Toronto is bordered by Lake Ontario – and regulatory – such as Toronto’s green belt of some 800 000 hectares and Vancouver’s provincial zone of protected farmland. These constraints curb the normal supply response to appreciating property prices. Nevertheless, the share of residential investment in Canada’s GDP is currently the OECD’s highest, even if well below earlier peaks in Ireland and Spain. Strong residential investment may in principle reflect robust demographic growth, but Canada’s outcome appears stronger than what can be justified by underlying population increases. And the larger the share the further it could fall if the boom ends with a bang.

While low interest rates have helped to reduce interest-related obligations and safeguard affordability, broader debt-service ratios including required principal payments are above historical averages. In addition, according to the Bank of Canada, debt has become more concentrated in the hands of highly indebted younger households, who may be less able to cope financially with a job loss or interest rate increases. Nevertheless, Canadian mortgages are issued on a recourse basis, and most households have plenty of equity in their homes (73% on average). In addition, banks must test mortgage qualification for insured mortgages with terms less than five years or with variable interest rates against a benchmark five-year interest rate, which is currently about two percentage points above market five-year mortgage rates, affording some degree of protection. In December 2015, OSFI (the Office of the Superintendent of Financial Institutions), the financial supervisor, announced planned changes to the regulatory capital frameworks for residential mortgages for large federally regulated lenders and private mortgage insurers so that capital requirements keep pace with housing market developments and risks, such as when regional house prices are high relative to incomes. Moreover, following a series of macro-prudential measures implemented since 2008, the federal government boosted down-payment requirements for insured mortgages in February 2016 from 5 to 10% for the portion of each insured home priced between CAD 500 000 and CAD 1 million, which is the ceiling on availability of public mortgage insurance. Stress testing on the six large banks has been carried out regularly in the last few years, and, while results are not published, the Bank found that all balance sheet ratios exceed minima required by OSFI. Moreover, nonperforming loans remain low at only 0.5% of gross loans. This said, macro-prudential measures should be tightened further and targeted regionally, as in New Zealand, where the authorities imposed lower ceilings on loan-to-value ratios in 2015 in the booming Auckland market and are considering further steps. Targeted measures could go beyond OSFI’s planned changes to capital guidelines in regions with high house price-to-income ratios or strong house price growth to make capital requirements more responsive to market developments and risks.

house affordability canada2
1. Nominal house prices deflated by the private consumption deflator.
2. Deviation of the ratio of nominal house prices/nominal disposable income per capita (respectively /rent prices) over the long-term average. The long-term average starts in Q1 1980 for most countries, with a few exceptions. The price-to-income ratio starts in Q1 1981 for Denmark, Q1 1986 for Korea and New Zealand, Q1 1987 for the United Kingdom, Q1 1995 for Portugal and Q1 1997 for Greece. The price-to-rent ratio begins in Q1 1986 for Korea, Q1 1988 for Portugal and Q1 1997 for Greece. The latest observation is Q4 2015/Q1 2016.
3. The affordability index provides an estimate of the share of disposable income that a representative household would put toward housing-related expenses. The measure is a ratio, where the numerator, housing-related costs, is the sum of the average quarterly mortgage payment plus utility fees and the denominator is the average household disposable income. The higher the level, the more difficult it is to afford a home.

Source: OECD, Economic Outlook database; Bank of Canada, Financial Indicators, http://credit.bankofcanada.ca/financialindicators.

canada housing pj

1. Excluding Canada.

Source: Statistics Canada, Tables 027-0060, 027-0047 and 051-0056; OECD, Economic Outlook database.

Reference:

OECD (2016), Economic Surveys: Canada, Vol. 2016, No. 16, OECD Publishing, Paris.

Presentation of the 2016 Economic Survey of Canada:


Structural reforms for more inclusive growth in Greece

by Christian Daude, Senior Economist, Office of the Chief Economist, OECD Economics Department (former head of the Greek Desk)

The Greek economy is turning around lately, but it remains in a deep depression. GDP has fallen by more than a quarter between 2007 and 2015, unemployment remains extremely high at 25 percent and anchored poverty – which measures poverty relative to its pre-crisis income level – has nearly tripled between 2007 and 2014, reaching a third of the population. According to our latest OECD Economic Outlook, growth in 2016 will be slightly negative (-0.2%) and pick up to 1.9% in 2017. Unemployment will remain high and wage growth muted.

If the upcoming negotiations with its European creditors reduce Greece’s debt burden, greater confidence and less fiscal headwinds would support investment and a stronger cyclical recovery.  However, policy makers in Greece cannot rely only on a cyclical rebound if they want to overcome the profound costs of the crisis and provide better lives for their citizens.  OECD estimates show that the prolonged depression has reduced the long-term potential growth of the Greek economy by 2 percentage points. This means that without reforms to raise investment and productivity it would be extremely difficult to achieve pre-crisis living standards in a reasonable timeframe. More importantly, unemployment would remain at very high levels, as long unemployment spells have led to significant scarring effects in the labour market (OECD, 2016).

In a recent paper, we show that Greece has implemented significant labour market reforms, but less progress has been achieved on reducing oligopoly power, on simplifying the regulatory burden and on addressing weaknesses in the public administration, due to administrative capacity constraints, weak ownership of past reform programmes and vested interests. Our estimates show that changing the mix of structural reforms towards raising competition in product markets and improving general framework conditions for doing business, could boost GDP by around 13% over the next decade if implemented fully.

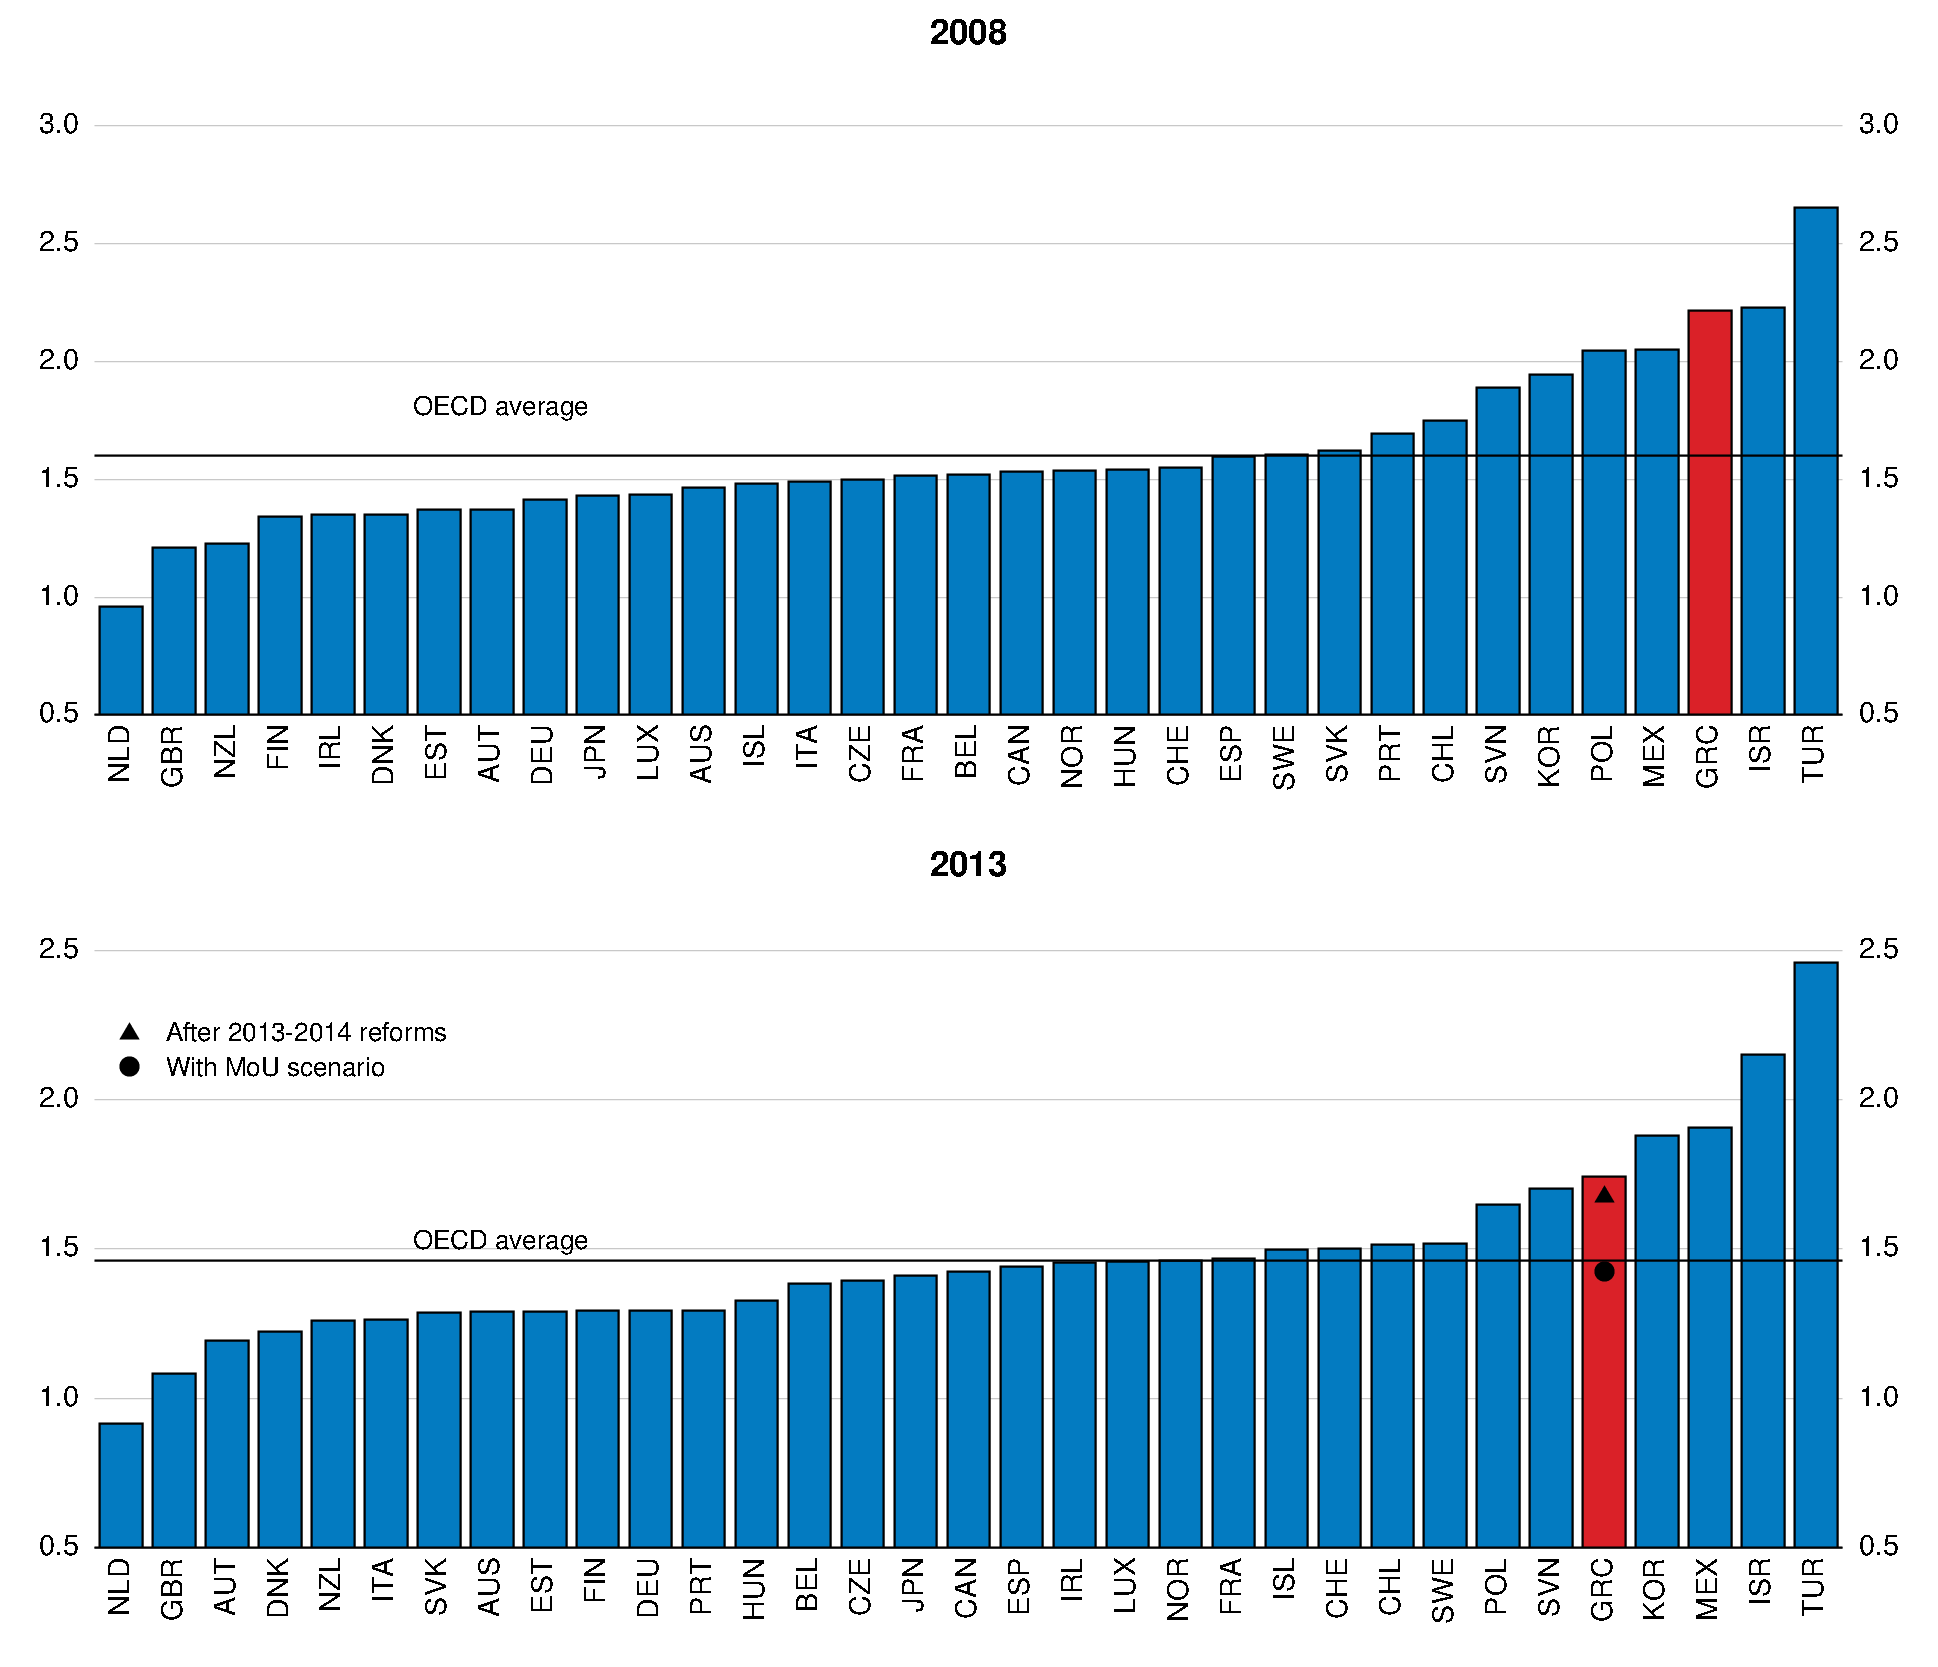
Figure: Product market regulation index

Index scale 0 – 6 (least to most restrictive)

Greece struc refm

Note: The MoU scenario represents the estimated level of the PMR index under full implementation of product market reforms included in the Memorandum of Understanding of the August 2015 ESM agreement. See Daude (2016) for details.
Source: OECD (2015) Product Market Regulation database and OECD calculations.

Further product market reforms are crucial to increasing productivity and getting investment started again. Although reforms so far have moved Greece close the OECD average in restrictiveness of product markets, there is still significant room for improvement, even if the current memorandum of understanding (MoU) is fully implemented. Regulations in network sectors remain restrictive. In particular, in rail and road transport, as well as electricity and gas, a combination of public ownership, barriers to entry and a significant vertical integration create relatively high costs that undermine the competitiveness of the rest of the economy.

At the same time, reforms that improve the business climate, the functioning of the judiciary, tax administration and the overall effectiveness of the public administration are needed. The OECD is currently working together with the Greek government on several of the reforms needed. The challenges are significant, but a more balanced reform package and better implementation could not only contribute to a more inclusive recovery but also create stronger public support for reforms and greater ownership to modernise the Greek economy.

References

Daude, C. (2016), “Structural reforms to boost inclusive growth in Greece,” OECD Economics Department Working Papers, No. 1303, OECD Publishing, Paris.

OECD (2016), Economic Surveys: Greece 2016, OECD Publishing, Paris.

OECD (2016), OECD Economic Outlook, OECD Publishing, Paris


The contribution of weak investment to the productivity slowdown

by Yvan Guillemette, OECD Economics Department

Concerns around weak productivity growth are everywhere these days. As the latest OECD Economic Outlook notes, since the mid-2000s, productivity growth has been markedly lower than at any other time since the 1950s. In response, the OECD has just launched the Global Forum on Productivity, an initiative to foster international co-operation between public bodies who promote productivity-enhancing policies. The goal is clear: to kick productivity growth out of the doldrums. In the long run, it drives all gains in living standards. Without it, many countries may not be able to keep the promises embedded in their social programs.

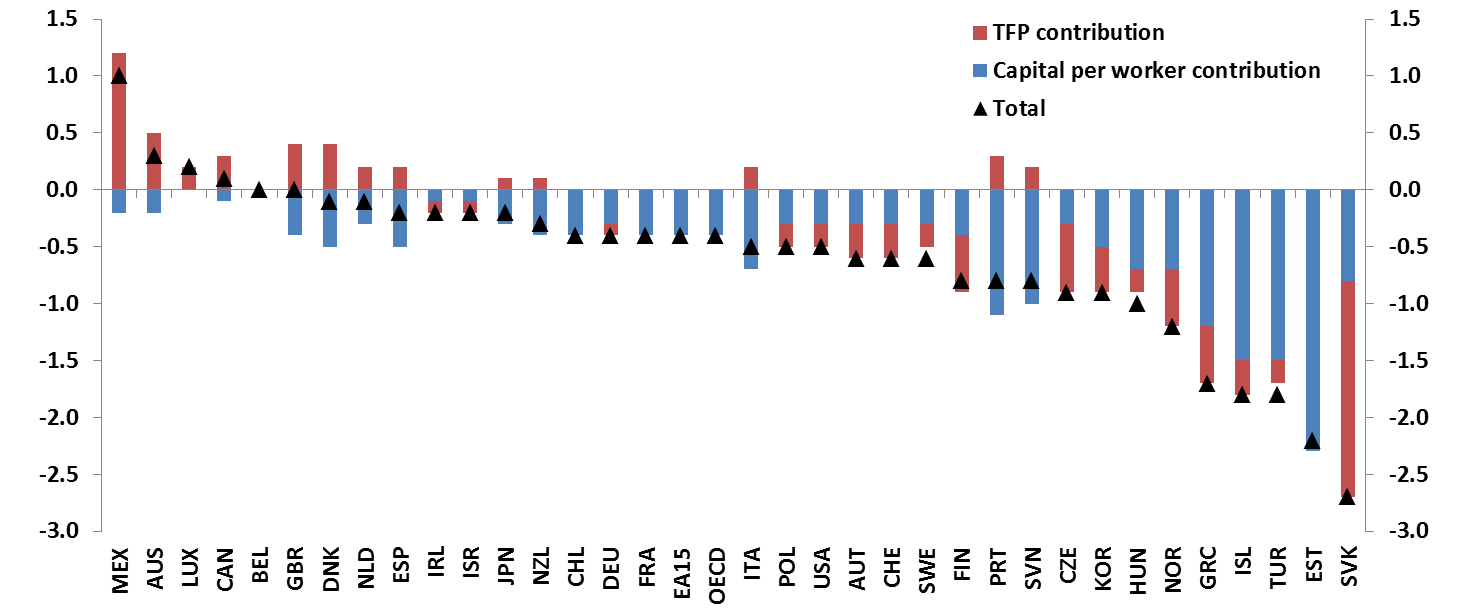
But if we are to boost productivity growth, it would help to understand why it has slowed. Recent OECD work disentangles two overlapping developments (Ollivaud, Guillemette and Turner, 2016). The first is a secular slowdown in total factor productivity growth (the efficiency with which labour and capital inputs are combined in production), which predates the crisis. This trend has continued since, but the reasons behind it are not yet well understood. The second is an abrupt slowdown in investment following the crisis. On average across the OECD and the euro area, trend productivity growth slowed by 0.4 pp per annum between 2007 and 2015, all of which is explained by slower growth in capital per worker. The same is true of most individual OECD countries (see figure).

Change in trend productivity growth between 2007 and 2015

Percentage points per year

cap sstock guilemette

Note: Because the decomposition uses an approximation, a small discrepancy sometimes occurs between the total and the sum of the two contributions.

Why has investment slowed down? A large part of the explanation is simply that weak demand and excess capacity give firms little incentive to invest. Falling investment reduces the amount of capital that workers have to work with, depressing their own productivity and the overall productive capacity of the economy, so-called potential output. The authors calculate that the demand shock associated with the financial crisis may have reduced the aggregate OECD capital stock by about 3¼ per cent and the level of potential output by more than 1% by 2015. The implied reduction in the average growth rate of the capital stock explains about half of the 0.4 pp decline in the contribution from capital deepening to trend productivity growth mentioned above for the OECD area.

Further to the demand effect, capital misallocation during the pre-crisis expansion explains why investment weakness is particularly acute in the countries that saw the biggest investment booms. In addition, many governments have cut public investment in response to deteriorating public finances. Uncertainty, lack of visibility and volatility have added to this unsavoury mix. And to cap it all, the pace of productivity-boosting structural reform has slowed.

High inertia in the capital stock means that the negative effects of the crisis on productivity could last for a while. This realisation adds to the urgency of using all available fiscal space to help stretched monetary policies boost demand, and to redouble efforts on structural reforms.

References:

Ollivaud, P., Y. Guillemette and D. Turner (2016), “Links between weak Investment and the slowdown in productivity and potential output growth across the OECD”, OECD Economics Department Working Papers, No. 1304.

OECD Economic Outlook, June 2016.


Central bank negative deposit rates and the banking sector

By Kei-Ichiro Inaba and Lukasz Rawdanowicz, Macroeconomic Policy Division, OECD Economics Department

The ECB, the Bank of Japan and five other central banks in Europe have applied negative interest rates on commercial banks’ reserves. This additional monetary policy stimulus, following large asset purchases by central banks in some of these areas, should boost the economy and thus raise inflation closer to target. However, its effectiveness may be reduced if negative interest rates undercut banks’ profits. As discussed in Box 1.2 in the latest Economic Outlook, so far these negative effects have been small but will increase in the euro area.

Negative interest rates applied to central bank reserves should lower short and longer-term market interest rates by signalling an easier monetary policy stance and encouraging banks and investors to rebalance their portfolios towards riskier assets. With unchanged monetary policy abroad, they should also weaken the domestic currency. All these effects should bolster the economy and thus banks.

However, negative interest rates may also imply direct losses for banks. The feasibility for banks to compensate these losses depends on their business models. It can be high when banks liabilities are largely in the form of inter-bank loans or bonds and stimulative monetary policy is effective in lowering market interest rates. In contrast, the feasibility will be particularly limited for banks with a large share of retail deposits. Passing negative interest rates to depositors risks widespread withdrawals when storing cash is not very costly. Thus, banks could be forced to compensate losses by raising fees and increasing, or not lowering, interest rates on loans. The chance of such an outcome, and an associated perverse impact on loan demand and growth, increases with the level and duration of negative interest rates.

So far, interest costs on banks’ funds at central banks have been limited and tiny compared to banks’ profits and the average interest rates on funds placed with the central banks are less negative than the central banks’ deposit rates (table below). This stems from various forms of exemptions (tiered reserve systems in Denmark, Japan, Norway and Switzerland; exemption for required reserves in the euro area and Japan). In Sweden, the costs are reduced as banks effectively do not use the deposit facility given that they can purchase Riksbank’s certificates or use overnight fine-tuning operations that are remunerated at less negative interest rates than the deposit rate. In Japan, banks as a whole continue to earn net positive interest income from excess reserves.

In the euro area, the cost of negative interest rates for banks is going to increase with the expansion of ECB total assets and the concomitant increase in reserves for banking sector as a whole. This will not be the case for Japan. Although the Bank of Japan intends to sustain asset purchases, the negative-interest tier has been capped at around 30 trillion yen.

EO99 Investment

References

OECD  (2016), OECD Economic Outlook, Volume 2016, Issue 1, OECD Publishing, Paris.
DOI: http://dx.doi.org/10.1787/eco_outlook-v2016-1-en


What is the scope for public investment to lift long-term growth ?

by  Annabelle Mourougane, Jarmila Botev, Jean-Marc Fournier, Nigel Pain and Elena Rusticelli, OECD Economics Department

Long-term rates are low in OECD countries, particularly in Japan, France and Germany. This opens up fiscal space and can justify any public investment projects with a positive rate of return. At the same time, infrastructure needs are sizeable, especially as fiscal consolidation in recent years has pushed down public capital spending to very low levels in many countries. In such a situation, additional public investment is likely to benefit from high rates of return (Fournier, forthcoming).

New estimates in the June OECD Economic Outlook show long-term output gains of a budget neutral sustained investment stimulus of 0.5% of GDP could amount to between 0.5% and 2% (figure below).

Collective action among the major advanced economies to raise good-quality public investment is estimated to bring additional GDP gains. This would represent a gain of around one-half on average after the first year compared to a scenario where countries acts individually in the large advanced economies but Japan, where the gains are uncertain (Auerbach and Gorodnichenko, 2014). Amongst the major advanced economies, Germany would benefit the most from collective action to boost public investment.
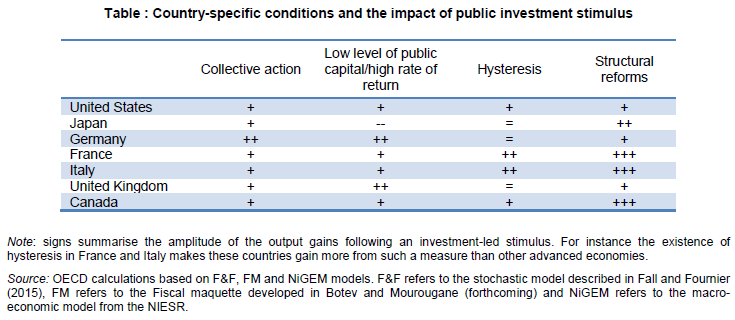
What factors affect the gains to such a stimulus (see table below)? OECD analysis points to the following country-specific factors:

  • the initial level of public capital stock and the rate of returns of these investments: Lowering returns to public capital by one standard deviation could significantly reduce the long-term effect on output, by cutting it by around 3/4. Amongst the large advanced economies, the effect on output would be above average in Germany and the United Kingdom, while the output gains can be negative for Japan.
  • the country’s initial position in the economic cycle and the extent of labour-market rigidities, which determine how far persistent demand weakness undermines the productive capacity of the economy (“hysteresis”). In Italy and France, where this hysteresis effect is stronger, the effect of public investment stimulus is stronger.
  • the additional gains structural reforms can bring to the economy: Reforms targeted at frictions that hold back demand for investment, such as increasing product market competition, can lower the opportunity costs of investing, and hence raise the catalytic impact of public investment on private capital spending. Lowering product market regulations by the average improvement over two years in a typical OECD country could add around 0.1-0.3 percentage point to the growth impact after the first year. Such gains would be sizeable in France, Italy and Canada.

Investm2.png


Investment1

References

Auerbach, A.J. and Y.Gorodnichenko (2014), “Fiscal Multiplier in Japan”, NBER Working Papers, No. 19911.

Botev, J. and A. Mourougane (forthcoming), “Fiscal Consolidation: What are the Breakeven Fiscal Multipliers?”, OECD Economics Department Working paper, OECD Publishing, Paris.

Fall, F. and J.M. Fournier  (2015), “Macroeconomic Uncertainties, Prudent Debt Targets and Fiscal Rules”,OECD Economics Department Working Papers, No. 1230, OECD Publishing, Paris.

Fournier, J.M. (forthcoming), “The Positive Effect of Public Investment on Potential Growth”, OECD Economics Department Working Paper, OECD Publishing, Paris.

Mourougane, A., J. Botev, J.M. Fournier, N. Pain and E. Rusticelli (forthcoming), “Can an Increase in Public Investment Sustainably Lift Growth?”, OECD Economics Department Working Papers, OECD Publishing, Paris.


Policymakers: Act now to break out of the low-growth trap and deliver on our promises

By Catherine L. Mann, OECD Chief Economist

Policymaking is at an important juncture. Without comprehensive, coherent and collective action, disappointing and sluggish growth will persist, making it increasingly difficult to make good on promises to current and future generations.

Global growth has languished over the past eight years as OECD economies have struggled to average only 2 per cent per year, and emerging markets have slowed, with some falling into deep recession. In this Economic Outlook the global economy is set to grow by only 3.3 per cent in 2017. Continuing the cycle of forecast optimism followed by disappointment, global growth has been marked down, by some 0.3 per cent, for 2016 and 2017 since the November Outlook.

The prolonged period of low growth has precipitated a self-fulfilling low-growth trap. Business has little incentive to invest given insufficient demand at home and in the global economy, continued uncertainties, and a slowed pace of structural reform. In addition, although the unemployment rate in the OECD is projected to fall to 6.2 per cent by 2017, 39 million people will still be out of work, almost 6.5 million more than before the crisis. Muted wage gains and rising inequality depress consumption growth. Global trade growth, at less than 3 per cent on average over the projection period, is well below historical rates, as value-chain intensive and commodity-based trade are being held back by factors ranging from spreading protectionism to China rebalancing toward consumption-oriented growth.

Negative feedback-loops are at work. Lack of investment erodes the capital stock and limits the diffusion of innovations. Skill mismatches and forbearance by banks capture labour and capital in low productivity firms. Sluggish trade prospects slow knowledge transfer. These malignant forces slow down productivity growth, constraining potential output, investment, and trade. In per capita terms, the potential of the OECD economies to grow has halved from just below 2 per cent 20 years ago to less than one per cent per year, and the drop across emerging markets is similarly dramatic. The sobering fact is that it will take 70 years, instead of 35, to double living standards.

The low-growth trap is not ordained by demographics or globalization and technological change. Rather, these can be harnessed to achieve a different global growth path – one with higher employment, faster wage growth, more robust consumption with greater equity. The high-growth path would reinvigorate trade and more innovation would diffuse from the frontier firms as businesses respond to economic signals and invest in new products, processes, and workplaces.

What configuration of fiscal, monetary, and structural policies can propel economies from the low-growth trap to the high-growth path, safeguarding living standards for both young and older generations?

Monetary policy has been the main tool, used alone for too long. In trying to revive economic growth alone, with little help from fiscal or structural policies, the balance of benefits-to-risks is tipping. Financial markets have been signalling that monetary policy is overburdened. Pricing of risks to maturity, credit, and liquidity are so sensitized that small changes in investor attitude have generated volatility spikes, such as in late 2015 and again in early 2016.

Fiscal policy must be deployed more extensively, and can take advantage of the environment created by monetary policy. Governments today can lock in very low interest rates for very long maturities to effectively open up fiscal space. Prioritized and high-quality spending generates the capacity to repay the obligations in the longer term while also supporting growth today. Countries have different needs and initial situations, but OECD research points to the kind of projects and activities that have high multipliers, including both hard infrastructure (such as digital, energy, and transport) and soft infrastructure (including early education and innovation). The right choices will catalyse business investment, which, as the Outlook of a year ago argued, is ultimately the key to propelling the economy from the low-growth trap to the high-growth path.

The high-growth path cannot be achieved without structural policies that enhance market competition, innovation, and dynamism; increase labour market skills and mobility; and strengthen financial market stability and functioning. As outlined in the special chapter in this Outlook, the OECD’s Going for Growth and the comprehensive Productivity for Inclusive Growth Nexus Report of the OECD Ministerial Summit, there is a coherent policy set for each country based on its own characteristics and objectives that can raise productivity, growth and equity.

The need is urgent. The longer the global economy remains in the low-growth trap, the more difficult it will be to break the negative feedback loops, revive market forces, and boost economies to the high-growth path. As it is, a negative shock could tip the world back into another deep downturn. Even now, the consequences of policy inaction have damaged prospects for today’s youth with 15 per cent of them in the OECD not in education, employment, or training; have drastically reduced the retirement incomes people are likely to get from pension funds compared to those who retired in 2000; and have left us on a carbon path that will leave us vulnerable to climatic disruption.

Citizens of the global economy deserve a better outcome. If policymakers act, they can deliver to raise the future path of output – which is the wherewithal for economies to make good on promises – to create jobs and develop career paths for young people, to pay for health and pension commitments to old people, to ensure that investors receive adequate returns on their assets, and to safeguard the planet.


OECD Economic Outlook urges policy action to promote productivity and equality

by Oliver Denk, OECD Economics Department

The Special Chapter of the OECD Economic Outlook published today shows why the global economy remains in the doldrums. Since the mid-2000s, productivity growth has been markedly lower than at any other time since the 1950s. This matters as rising productivity lies at the heart of economic progress.

The chapter also shows another unsettling trend. Income inequality has been on a steady upward rise over the past 30 years. Technological change and globalisation are likely to have put low- and medium-skilled workers at a disadvantage. On the other hand, income growth has been especially high for the top 1%.

The productivity slowdown and the rise in inequality have acted as a “double-whammy” for many workers and their families. On average across OECD countries, income of the bottom 40% in the income distribution has improved by a dismal ½ per cent per year over the past decades (adjusted for inflation). Income of the bottom 10% is effectively no higher than in 1990, a quarter-century ago.

Given these unsatisfying developments, it is no wonder that economic, social and political discontent has risen on both sides of the Atlantic. Worryingly, no fast turnaround is in sight. The global projections in our Economic Outlook, also released today, forecast only a small uptick in productivity growth for 2016-17.

How can policymakers reverse the two trends of slowing productivity and rising inequality? Many policy choices – on monetary, fiscal and structural policies – affect both productivity and inequality. They could thus tackle these twin challenges together. Ambitious, multifaceted and coherent policy actions are necessary.

Aggressive demand management will help economies return to trend productivity and employment. The downturn since 2007 has not only depressed productivity but also employment. Low-income, low-skilled workers have often been the first to lose their job. Accommodative monetary and fiscal policies work against this rise in poverty and income inequality.

Equally important, many countries have ample scope for structural policies to improve the education system, upgrade their infrastructure, facilitate the entry and exit of firms and support workers in transitioning to emerging, high-productivity jobs. Is there a one-size fits all? The chapter draws out the key general lessons, but country specificities matter as well. You can find the reform priorities tailored to each country’s circumstances in the country notes.

Background

Promoting Productivity and Equality: A Twin Challenge

OECD Economic Outlook

The Productivity-Inclusiveness Nexus

Global Forum on Productivity


Productivity, productivity, wherefore art thou?  (Romeo and Juliet: Act 2, Scene 2)

First published on OECD Insights http://wp.me/p2v6oD-2vJ.

By OECD Statistics Directorate

Four hundred years after the death of Shakespeare there remain many misconceptions on what he wrote. Perhaps the most common concerns the adulterated quote above, which is actually a reference to why Romeo was a Montague rather than where Romeo was. In the same spirit of confusion, recent years have seen considerable debate about the causes of the productivity slowdown seen across OECD countries.

This year’s Productivity Compendium includes a special chapter that casts a spotlight on some of the potential villains stalking the stage, together with insights from the OECD Productivity Database, and frames the discussion under the umbrella of the Productivity Paradox: a reference to the fact that productivity has slowed during a period of significant technological change, increasing participation of firms and countries in global value chains and rising education levels in the labour force.  Indeed, the advent of digital innovations such as Big Data was expected to have sparked off a new wave of productivity growth, similar to those seen in the past, for example, as a result of electrification in the early 1900s and the ICT wave in the 1990s.

However, this has not yet materialised, raising a number of still largely open questions, ranging from potential lagged effects of these new technologies, a thinning out of new ideas (Gordon, 2012) to a breakdown of the ‘diffusion’ machine (OECD, 2015), right through to measurement.  Indeed, against a backdrop of increases in income and wealth inequalities, concerns have emerged that this may reflect a structural, and not a cyclical, slowdown, with consequential impacts on well-being and long-term growth; hence the theme for this year’s OECD Ministerial meeting and OECD Forum : “Enhancing Productivity for Inclusive Growth” www.oecd.org/forum.

Double, double toil and trouble (Macbeth: Act 4, Scene 1)

But whilst all of these actors may in part explain the recent post-crisis productivity slowdown, often overlooked in the debate is that the slowdown in productivity is not a recent affair, a fact that even Macbeth’s witches may have struggled to foresee. The OECD Compendium of Productivity Indicators 2016 reveals that productivity growth began to slow well before the crisis; trending down since the early 2000s in Canada, the United Kingdom and the United States and since the 1970s in France, Germany, Italy and Japan (Figure 1).

Fig1-Productivity-G7.fw

Download graphs and data in Excel

Part of this downward trend in labour productivity can be explained by slower growth in multi-factor productivity (MFP), lending some weight to the arguments that technological spill-overs and diffusions from ICT, and other new technologies may be lower than from earlier technology breakthroughs. But lower MFP growth is not the only source.  In many countries the contribution of capital deepening has also declined significantly, particularly in recent years.

Nothing will come of nothing (King Lear: Act 1, Scene 1)

Although King Lear uttered the words above to his daughter Cordelia to solicit overt affection, his words are now typically used to illustrate that without investment, neither growth, nor indeed productivity, will follow. The Compendium shows, for example, that the direct contribution of information and communication technology (ICT) capital goods to productivity reached its peak in the late 1990s and has gradually waned since then, significantly so in most countries (Figure 2).

Fig2-contribution-ICT-capital.fw

Download graph and data in Excel

And although the shares of ICT investment have held up reasonably well compared with other forms of investment, ICT investment as a share of GDP also remains below previous highs in many countries (Figure 3). Moreover, when measured and included, although knowledge based capital has held up better, it too has slowed in recent years and makes little change to the overall picture.

Fig3a-3b-ICT-investment.fw

Download graphs and data in Excel

Truth is truth, to the end of reckoning (Measure for measure: Act V, Scene 1)

One suspect behind the slowdown, well versed in having to deal with the ‘slings and arrows of outrageous fortune’ is measurement.  Indeed so prevalent is the view that measurement is at fault, particularly relating to the measurement of new disruptive (digital) technologies, such as Big Data,  and business models, such as AirBnB and UberPop, it has been given its own acronym, MMH, the Mis-Measurement Hypothesis.  The spread of digitalised applications has brought with it the provision of free services such as internet search capacity and media content and new business models, many of which are dependent on greater participation (i.e. labour input) by consumers.  But the consumer’s activity remains (by and large) outside of the GDP production boundary, and the free services received are not captured as household consumption, raising questions about a missing ‘consumer surplus’ from GDP.

However, whilst it is clear that digitalisation may have compounded long standing measurement issues, in particular the measurement of price change and, so in turn, volume measures used in productivity measurement, and where efforts to improve measurement continue, the evidence increasingly suggests that the MMH is, at best, only partially true.  Syverson (2016) for example shows that US GDP would have been around 15% higher in the third quarter of 2015 if the recent slowdown (post 2004) hadn’t occurred, swamping any potential unmeasured productivity growth and estimates of the consumer surplus, while Byrne, Fernald, and Reinsdorf (2016) show similar results.  Ahmad and Schreyer (2016) further demonstrate that the GDP accounting framework is ‘up to the challenges posed by digitalisation’ and reinforce the distinction that needs to be made between GDP and welfare and indeed consumer surplus.

This is the short and the long of it (The Merry Wives of Windsor: Act II, Scene II)

In summary therefore the evidence suggests that the productivity slowdown is real and not a statistical phenomenon.  True as this may be, it is also true that attempts to identify the causes of the slowdown can be greatly facilitated by improved availability or use of firm-level statistics in analyses, in particular on intra-firm transactions, and improved data on investment by type of asset, occupations, and skills. So, although statistics are not at fault they continue to provide the best route for a solution to the paradox and the key for policies that can restart the productivity engine.


The OECD Productivity Database

The OECD Productivity Database contains a consistent set of internationally comparable data on levels and growth rates of labour productivity, hours worked, employment, capital services, multifactor productivity and unit labour costs for OECD countries and Key Partners. It also includes growth measures of labour productivity, hours worked, employment and unit labour costs by main economic activity. These series, available from 1970 onwards for some countries, are updated on a daily basis.

Get real-time data at OECD Productivity Statistics (Database)


References

Ahmad, N and P. Schreyer (2016), “Measuring GDP in a Digitalised Economy”, OECD Statistics Directorate Working Paper, forthcoming.

Byrne D., J. Fernald and M. Reinsdorf (2016), “Does the United States have a productivity slowdown or a measurement problem?”, Brookings Papers on Economic Activity, BPEA Conference Draft, March 10-11.

Gordon, R. (2012), “Is US Economic Growth Over? Faltering Innovation Confronts the Six Headwinds”, NBER Working Papers, No. 18315.

OECD (2015), The Future of Productivity, OECD Publishing, Paris, http://dx.doi.org/10.1787/9789264248533-en.

OECD (2016), OECD Compendium of Productivity Indicators 2016, OECD Publishing, Paris, http://www.oecd.org/std/productivity-stats/oecd-compendium-of-productivity-indicators-22252126.htm.

Syverson, C. (2016), “Challenges to mismeasurement explanations for the U.S. productivity slowdown”, NBER Working Paper No. 21974, http://www.nber.org/papers/w21974.