Italy’s reforms are paying off but challenges remain

By Mauro Pisu, Head of Italy Desk, Country Studies Branch, OECD Economics Department

Italy is recovering after a deep and long recession. Structural reforms, accommodative monetary and fiscal conditions, and low commodity prices have spearheaded the ongoing economic recovery. The Jobs Act and social security contributions’ exemptions jolted the labour market, leading to rising employment and higher consumer spending. Additional reforms in different areas, such as the school system, public administration, budget making process, banking system have been passed and implemented or are in the course of implementation. Greater focus has also been put on past reforms, with a sharp reduction in the backlog of decrees needed to implement them. The rejection of the constitutional reform by referendum in December 2016 has heightened political uncertainty but as discussed in the recently released OECD Economic Survey of Italy, the structural reform process must continue if Italy is to build a more inclusive and prosperous society.

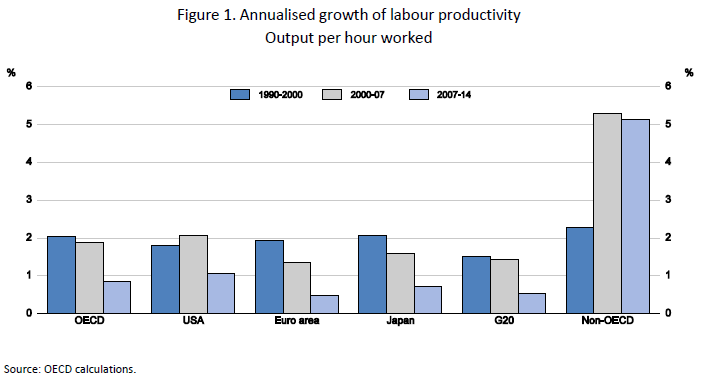
Despite the recent macroeconomic progress, the pace of the ongoing recovery remains modest (Figure 1). Productivity continues to decline and investment growth is weak. Public-administration inefficiencies, slow judicial processes, poorly designed regulation and weak competition still make it difficult to do business in Italy. Labour and capital resources are trapped in low-productivity firms, which hold down wages and well-being. Innovative start-ups and SMEs continue to suffer from difficult access to finance, especially through the corporate bond and equity markets. The Italian banking system features low profits and a large stock of non-performing loans, discouraging lending and investment.

italy-gdp-and-employment-1

Boosting investment is key to strengthening the recovery and increasing labour productivity.  Raising investment will hinge on enhancing business dynamism, improving insolvency procedures, strengthening the innovation system and targeting innovation incentives towards innovative SMEs and start-ups. Restructuring the banking sector to improve governance and raise efficiency, and inducing banks to dispose of their bad debts, is key to restarting lending to firms.

The long crisis has eroded social inclusion, requiring renewed efforts to raise employment, reduce poverty, especially among youths and children, and improve skills. Strengthening further job creation, by lowering social security contributions, is crucial to increasing the employment rate, which, which despite recent improvements is still one of the lowest among OECD countries. Further progress on combating tax evasion, introducing a real estate tax based on updated cadastral value and cutting the numerous tax expenditures devoid of any economic and social rationale could offset the revenue lost by reducing social security contributions.

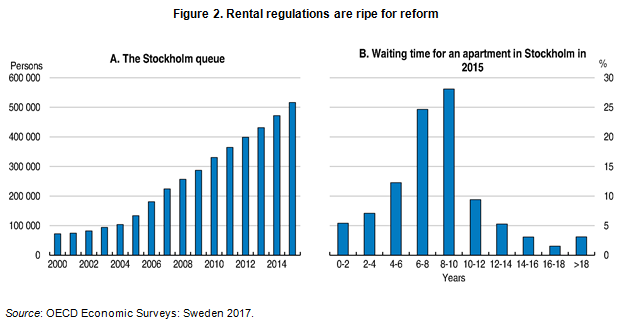
The crisis has also lead to sharp increase in poverty, especially among the young and children, which the weak economic recovery has not yet enabled to reverse (Figure 2). For instance, the absolute poverty rate of families with 1 or 2 children rose from 1.1 and 2.3% in 2006 to 4.9 and 8.6% in 2015. Over the same period, the absolute poverty rate among old people remained broadly stable. Ample empirical evidence has shown the large negative effects poverty experienced at young age has on school results as well as adult income and health status. It is of the utmost importance to implement the recently launched National Plan against Poverty, whose main aim is to establish a new nation-wide antipoverty programme (Reddito di Inclusione, REI). The allocated funds are still limited but are an improvement compared with the currently available resources. The government should ensure that the new programme is sufficiently funded to substantially reduce poverty among young children.

italy-2-poverty

References:

OECD (2017), OECD Economic Surveys: Italy 2017, OECD Publishing, Paris.


Structural reforms to revive growth in Europe: necessary but not sufficient

By Aida Caldera Sánchez, European Union Desk, and Nicolas Ruiz, Structural Surveillance Division, OECD Economics Department

After many years characterised by output losses or quasi-stagnation, steadier growth appears to be setting in across European economies. Recent data point to an upturn in growth, the euro-area unemployment rate has finally fallen below 10%, and private-sector confidence has strengthened. Yet, there is still a need to address the consequences of the crisis, as unemployment remains high, and sizable non-performing loans continue to be a constraint in some countries. Moreover, one challenge that basically all governments face is the sharp slowdown in productivity.  Productivity – a central ingredient in the pursuit of growth and well-being – has been decelerating in most European economies. The slowdown has been particularly sharp since the crisis but was already noticeable before, suggesting that structural factors may lie behind the downward trend (Figure 1).

annualised-growth-of-labour-prod-blog

To address these challenges, structural reforms are necessary but not sufficient to restore robust growth in Europe. This is why the OECD advocates for a three-pronged approach (OECD, 2016a). First, existing exceptional monetary measures should continue in the euro area until inflation reaches target, albeit the scope to continue the stimulus or to move beyond existing plans is now very limited. Second, more active fiscal policy is needed to support aggregate demand and boost potential output. Third, these macro-policies should support an enhanced and efficient implementation of structural reforms.

Indeed, fiscal policy should take advantage of the increase in fiscal space provided by low interest rates to boost growth, equity, and productivity, including via enhanced hard and soft infrastructure investment and other tax, spending, and structural measures that support growth and potential output. Fiscal policy should do more to support growth, possibly by easing the application of the EU Stability and Growth Pact within existing rules, for example by making it easier to exclude net investment spending from fiscal rules (OECD, 2016a). Collective fiscal efforts would have greater impact than individual efforts. Combined with bold and coherent collective actions on structural reforms to strengthen Europe’s economic fabric, the gains from fiscal action would be magnified. In short, the gains would be more than the sum of the parts.

On the structural reforms front what needs to be done? The EU Single market remains far from completed, and the 2016 OECD Economic Survey of the European Union (OECD, 2016b) makes recommendations to reinvigorate it:

  • Capital markets are fragmented, and firms are over-dependent on bank financing. Improved securitisation, better collection and sharing of credit information on SMEs and harmonization of insolvency regimes would help expand and diversify sources of financing and help sustain the recovery.
  • Labour mobilitywould profit from reduced administrative and regulatory barriers, such as faster recognition of professional qualifications and better portability of social and pension rights.
  • Product market reforms would help to unlock investment. National regulations and technical specifications in network sectors, such as energy and transportation, should be harmonised further. Regulatory burdens could be alleviated by better impact assessment of legislative proposals and ex-post policy evaluation. Projects to improve trans-European transport and energy grids should be prioritised.

Structural reforms are needed but they also need to be designed coherently. A bigger bang for the buck will be ensured if reforms are implemented through articulated and coherent policy packages that maximise synergies across areas. A review of the evidence suggests that simultaneous reforms of labour and product markets are typically more growth enhancing than isolated reforms (Caldera Sánchez et al., 2016). Over the last two years, however, such reform packages have not been the norm. For example, reforms have been undertaken either in the labour market or product markets, but very rarely in both (Figure 2). An example is Greece, where much of the adjustment has been borne by workers, while monopoly power and barriers to entry have remained in place in many sectors (OECD, 2016c). Better coordination of reforms across different areas would ease implementation and maximise the favourable growth and job impact of structural reforms.

mixed-implementation

References

Caldera Sánchez, A., A. de Serres and N. Yashiro (2016), “Reforming in a difficult macroeconomic context: A review of the issues and recent literature”, OECD Economics Department Working Papers, No. 1297, OECD Publishing, Paris. http://dx.doi.org/10.1787/5jlzgj45b3q0-en

OECD (2016a), OECD Economic Outlook, Volume 2016 Issue 2, OECD Publishing, Paris.
http://dx.doi.org/10.1787/eco_outlook-v2016-2-en

OECD (2016b), Economic Surveys: European Union 2016, OECD Publishing, Paris. http://dx.doi.org/10.1787/eco_surveys-eur-2016-en

OECD (2016c), OECD Economic Surveys: Greece 2016, OECD Publishing, Paris. http://dx.doi.org/10.1787/eco_surveys-grc-2016-en


Conquering utopia anew – Income inequality in Sweden

by Jon Pareliussen, Swedish Desk, Country Studies Branch, OECD Economics Department

“Equality is a utopia (…) that must be constantly redefined and constantly conquered anew.”

-Olof Palme, 30 July 1965.

Equality, a long-standing hallmark of Swedish society, carries multiple benefits in terms of economic performance, trust, opportunity and well-being. Income inequality is relatively low in Sweden compared to the OECD average, but a rapid rise from the 1990s calls for new efforts to redefine and re-conquer equality once again. Chapter one in the new Economic Survey is dedicated to understanding and addressing the rise of inequality in Sweden (OECD, 2017).

Top incomes grew strongly from the 1990s, mainly as a result of increasing capital gains and dividends, but the collection of wealth statistics was discontinued from 2007, which makes analysing the underlying causes challenging. In the bottom end of the income distribution, working-age benefits were cut or frozen following the economic crisis of the early 1990s. Decades of slow uprating led to a gradual decline of benefits relative to earnings. Analysing the distributional consequences of different uprating scenarios annually would highlight the consequences of inaction, but leave actual increases at the heart of political debate and decision-making, where it firmly belongs.

blog-fig-1-stagnating-sweden

Significant demographic and structural changes, with ageing, more single and single parent households, higher educational attainment, a shift away from manufacturing, and higher, mostly non-labour, immigration, are behind more than 40% of the increase in the Gini coefficient from 1987 to 2013 (Robling and Pareliussen, 2017). These trends increase the importance of redistribution and labour market policies as countermeasures.

One such trend is the increasing number of humanitarian and family reunion migrants, who have lower incomes than natives and less adequate housing. Furthermore, residential segregation leads to school segregation. With low skills compared to natives, partly as a result of lower education attainment, partly due to difficulties with language and culture, many struggle finding employment (OECD, 2015; Bussi and Pareliussen, 2015).  Relatively well-developed integration policies can be further harnessed by learning from successful experiences at the local level, continuing to individually adapt upskilling activities, shortening the time it takes to get residence and work permits, simplifying and consolidating wage subsidy schemes.

Finally, housing market inefficiencies hit the least well-off. The difference in housing conditions between the rich and the poor is high in Sweden. Tightening the generous tax treatment of owner-occupied housing would increase affordability. Easing strict rental regulations while maintaining tenant protection against abuse would increase mobility for those who cannot afford to buy, incentivise rental housing supply and lead to better utilisation of the housing stock. Some prioritisation to municipal housing with well-designed allocation rules could help low-income households and limit residential segregation.

blog-fig-2-rentals-in-sweden

References:

Bussi, M. and J. Pareliussen (2015), “Skills and labour market performance in Sweden”, OECD Economics Department Working Papers, No. 1233, OECD Publishing, Paris. http://dx.doi.org/10.1787/ 5js0cqvnzx9v-en.

OECD (2015), OECD Economic Surveys: Sweden 2015, OECD Publishing, Paris.
DOI: http://dx.doi.org/10.1787/eco_surveys-swe-2015-en.

OECD (2017), OECD Economic Surveys: Sweden 2017, OECD Publishing, Paris.
DOI: http://dx.doi.org/10.1787/eco_surveys-swe-2015-en.

Robling, P. and J. Pareliussen (2017), “Structural inequality – The case of Sweden”, OECD Economics Department Working Papers, forthcoming, OECD Publishing.


Portugal needs stronger investment to maintain growth and improve living standards

By Jens Arnold, Portugal Desk, OECD Economics Department

Portugal’s economy has successfully recovered from the strong recession that lasted until 2014. Nonetheless, the economy’s still low investment, which has declined far more than in other Euro area countries, remains a source of concern (Figure 1). Since 2012, investment has hardly exceeded the depreciation of the existing capital stock, meaning that growth of the productive capital stock has almost stalled. This is one reason behind the low potential growth of the Portuguese economy, which the OECD currently puts below 0.5%. Without stronger investment, growth performance is bound to decline to such low levels over the next years.

blog-portugal-1-total-invest

Raising investment also matters for wage and productivity developments. Low investment limits the growth of labour productivity, which represents the wage increases that Portuguese workers can pocket without deteriorating the competitiveness of their companies.

More investment is also needed to support the substantial structural change that the Portuguese economy is undergoing. After many years of credit-fuelled expansion of the non-tradable sector, there have been encouraging signs of a reversal towards tradable sectors in recent years, as illustrated by the significant increase in exports. But building on this progress will not be possible without stronger investment in tradable sectors.

Start-ups and young firms are playing a crucial role in this restructuring process. A remarkable 16% of goods exports originated from young exporters in 2014 (Bank of Portugal, 2016). Young firms are also important for productivity: firm level analysis from a census of Portuguese firms suggests that new market entrants have stronger productivity growth than more mature firms, both with respect to labour productivity and multi-factor productivity (Figure 2). They also create three times more jobs than other firms, accounting for almost half the jobs created (Criscuolo et al, 2014).

blog-portugal-2-young-firms

But for young firms to prosper, it is important that they get access to finance for their investment needs and that the overall framework conditions are conducive to their entry and growth. Indeed, there is some evidence that the rise of new firms among exporters is losing momentum (Bank of Portugal, 2016). This underlines the need for further improvements in policies.

For example, cleaning up large amounts of non-performing legacy loans on the balance sheets of Portuguese banks is crucial for freeing up funds that stronger firms require to finance investment. In a recent survey by the European Central Bank on SME financing, Portuguese respondents had the second highest incidence of mentioning access to finance as an obstacle, higher than the EU average. Dealing with non-performing loans will require much more decisive policy action than in the past, both with respect to bank supervision and the development of secondary markets for distressed debt.

Given that a large share of Portugal’s distressed assets are loans to corporate borrowers, well-working insolvency frameworks are crucial to restructure companies that are still viable and to allow a speedy recovery of non-viable companies’ assets before they lose value. Portugal has taken important steps to overhaul its corporate insolvency and restructuring framework. However, differences between the rules and their actual implementation persist.

Access to finance is not the only obstacle to higher investment. Even where firms could finance an investment project, they may prefer to hold off because the expected returns are not sufficiently attractive. Weak demand has been a drag on investment in recent years. That’s why it is important to pursue prudent macro-economic policies so as not to jeopardise the recovery of the economy. But further supply-side measures are also crucial. Structural reforms that reduce the cost of doing business in Portugal could make more potential investment projects worthwhile.

Reforms in areas such as regulation, the judicial system, services sectors including utilities and the labour market have led to impressive improvements in historical comparison. However, as discussed in the recently released OECD Economic Survey of Portugal, the reform momentum has slowed down visibly since the end of the external assistance programme, and reform implementation has fallen short of initial ambitions in several key areas. In some areas, much has changed, for example in labour markets, although more could be done. In other areas, such as product market reforms and the regulation of non-tradable sectors, there is scope for further progress, particularly with respect to implementation. Some of Portugal’s rules and institutional features can act as implicit barriers to firm entry and post-entry growth, and should be subjected to a critical review in light of the loss of momentum in the rise of new firms.

References

Bank of Portugal (2016), “Portuguese international traders: some facts about age, prices and markets”,  Economic Bulletin, October 2016, Lisbon.

Criscuolo, C, P N Gal, and C Menon (2014), “The dynamics of employment growth: new evidence from 18 countries”, OECD Science, Technology and Industry Policy Papers, OECD Publishing, Paris.

OECD (2017), OECD Economic Surveys: Portugal 2017, OECD Publishing, Paris. http://dx.doi.org/10.1787/eco_surveys-prt-2017-en


Strengthening economic resilience: What lessons to draw from the post-1970s record of severe recessions and financial crises

By Alain de Serres, Filippo Gori and Mikkel Hermansen, OECD Economics Department

Major global crises such as the 2008-09 episode are mercifully rare, but severe recessions have been quite frequent among OECD countries over the past four decades.  Even when they do not inflict long-lasting economic damages, they often entail significant costs in terms of foregone income and high unemployment. It is therefore important that measures be taken to minimise the risk and frequency of such episodes, but also to mitigate their impact once they occur. This raises the question of what can policy makers do to lastingly enhance resilience in the face of economic and financial risks. In looking for answers, they need to be mindful of the potential long-term growth impact of risk-mitigating measures.

More specifically, in considering measures to reduce risks, the benefits need to be balanced against the potential costs in terms of the lower average economic growth rate that some policies could entail. The objective is to reduce financial fragilities and minimise systemic risk, but without undermining entrepreneurial risk-taking, which is the essence of innovation-based economic growth. When risk-mitigating measures involve a trade-off between growth and crisis risk, the most cost-effective actions need to be identified, spanning both macro and structural policies.

Recent OECD research sheds light on possible growth-crisis trade-offs from two angles: i) looking at the extent to which pro-growth policies can make economies more vulnerable to severe recessions and ii) assessing the impact on growth of risk-mitigating (prudential) policies. These issues are explored using an empirical approach that provide insights on both the impact of various policy settings on average GDP growth on the one hand, and either financial crises (i.e. banking, currency and twin crises) or exceptionally low GDP growth rates (i.e. extreme negative tail risk), on the other (see references).

What are the main insights from this research? Considering first policies outside the financial sector, that is product and labour market policies as well as those related to the quality of institutions, there is no evidence that policymakers would face trade-offs between enhancing growth and reducing risks of crises (see figure).

  • The results indicate having in place a sound legal and judicial infrastructure – based on a high quality of institutions – is good for both growth and resilience. It may do so notably by facilitating a greater diversification of funding sources away from the banking sector and towards capital markets.
  • Regarding product and labour market policies, the findings indicate that policy settings conducive to higher productivity (g. through stronger product market competition) and employment generally have little impact on crises risks, i.e. they do not reduce the likelihood of severe recessions, but do not raise it either.

More significant trade-offs between growth and crisis risks arise in the case of financial market policies:

  • Financial market liberalisation often yields stronger growth, but also higher risks of banking crises and hence severe recessions. That said, in the cases where liberalisation essentially leads to the development of private credit – in particular bank credit – as opposed to equity-based financial instruments, the impact on growth diminishes.
  • Greater capital flow openness raises growth, but also increases the risk of banking and currency crises. However, the results indicate that among the different types of capital flows, only debt is associated with higher crisis risk.
  • The risk of crises can be mitigated through prudential policies. Indeed, greater use of prudential policies is associated with fewer occurrences of severe recessions. At the same time, the findings indicate that several of these measures may come at a cost in terms of lower average growth.

resilience-blog-ads

Note: Structural policies should be assessed on the basis of their effect on growth and economic fragility. In this chart, the effect of policies on economic fragility is plotted on the horizontal axis, the effect on growth is shown on the vertical axis. Fragility is defined as a higher likelihood of financial crises (banking, currency or twin crisis) or a higher GDP (negative) tail risk. Different risk-growth patterns emerge for each of policy area considered: pro-growth labour and product market policies improve economic performance without substantially affecting economic fragility. Better quality of institutions both increases growth and reduces economic fragility. However, macro-prudential and financial market polices entail a growth-risk trade-off: the former decrease economic risk to the detriment of a higher growth rate, the latter promote growth but also increase financial risk.
Source: Authors’ calculation based on Caldera Sánchez and Gori (2016) and by Caldera Sánchez and Röhn (2016).

What does this mean for policy? One of the main implications of the analysis is that taking measures in the financial sector to lower the risk of severe recessions is entirely appropriate, but focusing too narrowly on that sector is unlikely to be sufficient and could entail substantial costs in terms of foregone GDP growth.  Policymakers need to consider other potential sources of distortions that can contribute to the build-up of vulnerabilities.

OECD research also shows that among the factors creating an environment prone to severe recessions, the more prominent are rapid growth of private credit, imbalances in the housing market (as proxied by real house prices and the ratios of house prices to income and house prices to rent), and, to a lesser extent, large current account imbalances. This points to the need for looking at how domestic policy distortions – notably in the areas of housing market regulation as well as taxation – contribute to excess leverage, in particular through real estate markets and current account imbalances.

References:

Caldera Sánchez, A., A. de Serres, F. Gori, M. Hermansen and O. Röhn (2016) “Strengthening economic resilience: insights from the post-1970 record of severe recessions and financial crises economic policy paper”, OECD Economic Policy Papers, December 2016 No. 20.

Caldera-Sánchez, A. and O. Röhn (2016), “How Do Policies Influence GDP Tail Risks?”, OECD Economics Department Working Papers, No. 1339, OECD Publishing, Paris.

Caldera-Sánchez , A. and F. Gori (2016), “Can Reforms Promoting Growth Increase Financial Fragility? An Empirical Assessment”, OECD Economics Department Working Papers, No. 1340, OECD Publishing, Paris.


The business climate has improved in Indonesia, but this is no time for complacency

by Patrice Ollivaud and Petar Vujanovic, OECD Economics Department

The government has put a heavy emphasis on improving the business climate, thereby promoting a competitive, innovative and dynamic private business sector. Traditionally Indonesia has relied heavily on commodities, but the recent focus of policy has been on facilitating economic development and structural change by diversifying the economy, supporting the development of the manufacturing sector and promoting downstream local value added.

Global competitiveness rankings illustrate the challenges faced by Indonesia. In terms of competitiveness, according to the World Economic Forum, Indonesia’s overall ranking in 2016 slipped to 41st and would be even lower (52nd) if market size is excluded from the calculation (Figure 1). As pointed out in the 2016 OECD Economic Survey of Indonesia, poor infrastructure is one factor holding back structural transformation. The government has recently committed a large amount of funding to fill some of the gaps. However a lot remains to be done, for instance regarding labour market regulation and health and education outcomes.

The authorities have released 13 reform packages since September 2015, focusing notably on deregulating and improving the business environment. And the President has set a target of boosting Indonesia to at least 40th place among 189 economies in the World Bank’s Doing Business rankings. Indonesia has recently made good progress in that exercise, moving from 120th to 91st between 2015 and 2017 (World Bank, 2016). The bulk of this improvement came from changes to corporate tax rules. For example, the average number of annual tax payments a firm is required to make fell from 65 in 2015 to 43 in 2017, but it remains well above Singapore (6), Malaysia (9) and Thailand (21) and Indonesia still ranks 160th in this subcategory. In its 12th reform package the government stated its intention to reduce the number of tax payments per year to just 10.

As noted in the Survey, a significant part of the problem resides at the sub-national level, and indeed, in July 2016 3 000 sub-national government regulations that were inconsistent with national legislation were scrapped. If Indonesia is to make more progress in improving its business climate, sub-national governments need to streamline and harmonise their bureaucracy. There is enormous regional variation in these regulations, with some matching international best practice. The lagging regions should be encouraged to emulate the leaders.

The Survey makes recommendations to make further gains:

  • Reduce transaction taxes (including stamp duties, licensing fees and business registration) and the tax on the acquisition of land and buildings by imposing ceilings or replacing them with fixed fees;
  • Improve coordination and information sharing among government agencies, so that businesses are not obliged to notify each agency of having completed administrative tasks in another;
  • Step up monitoring of the implementation of national regulations across the country;
  • Speed up procedures at the land registry office; and
  • Make the business registry electronic.

indonesia-global-comp

References

OECD (2016), OECD Economic Surveys: Indonesia 2016, OECD Publishing, Paris, DOI: http://dx.doi.org/10.1787/eco_surveys-idn-2016-en.

World Bank (2016), Doing Business 2017: Equal Opportunity for All, Washington DC: World Bank, DOI: 10.1596/978-1-4648-0948-4.


The Best vs. the Rest: The Global Productivity Slowdown Hides an Increasing Performance Gap across Firms

By Dan Andrews (Senior Economist, Economics Department), Chiara Criscuolo (Senior Economist, Directorate for Science, Technology and Innovation) and Peter Gal (Economist, Economics Department)

Well-known global companies such as Google, Apple and Amazon of the digital era as well as more traditional ones of the likes of BMW, L’Oreal and Nestlé have recorded impressive productivity gains over the 2000s as they created more and more revenue per employee. At the same time, aggregate productivity growth in the OECD – that reflects the performance of all businesses not just the few most successful ones – has stagnated. What explains this discrepancy?

We reconcile the apparent success of a few firms with the poor performance of the economy as a whole. Our analysis based on several million company accounts indeed shows that very strong labour productivity performance of the best firms (the frontier) has been accompanied by a persisting large productivity gap between them and all the other businesses. Worryingly, this gap has been growing over time. This pattern also remains after accounting for differences in investments (in machinery, equipment and structures as well as R&D, data and software) and market power across frontier and non-frontier firms. This suggests that the productivity divergence may in fact be driven by a growing difference in innovation performance in a broad sense.

What could explain these patterns? Ongoing structural trends in the global economy – namely digitalisation, globalisation and the rising importance of tacit knowledge – likely have contributed to the rapid productivity gains at the global frontier. Indeed, multifactor productivity (MFP) divergence is strongest among information and communication (ICT) services (Figure 1). These are sectors where “winner-takes-all” dynamics are likely to be more relevant, given very low marginal costs. This makes upscaling a product or service much easier and cheaper, and combined with powerful network effects can lead to the most successful producer capturing the whole or the large part of the market. The examples of Google as the main search engine or Amazon as the largest online retailer illustrate this point.

winner-takes-all-prod

Yet, aggregate productivity performance was significantly weaker in sectors where divergence was more pronounced, suggesting that these patterns do not solely reflect frontier firms pushing the technological boundary. Instead, it could reflect a slowdown in the diffusion of best business practices from the frontier to other firms. One symptom of stalling diffusion is that it has become more difficult for laggard firms to join the frontier. More broadly, this phenomenon could be a reflection of increasing costs for laggard firms of moving from an economy based on production to one based on ideas.

This brings us to the role of incentives of the laggard firms to adopt best practices. A key concern is that market contestability has weakened, given the decline in firm entry and increasing share of firms surviving on the margins of exit. This highlights the potential for policy to boost growth by promoting market competition, especially in services which are generally more sheltered from international markets. This would also create better conditions for growth-enhancing reallocation through the entry of more productive businesses and the exit of less successful ones. In fact, we find the rise in productivity divergence between the best firms and the rest to be much more extreme in sectors where the pace of pro-competitive product market reforms was slowest (Figure 2). In sum, while structural changes in the global economy meant that technological diffusion became more difficult for the typical firm over the 2000s, these difficulties were compounded by policy weakness that needs to be remedied if aggregate productivity has to rise faster than in the recent past.

role-of-policy-prod

References

Andrews, D., C. Criscuolo and P. Gal (2016), ” The Best versus the Rest: The Global Productivity Slowdown, Divergence Across Firms And the Role of Public Policy”, OECD Productivity Working Papers, No. 5, OECD Publishing, Paris. DOI: http://dx.doi.org/10.1787/63629cc9-en


Inequality in Denmark through the looking glass

By Mikkel Hermansen, Structural Surveillance Division, OECD Economics Department

Although Denmark is one of the least unequal countries in the world, it has like many other OECD countries experienced a rise in income inequality. But by exactly how much has the Gini coefficient risen over the last decades? There is significant disagreement between various official sources (Figure 1): The Danish government and Statistics Denmark report a substantial increase, of 5.7 Gini points, since 1990, whereas the OECD figures only convey a rise of 3.1 Gini points (close to the OECD average; see OECD, 2015). And while national sources agree on the trend, they diverge on the level by almost 2 Gini points (26.2 for Danish government vs 27.9 for Statistics Denmark in 2013). While such measurement muddle may seem uninteresting, it emphasises how crucial methodological choices can be for inequality assessments. In this respect, Denmark is an interesting laboratory due to high-quality administrative data and almost full population coverage. In Causa et al. (2016) we therefore uncover the methodological differences behind the development illustrated in Figure 1.

gini-denmark

The differences between inequality trends reported by international and national sources are mainly due to differences in the treatment of:

  • Negative income elements: e.g. from indebted households paying interest expenses and from self-employed experiencing transitory income losses. Negative income elements are set to zero by the OECD to ensure cross-country comparability, which significantly raises the inequality level compared to the Danish government in the 1990s and early 2000s. One can think of individuals with high interest expenses, who typically also have high incomes from employment and therefore appear even more affluent from this adjustment.
  • Unmeasured housing services enjoyed by homeowners relative to tenants: to ensure comparability in living standards between homeowners and tenants it is possible to estimate the value of self-provided housing services and add this to homeowners’ income – the so-called imputed rents. National statistics include imputed rents, whereas they are excluded from OECD figures because of poor cross-country comparability. Along with the decline in interest rates from 2000 onwards and a house price boom in Denmark, imputed rents have driven up the Gini coefficient reported by national sources compared to the OECD.

Two other methodological differences mainly influence the reported level of inequality:

  • What defines a household? International standards define a household as a group of people living together, while the Danish institutions also impose that they have family ties and this tends to raise inequality because of more and smaller households.
  • How much economies of scale do people living together enjoy? A household of four can share many goods and do not need to spend four times as much on heating and electricity as a lone-person household. Material living standards of households of different sizes can be made comparable by use of an “equivalence scale” (for OECD figures calculated as the square root of household size). In the case of Denmark, the three institutions use three different scales.

Who is right about inequality in Denmark then? Well, that would depend on the purpose. For international comparisons one should obviously use OECD figures that comply with the same international statistical protocols and conventions. But from a national perspective, statistics produced by the government and Statistics Denmark are better tailored to the data source and can provide a more comprehensive picture.

References

Causa, O., M. Hermansen, N. Ruiz, C. Klein, and Z. Smidova (2016), “Inequality in Denmark through the Looking Glass”, OECD Economics Department Working Paper, No. 1341, OECD Publishing, Paris, http://dx.doi.org/10.1787/5jln041vm6tg-en.

Ministry of Economic Affairs and the Interior (2015), Familiernes økonomi: fordeling, fattigdom og incitamenter 2015 (Household Finances: Distribution, Poverty and Incentives 2015), Copenhagen.

OECD (2015), In It Together: Why Less Inequality Benefits All, OECD Publishing, http://dx.doi.org/10.1787/9789264235120-en.

Statistics Denmark (2016), Indkomster 2014 (Household Incomes 2014).


Weighing up the Growth Dividends from Structural Reforms

by Balázs Égert and Peter Gal, OECD Economics Department

In many OECD countries, economic growth has yet to recover the lost ground suffered in the aftermath of the financial crisis. In some of them, unemployment has been persistently high, investment rates disappoint, and productivity is extremely sluggish – a “low growth trap”. Put differently, all three sources of sustainable long-run growth under-perform. This jeopardizes societies’ ability “to make good on its promises to current and future generations – to create jobs and develop career paths for young people, to pay for health and pension commitments to old people”. (OECD, 2016). While this partly reflects the persistent weakness of demand in some cases (Mann, 2016), there are policy tools available that affect the long-run productive capacity of the economy, or potential growth. Our recent work takes a fresh view on the relative payoffs in terms of raising future growth (Égert and Gal, 2016). We study how various product and labour market policies and regulations affect per capita income growth over different horizons and through the three supply-side channels: multi-factor productivity (MFP), capital deepening and employment.

We find that product market regulation (PMR) reforms have the largest overall direct policy impact: reducing regulatory barriers to competition induce a cumulative increase of 0.7% of GDP per capita over a 5-year horizon. Other policies with considerable overall effects include increased spending on active labour market policies (ALMPs), a reduction in labour tax wedge, in the minimum wage or in the length of maternity leave with impacts ranging from 0.3% to 0.5%. Typical reforms in other policy areas tend to have a smaller impact on per capita income (Figure 1).

impact-reforms-on-gdp-egert1.

Different policies have different impacts on the separate supply-side components. For instance, PMR affects each of them, while labour market policies tend to impact only employment. Exceptions are ALMPs, which affects both productivity and employment, and EPL, which drives both capital deepening and employment. Finally, the corporate tax has an effect only on capital deepening, while R&D impacts only productivity (Figure 2).

The policy effects differ over longer horizons. For instance, the overall long-term effects on GDP per capita of PMR, employment protection (EPL) and ALMP spending are considerably larger than the 5-year impacts. This is mainly due the fact that MFP and capital are slower to react to reforms, compared to employment (Figure 1).

These results are based on past policy changes and assume that the impacts are uniform across countries and various institutional settings. But the estimation results shown in Figures 1 and 2 could be used as a starting point to provide precious help for policy makers for the elaboration of comprehensive structural reform packages. Depending on the ease with which reforms can be implemented, policies could be picked to reach policy objectives in terms of overall impact on per capita income. A natural follow-up to our paper would be to extend it to take into account country specificities and differences in the initial policy and institutional settings. Also, the enriched framework could be used to build an interactive policy simulator, which would help policy-makers to figure out the impact of planned reforms and to design comprehensive policy packages to achieve objectives such as a given increase in per capita income over a given horizon.

struc-ref1struc-reform-gal

Note: *Typically observed reforms are measured as the average improvements in the policy indicators over all two year windows that show improvements in both periods (see Table 5, column 4). The employment rate effects use all three aggregation approaches, and the size of the effects is indicated by numbers for the aggregation using demographic groups. See details in Egert and Gal (2016)
Source: Égert, B. and P. Gal (2016), “The quantification of structural reforms in OECD countries: a new framework”, OECD Economics Department Working Papers, No. 1354, OECD Publishing, Paris.

References

Égert, B. and P. Gal (2016), “The quantification of structural reforms in OECD countries: a new framework”, OECD Economics Department Working Papers, No. 1354, OECD Publishing, Paris.

Mann, C. L. (2016), “Deploy effective fiscal initiatives and promote inclusive trade policies to escape from the low-growth trap” ECOSCOPE, November 28.

OECD (2016), “Economic Outlook”, Vol 2016(1).


The Walking Dead: Zombie Firms Stifle Economic Recovery Prospects

By: Müge Adalet McGowan, Dan Andrews and Valentine Millot – Structural Policy Analysis Division, Economics Department, OECD.

With the global economy stuck in a low growth trap, it is crucial to understand the factors behind the weak recovery in potential output growth, and particularly the barriers to productivity growth. New research shows that this dynamic can be partly understood in terms of the increasing survival of zombie firms – i.e. those firms that would typically exit in a competitive market but are being kept alive by creditors or policy weakness. Today, a key risk is that zombie firms may depress creative destruction, crowd-out growth opportunities for healthy firms and underpin a period of macroeconomic stagnation, just as they did in Japan in the 1990s (Caballero et al., 2008).

In a number of countries, the prevalence and productive resources sunk in “zombie” firms – defined as old firms that have persistent problems meeting their interest payments – has risen since the mid-2000s (Figure). In Italy, for example, the share of the industry capital stock sunk in zombie firms rose from 7% to 19% between 2007 and 2013. This is problematic because zombie firms can congest markets and reduce industry profitability – by inflating wages relative to productivity and depressing market prices – which deters the expansion of healthier firms, especially recent entrants.

zoombie-walking-dead

Econometric analysis shows that when more industry capital is sunk in zombie firms, the typical non-zombie firm undertakes less investment than otherwise. But the story does not end there because zombie congestion disproportionately crowds-out the growth of more productive firms, thus slowing productivity-enhancing capital reallocation and aggregate multi-factor productivity (MFP) growth.

The rise of zombie congestion can be connected to the collapse in OECD potential output via two key channels: weaker business investment and MFP growth. For example, simulations show that had the zombie capital share not risen from its pre-crisis levels:

  • Investment of a typical non-zombie firm in Italy could have been around 6% higher in 2013. This can account for one-quarter of the actual decline in aggregate private non-residential business investment in Italy between 2008 and 2013.
  • Aggregate MFP could have been 0.7% to 1% higher in Italy and Spain respectively, owing to more efficient capital reallocation. This is significant given that in both countries, MFP subtracted significantly from potential growth over the past decade.

In some countries, these problems are likely to be symptomatic of weak insolvency regimes and a slowdown in the pace of product market reforms. But zombie firms may also be kept alive by bank forbearance and the persistence of crisis-induced SME support policy initiatives. While reforms in these areas may help revive productivity growth, it is crucial that they are flanked by well-designed active labour market policies, which have been shown to be effective at returning workers displaced by firm exit to work (see recent Ecoscope blog).

References

Adalet McGowan, M., D. Andrews and V. Millot (2017), “The Walking Dead? Zombie Firms and Productivity Performance in OECD Countries”, OECD Economics Department Working Paper No. 1372.

Caballero, R., T. Hoshi and A.K. Kashyap (2008), “Zombie Lending and Depressed Restructuring in Japan”, American Economic Review, 98(5), pp. 1943-1977.