The Narrow Path – The Italian View

by the Italian Ministry of Economy and Finance, Pier Carlo Padoan, Italy’s Minister of Finance, was OECD Deputy Secretary-General and Chief Economist from 2007-2014.

Growth in Italy is taking place more slowly than in other Eurozone countries. Public debate about this fact offers several explanations but rarely juxtaposes long-period trends with recent policies.

The narrow pathIt is common knowledge that – among other things – low productivity is one of the main causes of the poor performance of the Italian economy. Red tape, the relatively limited openness to competitiveness of some professional services, the tax burden, the limited size of SMEs, and the need to improve secondary education and the efficiency of the judicial system are – among other factors – affecting our ability to grow the economy.
All such structural obstacles to stronger growth are targets of the ambitious reform program that has been under way since 2014. In the view of national authorities, structural reforms are re-shaping the economic potential of the country, while the combination of expansionary monetary policy undertaken by the ECB and appropriate fiscal policies adopted by the Government is allowing for conditions that enable the reform process.  Let’s focus on what “appropriate” means for fiscal policy in Italy at the present time.

The Government believes that a fiscal adjustment is definitely needed for a country with a debt as high as Italy’s.  However, the decision about the pace of the adjustment is crucial as it may potentially affect the prospects of the economy, including the private sector.  While a slow pace of adjustment might not be effective for the purposes of debt reduction, an adjustment that is too fast may prove to be detrimental to the economy, and therefore to the debt-to-GDP ratio.

The situation in which the Italian authorities must move can be described as a “narrow path”: on one side, high debt looms (implying exposure to external financial shocks) while on the other side an infant recovery needs to be nurtured in order to rid ourselves definitively of the double–dip recession. This picture may help in understanding the Government’s search for a balance among such divergent needs. The search has apparently been successful in the latest four budgets. Since 2014 the Italian Government has managed to reduce the deficit-to-GDP ratio – and to stabilise the debt-to-GDP ratio by that means. At the same time, the composition of both revenue and spending has been re-arranged to improve the business environment and to support internal demand.

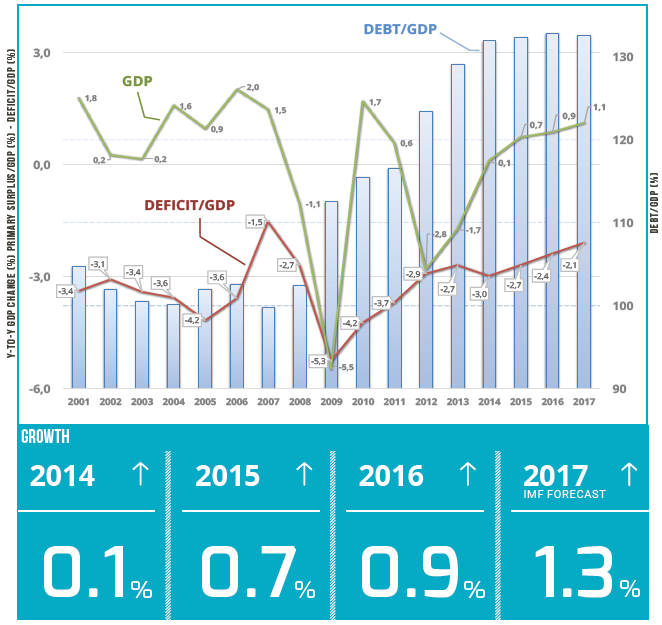
In order to appreciate the results of the “narrow path” policy mix, we must look at the trends for debt, deficit and GDP over a lengthy period of time. Between the years 2000 and 2013, the Italian economy alternated 4 years of recession, 4 years of positive but low growth (below 1 percent), 5 years of higher growth (between 1 and 2 percent). Nothing exciting at all. After the double–dip, growth turned positive again in 2014 (a small improvement of 0.1%), then it slowly increased in the following years (+0.7% in 2015 and +0.9% in 2016). For 2017, both the IMF and the Bank of Italy forecast better growth of 1.3%. Once again, a performance that nobody will consider at all satisfactory, but certainly it’s a reversal of previous uncertain trends.

Now when we look at the trend of the deficit we can see that such growth is not the result of an expanding budget. On the contrary, it is based on a sound primary surplus and a constantly contracting deficit (which is decreasing from 3.0% of GDP in 2014 to the expected 2.1% in 2017 – and even lower according to latest forecasts). Which will allow the debt-to-GDP ratio to stabilise notwithstanding very low inflation.

The comparison with other major economies in Europe since 2009 shows that Spain, France and the UK associate growth rates higher than Italy with a negative primary balance, whereas Italian governments have managed to keep the primary balance in positive territory since 1993 (with the single exception of the year of the deepest crisis, 2009). The other large country together with Italy that manages to combine positive primary balance and growth is Germany.

The road to recovering a higher growth potential is still long, but some of the reforms are beginning to bite. To mention some examples, the labour market is now more dynamic, thanks to the Jobs Act introduced early in 2015; cooperation between taxpayers and the tax administration is improving, as the principles of cooperative compliance and preventive assessment of tax planning are becoming common behaviour; the Italian customs rank #1 in the “Trading Across Borders” study (a component of the World Bank’s Doing Business project) due to extensive digitalisation.

The fiscal stance adopted for the last four budgets has contributed to alleviating the upfront costs associated with the introduction of reforms, and therefore to create favourable conditions for reforms to be accepted by all stakeholders. Currently, public investment in strategic infrastructure is rising, the tax burden on both families and business has been cut, and selective tax breaks have stimulated private investment in innovation.

At the same time, the stock of nonperforming loans is now declining. The NPLs have been a consequence of the crisis, but also contributed to its worsening, as they have limited the flow of lending from banks to the economy. The increase in lending to the real economy, along with new financial instruments introduced by the Government in recent years (for instance mini-bonds and individual savings plans focusing on SMEs) will sustain the recovery, which will reinforce the soundness of public finances.

The outlook is for an increase in the real growth rate combined with higher inflation, a continuing primary surplus and modest implicit debt (thanks to past pension reforms), all leading to a decline in public debt.

Further reading:

The Narrow Path | Issue #1 | July 2017 | www.mef.gov.it | Italian Ministry of Economy and Finance

Italy’s reforms are paying off but challenges remain | ecoscope – February 2017

OECD (2017), OECD Economic Surveys: Italy 2017, OECD Publishing, Paris


Statistical Insights: Purchasing Power Parities – not only about Big Macs

Stat-Insights-200_fw

by Pierre-Alain Pionnier, Head of CLIs, Prices & Environmental Accounts Section, Francette Koechlin, Head of Prices & PPPs Unit, and Sophie Bournot, Statistician for PPPs, OECD Statistics Directorate

All travellers know that the prices of goods and services vary between countries. In order to capture these price differences, Eurostat and the OECD collect data on the prices of identical goods and services in their member countries, and compile “Purchasing Power Parities” (PPPs) – conversion rates that neutralise price differences between countries. The collection spans hundreds of products and allows PPPs to be calculated for various classes of goods and services, and for macroeconomic aggregates such as gross domestic product (GDP). PPPs help economists and other users of statistics who want to compare GDP, income and consumption across economies with a proper adjustment for price differentials, in order to better assess the size of economies, productivity and material well-being.

Purchasing power parities (PPPs) compare the prices of similar products, expressed in different currencies

The Big Mac index from The Economist magazine is a well-known example of an international price comparison of a product with similar characteristics across countries. In its latest edition (January 2017), this price comparison shows for instance that the average price of a Big Mac is 5 dollars in the United States and 4 euros in France. So the “Big Mac PPP” between France and the US is the ratio of 4 euros to 5 dollars (or equivalently 0.8 euro to the dollar).

Price relatives vary from product to product, so many products must be sampled to construct PPPs for entire economies

Because price relatives vary from product to product, the OECD and Eurostat collect prices on around 2,500 products. This allows PPPs to be constructed for different groups of products, and to compare price levels, once the prices have been converted into a single currency. This is illustrated in Figure 1, showing how prices for different product groups differ across countries.

The top part of Figure 1 shows that the prices of durable goods (e.g., cars, TVs and computers) vary less between countries than the prices of services (e.g., housing, education and health). This is because durable goods are frequently traded across countries, which tends to equalise their price levels. On the other hand, services are often purchased locally and are less traded across countries, thus making it possible to have larger price differences across countries. The comparison shows that services tend to be more expensive in high-income countries (e.g., Switzerland) than in lower-income countries (e.g., Mexico). This is the so-called Balassa-Samuelson effect: the higher productivity in advanced countries for the production of tradeable goods leads to higher wages across all sectors in these countries. Since cross-country differences in services productivity are smaller than in tradable goods productivity, these higher wages lead to higher services prices in advanced countries.

The bottom part of Figure 1 shows that overall consumption prices tend to be higher in high-income countries, reflecting the large share of services in the consumption basket of households (typically around 70%). Furthermore, overall consumption prices and Big Mac prices show a similar pattern, although for some countries the difference between Big Mac prices and overall consumption prices can be quite significant. In Australia for instance, Big Mac prices are close to the OECD average whereas overall prices for household final consumption are nearly 40% higher.

STD

Using the Eurostat-OECD PPPs is the best way to compare macroeconomic aggregates across OECD countries: better than using exchange rates or PPPs based on single products

Perhaps the most intuitive way to compare macroeconomic aggregates across countries when they are expressed in different currencies is to use exchange rates. However, such comparisons do not account for the fact that prices are different across countries, even if expressed in the same currency. Making it possible to adequately adjust for price differentials is precisely the purpose of PPPs.

Figure 2 shows that conclusions derived from international comparisons of per-capita household final consumption, a useful indicator of material well-being, vary significantly depending on whether exchange rates or PPPs are used to convert consumption in national currency to a common unit. In 2014, the differences reached up to 70% for Norway, where average consumption prices were well above the OECD average (see Figure 1). The difference between measures based on PPPs and relative Big Mac prices is usually lower. Nevertheless, and consistently with Figure 1, measures based on relative Big Mac prices tend to overstate consumption per capita in high-income countries and to understate it in lower-income countries, as compared to measures based on PPPs which take into account the whole range of goods and services consumed by households.

STD PPPs

The measures explained

Household actual individual consumption (AIC) is the measure of household final consumption used in this article. It covers all goods and services actually consumed by households, including both consumer goods and services purchased directly by them (“household final consumption expenditure”), and services provided by government and non-profit institutions for free or at significantly reduced prices (e.g. health and education services). In a nutshell, AIC measures what households consume and not only what they directly pay for.

Purchasing Power Parities (PPPs) convert different currencies to a common currency and, in the process of conversion, equalise their purchasing power by eliminating the differences in price levels between countries. Thus, when GDP or consumption values are converted to a common currency with PPPs, they are valued at the same price level and so reflect only differences in the volumes of goods and services purchased in the countries. In their simplest form, PPPs are nothing more than price relatives that show the ratio of the prices in national currencies of the same good or service in different countries. For example, as mentioned in the text, if the price of a Big Mac is 4 Euros in France and 5 Dollars in the United States, then the PPP for Big Macs between France and the United States is the ratio of 4 Euros to 5 Dollars, or 0.8 Euro to the Dollar, meaning that for every Dollar spent on a Big Mac in the United States, 0.8 Euro would be spent in France to obtain the same burger. If the currency exchange rate is one Euro to the Dollar, it can be concluded that Big Macs are cheaper in France than in the United States. The OECD and Eurostat compile PPPs for large baskets of goods and services.

Note that the Eurostat-OECD PPPs are not suitable for gauging the under- or overvaluation of currencies since PPPs cover the whole range of goods and services produced or consumed in an economy, including many non-tradeable ones. Furthermore, currency exchange rates are also affected by capital movements.

Where to find the underlying data?

The OECD database on PPPs is available on OECD.STAT and includes the following datasets:
> Annual PPPs and exchange rates: this dataset contains annual PPPs for GDP, household actual individual consumption and final consumption expenditure, as well exchange rates for OECD countries and some non-member economies.
> 2014 PPP benchmark results: this dataset contains the detailed results of the latest (2014) Eurostat-OECD price comparison for the 47 countries that participated in the 2014 round of the Eurostat-OECD PPP Programme. Similar detailed results are also available for 2011, 2008 and 2005.

In addition, The Economist’s online database contains local Big Mac prices in up to 56 countries from 2000 to 2017.

Further reading

> Bournot S., Koechlin F., Schreyer P. (2011): 2008 Benchmark PPPs: Measurement and Uses. OECD Statistics Brief No. 17

> OECD/Eurostat (2012), Eurostat-OECD Methodological Manual on Purchasing Power Parities (2012 Edition), OECD Publishing, Paris

> The Economist (2017), The Big Mac index. January 12th 2017 edition

OECD Purchasing Power Parities (PPPs), data and methodology

The World Bank International Comparison Program (ICP)  http://icp.worldbank.org


Embracing digitalisation to boost Austria’s growth potential

by Rauf Gonenc and Volker Ziemann, Austria Desk, OECD Economics Department.

Digitalisation will redesign production processes and alter relationships between work and leisure, capital and labour, the rich and the poor, the skilled and the unskilled. It creates opportunities to boost inclusive growth and well-being by raising productivity, enhancing private and public services, and democratising information. However, digitalisation is inherently disruptive and raises concerns about a division of societies into winners and losers. Two questions arise for policy makers: how to ensure equality of opportunities in the race with technology and how to find the appropriate level of redistribution of the gains associated with digitalisation to preserve social cohesion.

Austria’s business sector is adapting to the global digital revolution, albeit at a slower pace than in the most advanced countries, especially among smaller firms (see Figure below). The adoption of information and communication technology applications by households is also uneven: while the young and highly educated swiftly follow global trends, older generations, individuals with lower education and immigrants lag behind. The authorities recognise the importance of helping people and firms to embrace digitalisation and have designed a “Digital Roadmap” around 12 guiding principles. Achieving the set objectives will require a transparent monitoring system with clear timelines and quantitative targets.

Austria graphic

The ability of firm owners to fully embrace digitalisation and renew their business models should be further enhanced through awareness-raising and skills initiatives. On another front, stronger incentives, including financial ones, may be needed to encourage households to adopt e-government solutions. More generally, raising awareness for benefits arising from digitalisation and addressing potential challenges including by fostering trust and consumer protection are key ingredients for a successful and inclusive transition to the digital economy.

Many occupations may be automated in the near future. Others will see their tasks radically transformed. Researchers at the OECD and elsewhere have identified skills and tasks that are less likely to be affected and more likely to be complementary to digital technological change, notably activities requiring creative and social intelligence. Compared to the most digitised countries, such tasks seem to be less prevalent in Austria. Therefore, Austria should further develop basic digital skills and raise awareness of digital gaps. A wide-ranging education reform addresses these challenges and ought to be implemented swiftly. Finally, life-long learning solutions need to be developed further to upgrade skills of middle-aged and older workers.

Find out more:

OECD (2017), OECD Economic Surveys: Austria 2017, OECD Publishing, Paris.


Growth is picking up in Austria but fundamentals need to be strengthened

by Rauf Gonenc and Volker Ziemann,  Austria Desk, OECD Economics Department

After several years of subdued growth, economic output accelerated in 2016 supported by a tax reform that entered into force in 2015-16, and more recently a pick-up in international trade. The upturn has improved fiscal balances, and the public debt ratio, though still high, is on a downward path. The improvement in the macroeconomic situation has strengthened business and household confidence and the short-term outlook is favourable.

Nonetheless, the OECD 2017 Economic Survey of Austria suggests that Austria may be adapting too slowly in a rapidly changing environment, including with respect to digitalisation. Austria’s strong position in regional value chains has suffered somewhat since 2012 amid intense competition with catching-up Eastern European countries notably in supplying traditional key partners such as Germany or Italy. On the other hand, Austria has managed to gain export market shares in countries like the United States, China, India or Japan which, together with vibrant tourism, has kept the current account in positive territory.

Austria’s labour force and employment have expanded strongly in recent years largely driven by migration from new EU member states and, especially in 2015, by refugee inflows (see Figure below). Pension reforms limiting pathways to early retirement have induced a strong increase in employment of older workers albeit from very low levels in international comparison. Labour participation of women has also improved, though mainly through part-time work reflecting prevailing gender-inequalities, which were analysed in detail in the OECD 2015 Economic Survey of Austria.

Austria 2017 macro

The resulting decline in average hours worked per person contributed to the decline in trend growth observed since the beginning of the 2000s, alongside the slowdown of both the capital stock and total factor productivity. While Austria shares these trends with most, if not all, other advanced OECD countries, some specific weaknesses emerge. Geographical mobility is low and the labour tax wedge remains high. OECD indicators further suggest that, despite some progress, retail and professional services are over-regulated. Enterprise churn rates are lower than in comparable countries which may be partly driven by restricted financing options. Austria has recently launched a crowd-financing initiative, but external financing of start-up and small firms remains overly reliant on bank credit and venture capital is scarce. The government’s January 2017 policy package will help reduce some of these bottlenecks provided that the political process surrounding the October 2017 snap elections does not undermine its implementation.

Find out more:

OECD (2015), OECD Economic Surveys: Austria 2015, OECD Publishing, Paris.

OECD (2017), OECD Economic Surveys: Austria 2017, OECD Publishing, Paris.


Boosting living standards of all Argentinians

By Jens Arnold and Alberto González Pandiella, Argentina Desk, OECD Economics Department.

Following years of unsustainable economic policies, Argentina has recently undertaken bold reforms and a turnaround in policies that has helped to avoid another crisis and stabilise the economy (OECD, 2017).  Nevetheless, the work is far from being finished. Many challenges still lie ahead. Argentina has lost substantial ground in terms of income (Figure 1) and poverty and inequality remain high. Significant macroeconomic imbalances have built up, such as a large fiscal defict, an inflation rate in the double digits or an unsustainable growth pattern investing too little for the future.

Argentina graphic 2017

Given the extent of remaining imbalances in the economy, a challenging reform agenda still lies ahead to deliver better material living standards for all Argentinians, as analysed in OECD’s Multi-Dimensional Economic Survey of Argentina. Building the pillars for a more productive and inclusive economy to improve the well-being of all Argentinians will be the priority for the future reform agenda. This agenda encompasses a wide range of policy areas such as regulation on product and labour markets, taxes, infrastructure, education, innovation, trade policy and financial markets, all of which could have large pay-offs. Aligning key policy settings with the OECD average could increase GDP per capita by 15% in 10 years (Figure 2).  But raising growth is not enough, what matters is that this delivers for people, by providing new opportunities. It is now critical that policymakers maintain reform momentum for businesses to thrive, and for people to reap the benefits. People-centred growth should be at the centre-stage of future policy efforts.

Argentina graphic2 2017

Argentina currently faces three main challenges.The first challenge is to ensure macroeconomic stability in order to avoid the recurrence of economic crisis. Crises have been too frequent in Argentina, and fiscal problems have almost always been at the root of these crises. Low income households are those affected the most by economic crises. Hence increasing stability, including by reducing the fiscal deficit and bringing down inflation, would help especially more disadvantaged households.

Argentina has one of lowest investment rates in Latin America and its productivity has hardly improved over the last 25 years. Hence, the second challenge is to boost investment and productivity, as these are the foundations for a sustained increase in incomes and living standards.  For that there is a need for wide-ranging structural reforms, encompassing areas such as competition, business regulations, trade, infrastructure, rule of law, or skills. At the same time, there is a need to safeguard those that may be initially impacted by a changing economy and ensure that benefits are widely shared. Hence, we recommend protecting workers with a stronger safety net and better training.

The third challenge is to make growth more inclusive. Inequality, poverty and informality are a drag on growth and well-being. To accelerate social progress, the emphasis is on improving education, in particular in reducing inequalities in the access to quality education. Argentina needs to improve teacher training and provide more targeted support to disadvantaged students. There is also a need to fight informality, which affects one third of the workforce, requiring an integral strategy including taxes, regulations, laws and education.

References

OECD (2017), OECD Economic Surveys: Argentina: Multi-dimensional Economic Survey, OECD Publishing, Paris.


Harnessing skills for more inclusive growth

by Jan Strasky, Luxembourg Desk, OECD Economics Department.

Strong economic performance, comfortable fiscal situation and well-run institutions make life good for most residents of Luxembourg. Average earnings are the highest in the OECD, while labour market insecurity and income inequality are low. Yet, the development of the digital economy is constantly expanding the domain of tasks that can be automatized and affecting both jobs and the skill sets need to perform them. The recent long-term strategy of the government develops an ambitious vision for a smart green digital society, but in order to equip workers with adequate skills, this modernisation strategy will also require improvements in education outcomes and better upskilling of workers over their lifetime (Figure 1).

Figure 1. Upskilling of the labour force is lagging behind the best performers

Lux graphic2 2017

The recently released OECD Economic Survey of Luxembourg 2017 argues that improvements in the education and training system should focus on lowering the high rate of grade repetition and improving the mobility between various education programmes. Grade repetition is internationally high and concentrated in vocational secondary education, often reflecting language handicaps. Although it is sometimes still regarded as an assurance of quality, the empirical evidence shows that grade repetition is costly and ineffective in raising educational outcomes. More productive strategies focus on providing early, regular and timely support during the school year and limiting repetition to subjects and modules failed.

Vocational education and training should equip young people with technical and professional skills that meet labour needs, but also open opportunities for further learning. Programmes imparting similar generic skills as in more academic upper secondary programmes, better linked to the other parts of the education system, would help closing the skills gap between graduates of academic and vocational tracks.

The world of work is changing fast and in ways that are difficult to anticipate. Flexibility in re-skilling and lifelong learning is likely to become key for successful careers in the future. In Luxembourg, like in many countries, those in employment and with better skills tend to profit most from lifelong learning. To improve participation in lifelong learning, providers should make more use of online and distance learning, along with part-time and modular courses. Individual learning accounts and expanded individual study leave could also enhance access to lifelong learning for low-skilled adults and employees from small firms.

Finally, to make better use of existing skills and to reduce the number of long-term unemployed, the disincentives to work should be reduced further. Inactivity traps are high, especially for part-time workers and low income earners, complicating increases in work effort and transitions from unemployment to employment. Furthermore, the system of joint taxation of spouses and registered partners discourages work of second earners, who are often women. Recent changes in policy, such as the introduction of optional individual taxation and the reform of the minimum income scheme, go in the right direction and should be complemented by further adjustments to the tax and benefit system, and pension system to reduce disincentives to work for low-skilled youth and older workers.

References

OECD (2017), OECD Economic Surveys: Luxembourg 2017, OECD Publishing, Paris.


Collective bargaining in Iceland: sharing the spoils without spoiling the shares

by Urban Sila, Iceland Desk, OECD Economics Department

Icelandic labour market is flexible with high labour market participation, low unemployment, and labour supply dynamically responds to the economic cycle. Iceland is the most highly unionised country in the OECD and wage bargaining is a cornerstone of the economy. Strong unions have contributed to very low inequality, high inclusiveness and gender balance. Successful social pacts have protected the lowest paid workers during crises, and on occasion helped fight inflation.

Paradoxically, however, the Icelandic bargaining model has been less successful in times of economic boom, and Iceland suffers from recurrent bursts of social tensions and labour unrest. During such periods trade unions approach collective rounds fragmented and with little regard for wider consequences of their demands. Wage demands by one union trigger topping-up demands by others, resulting in excessive awards. Recently, Iceland has again experienced a period of elevated tensions. In the 2015 bargaining round, doctors and teachers obtained three-year wage awards of around 25-30%, which led to demands by other unions for 50% pay increases. A bitter dispute erupted resulting in negotiated three-year nominal wage awards – that set the minimum over the settlement period – of more than 20% on average. Wages have been rising steeply ever since and together with króna appreciation, this has caused external competitiveness to plummet (Figure 1).

Iceland is a very small open economy prone to boom and bust cycles, and the pro-cyclical wage pressures add fuel to these harmful dynamics. The recently released OECD Economic Survey of Iceland 2017 argues for changes to the structure of collective bargaining to help sustain the benefits of the system for future generations.

Iceland2017blog

Labour negotiations often break down because parties differ in their view of the economy. They frequently disagree even on what exactly has been agreed in the past. Iceland has been through a challenging decade during which trust in politicians and among the social partners has been undermined. Trust and mutual respect can however be rebuilt by active and regular participation of the social partners in a tripartite macroeconomic council – to discuss issues of collective bargaining, welfare policy and social reform. Greater trust can also be fostered by setting up a “technical committee” that can provide impartial and accurate statistics on wages, economy, productivity and competitiveness to be used as a reference point in negotiations.

Wage coordination in Iceland is low. Labour unions tend to be very small and a large number of agreements need to be reached, creating the potential for co-ordination failure. Other countries ensure wage coordination for example by letting the sector that is exposed to foreign competition negotiate first, while other sectors follow (Nordic countries), or by linking wage increases to developments in neighbouring countries, to maintain competitiveness (Belgium). Recognising the Iceland specific context, the OECD Survey proposes that at the beginning of each negotiation round peak worker and employer organisations together issue “wage guidelines”, taking into account the information provided by the technical committee.

A strong role of the state mediator is needed, however, to underpin such a system. The Icelandic state mediator is relatively weak compared to other Nordic systems. The state mediator should be seen as a promotor and protector of the wage guidelines and when issuing conciliation proposals, they should be in line with the wage guidelines.


References

Holden, S. (2016), “A new model for wage formation in Iceland”, Report commissioned by the SALEK group, preliminary version, 9 August 2016, mimeo.

OECD (2017), OECD Economic Surveys: Iceland 2017, OECD Publishing, Paris.

OECD (2015), OECD Economic Surveys: Iceland 2015, OECD Publishing, Paris.


New Zealand has recently enjoyed strong economic growth, but housing and population ageing pose challenges

by David Carey, New Zealand Desk, OECD Economics Department.

New Zealand enjoyed strong economic growth during 2016, driven by high net inward migration, solid construction activity, booming tourism and supportive monetary policy, although in per capita terms growth has been more in line with that in other advanced economies. The terms of trade have rebounded to near record levels, boosting income growth. Growth eased somewhat during the last quarter of 2016 and the first quarter of 2017, in part due to temporary factors including the impact of unfavourable weather conditions on agricultural output and disruption from the November 2016 Kaikōura earthquake. The OECD projects that growth will return to around 3% in 2017‑18, supported by export growth from strong tourism demand and increases in dairy exports. However, slower net immigration is likely to curtail both consumption and residential construction, and the wind-down in the Canterbury earthquake rebuild will curb construction expenditure, more than offsetting the boost from the Kaikōura rebuild and the recently announced increases in infrastructure spending. The unemployment rate is expected to edge down to 4 ½ per cent by the end of 2018 and wage growth to rise moderately. Consumer price inflation should rise sustainably to 2% by the end of 2018, as the effects of oil price falls pass and capacity constraints bite.

While appropriate on the basis of the Reserve Bank of New Zealand’s inflation projections, current monetary policy settings have the downside of fuelling increases in house prices and household debt. As discussed in the accompanying housing blog, both have reached high levels by historical standards and in comparison with most other countries. Further progress is needed to reduce housing supply restrictions, and macro-prudential policy may need to be tightened further, notably by the implementation of debt-to-income limits to reduce financial stability risks.

The government’s prudent approach to fiscal policy puts New Zealand in good stead to cope with future global shocks and natural disasters. Like other countries, New Zealand also faces large spending pressures from public pensions and health-care costs in the longer term. To this end, the government has announced its intention to increase the age of eligibility for the public pension by six months each year from 2037, reaching 67 by 2040. Budget savings would be larger and inter-generational equity greater if this increase were to be brought forward, the transition period lengthened and the pension age subsequently indexed to life expectancy. The planned focus on increasing public-sector productivity should help to contain long-term increases in health-care outlays.

NZmacroblog

References
OECD (2017), OECD Economic Surveys: New Zealand, OECD Publishing, Paris.


Lifting New Zealand’s game on productivity

by Andrew Barker, New Zealand Desk, OECD Economics Department

Productivity growth will be the main driver of global economic growth and prosperity over the coming decades. For New Zealand, this represents both a challenge and an opportunity, as NZ productivity is below that of leading OECD countries (Figure 1). This problem is not new, and previous OECD work has shown that distance from markets is a substantial part of the explanation. The key question, considered in the 2017 OECD Economic Survey of New Zealand, is what can be done to improve generally sound policy settings in New Zealand so as to boost productivity, in spite of the economic challenges posed by its remote location.


NZ prod 1

Overcoming distance barriers means that New Zealand needs to do everything possible to increase benefits from international connections. As a small country, it is reliant on foreign direct investment to provide access to global supply chains and markets, promote local competition and drive technological, skills and managerial quality transfers. New Zealand’s comprehensive foreign investment screening regime should be narrowed, while reducing compliance costs and increasing predictability for investors. Although New Zealand has few other barriers to trade, there would be benefits from cutting remaining tariffs, strengthening trade facilitation measures and improving recognition of foreign licenses to practice. Digitalisation offers increasing opportunities for trade that is not affected by distance, heightening the importance of continuing efforts to modernise information technology infrastructure.

Facilitating international connections would also deliver benefits through increased competitive pressures, which can improve productivity through resource reallocation to the most productive firms, greater diffusion of existing technologies to laggards and increased incentives for innovation. Competition could also be improved by giving the Commerce Commission the power and resources to undertake market studies and through improving the efficiency of the insolvency regime.

Another key factor in New Zealand’s poor productivity performance is a low rate of capital investment. Options to address low investment include decreasing the high effective corporate tax rate through lowering the statutory rate, and increasing national saving through reducing taxation of non-housing saving vehicles. Reforms to urban planning and infrastructure funding arrangements will be important to address the drag on productivity from inflated house prices.

Finally, innovation is a key driver of productivity growth. Government support for R&D is low in New Zealand, and there is a low level of collaboration between firms and higher education and research institutions (Figure 2). Fiscal support for R&D should be increased, firm-level caps on R&D grants need to be removed, and support for successful collaboration between research institutions and industry should be maintained or increased.

NZ prod 2

References

OECD (2017), OECD Economic Surveys: New Zealand, OECD Publishing, Paris.


The downsides of New Zealand’s inflated house prices

by David Carey and Andrew Barker, New Zealand Desk, OECD Economics Department

In real terms, house prices in New Zealand increased more than in any other OECD country between 2010 and 2016 (Figure 1). While house price increases have supported economic growth through wealth-induced consumption growth, they have also created a number of social and economic problems. Housing affordability has been undermined, particularly for those with low incomes: housing costs for the bottom fifth of households reached 54% of income in 2015, up from under 30% in 1990. Driven by mortgage growth, the ratio of household debt to disposable income now exceeds the level recorded prior to the global financial crisis and is high compared with other OECD countries (Figure 2). This raises financial stability risks. House price increases also undermine productivity growth by inhibiting people from moving into economically successful, highly productive urban areas.


NZ housing 1

NZ housing 2

Price increases have been most pronounced in Auckland. Around half of all new migrants settle in Auckland, exceeding its (one third) share of the national population. Since 2008, new housing construction in Auckland has failed to keep pace with population growth. Prices in the rest of New Zealand, on the other hand, have risen despite little or no increase in the population-to-dwelling ratio. Throughout the country, record low interest rates have magnified house price increases.

The long-term solution, for Auckland in particular, is to address supply constraints. The recent Auckland Unitary Plan will allow greater densification and some expansion of urban development limits. However, insufficient infrastructure has constrained the extent to which densification is possible in central parts of Auckland. As in other parts of the country, infrastructure provision is primarily the responsibility of local governments, which face financial constraints and weak incentives to invest in amenities to facilitate growth. Options to broaden funding sources for public infrastructure should be explored, including more user charging, targeted property taxes, more cost-reflective developer contributions, sharing in a tax base linked to local economic activity and further recourse to alternative delivery models such as public-private partnerships. Reforms to the urban planning system are also needed – recommendations from the OECD’s Environmental Performance Review and the Productivity Commission’s Inquiry into Land Use Planning should be considered in order to deliver a more responsive and efficient planning system.

Relieving supply constraints takes time, however, so demand-side measures are also important to address financial stability risks. The Reserve Bank has progressively tightened restrictions on loan-to-value ratios, constraining the maximum amount that banks can lend to most customers. House price increases have moderated since the last round of tightening in October 2016. Debt-to-income restrictions, which complement loan-to-value ratios by limiting further debt as house prices increase relative to incomes, may be necessary if house price increases resume, and should be added to the Reserve Bank’s toolkit following analysis demonstrating that benefits would outweigh costs.

References

OECD (2017), OECD Economic Surveys: New Zealand, OECD Publishing, Paris.

OECD (2017), Environmental Performance Review: New Zealand, OECD Publishing, Paris.

NZPC (2017), Better Urban Planning, Inquiry Report, Wellington.