Retraining can enable ageing Slovenians to keep pace with new technologies

by Rory O’Farrell, Slovenia Desk, OECD Economics Department

While workers in many OECD countries are worried whether robots will take their jobs, the inhabitants of the Slovenian town of Kočevje are less concerned. In 2016 Japanese robotics firm, Yaskawa, announced plans to produce robots in Kočevje, which could create up to 200 jobs. This is a continuation of a pattern seen since independence whereby Slovenia has continued to shift from traditional manufacturing to business services and high-tech production. However, not all Slovenians have been included in this progress.

Modernisation has mainly been achieved by training young Slovenians to fill new occupations. In contrast, those with obsolete skills tend to retire or become unemployed rather than retrain, leaving Slovenia with persistent long-term unemployment, and amongst the lowest employment rates of older workers in the OECD. An ageing population means this is no longer sustainable, and labour shortages are already emerging. To meet the need for skills that complement investment in knowledge-based capital, and the new technologies brought by foreign firms, more responsive education and training solutions are needed.

Slovenia

Slovenia performs poorly in terms of providing workers the opportunity to retrain later in life. While it has an effective system of vocational education, workers lack some basic skills that enable them to retrain later in life. Also, although tertiary attainment has increased rapidly, high fees for part-time students make it unattractive for older Slovenians to pursue tertiary education. There is also a lack of incentives to retrain, as wages rise automatically with age and thus do not reflect the relative demand for different occupations, and unemployment and disability insurance have served as pathways to early retirement.

The just-released OECD Economic Survey of  Slovenia outlines how a more flexible education and training system can help create a more flexible labour market. Policies such as greater problem-based learning for vocational students, more adult training, and equalising fees for part-time and full-time students can help workers adapt to future changes in the labour market. This can help ensure all Slovenians benefit from future economic growth.

Find out more:

OECD (2017), OECD Economic Surveys: Slovenia 2017, OECD Publishing, Paris.


Mitigating the negative economic impact of Brexit

by Rafal Kierzendowski, Mark Baker, Pierre Beynet and Gabor Fulop, UK Desk, OECD Economics Department

Ahead of the referendum on Brexit, the OECD had been anticipating a significant decrease in economic growth if the decision to leave the EU were taken (Kierzenkowski et al., 2016). As the UK economy has started to slow down, OECD simulations remain remarkably valid so far (Figure 1).

UK

British growth was ahead of G7 economies one year ago, but has now fallen behind as other advanced economies have continued to recover (Figure 2). The recent OECD economic survey on the UK (OECD, 2017) analyses which channels Brexit prospects are currently hurting the economy and what could be done to mitigate this impact.

Fig2UKlaunch

The sterling’s depreciation has been a major drag on growth. It has pushed consumer prices up and hurt household consumption by reducing purchasing power. As real incomes have fallen, households have for a while supported their consumption by reducing their savings. However, the saving ratio increased in the second quarter and consumer credit growth may have peaked. Car registrations are subdued since April.

The sterling’s depreciation has also cut corporate margins of domestic producers, reducing the ability of non-exporting firms to finance investment. In addition, business investment growth has weakened as economic policy uncertainty is high. Weak demand should also negatively weigh on investment of domestically-oriented firms: this is the second-highest risk cited by around half of businesses, with the effects of Brexit being the top risk for nearly 60% of them (Deloitte, 2017).

The depreciation of the pound should support export-oriented firms, but this might not be sufficient to offset the negative factors mentioned above. History indicates that British exports have had a low responsiveness to exchange rate movements and the UK’s export performance has been in fact falling over the last two decades (Figure 3). This could be due to increased participation in global value chains, implying a high import content in exports, reducing scope for exporters to win market share following currency depreciation. Moreover, exporters who rely less on imports tend to increase their margins following a depreciation, preventing them from gaining market shares.

Fig3UKlaunch

Immigration has enhanced living standards by expanding the labour market and by having a positive impact on labour productivity. Following the EU membership referendum in mid-2016, there has been an important fall in net migration, mainly of EU citizens, explained by increased emigration and reduced immigration (Figure 4). Declines in net migration could tighten the labour market if labour supply falls faster than labour demand. It will significantly reduce growth eventually.

Fig4UKlaunch

In this context, the recent OECD economic survey recommends that the UK authorities secure the closest possible economic relationship with the European Union in its future trading arrangement. Rapidly concluding negotiations to guarantee the rights of EU citizens is a priority to sustain labour supply and ensure further progress in living standards. The United Kingdom should adopt simple criteria to deal with EU citizens living and/or working in the United Kingdom, which would minimise administrative burdens and avoid that some categories of EU citizens fall into the cracks, such as cross-border workers. The government should also identify in advance productivity-enhancing fiscal initiatives on investment that can be implemented swiftly should growth weaken significantly ahead of Brexit. A detailed evaluation of polices to offset the possible loss of European structural funds to poorer UK regions will also be necessary to avoid exacerbating existing regional economic disparities.

Bibliography

Deloitte (2017), Deloitte CFO Survey: 2017 Q2, July.

Kierzenkowski, R., et al.  (2016), “The Economic Consequences of Brexit: A Taxing Decision“, OECD Economic Policy Papers, No. 16, OECD Publishing, Paris.
http://dx.doi.org/10.1787/5jm0lsvdkf6k-en

OECD (2017), OECD Economic Surveys: United Kingdom 2017, OECD Publishing, Paris. http://dx.doi.org/10.1787/eco_surveys-gbr-2017-en


Statistical Insights: What does household debt say about financial resilience?

Stat-Insights-200_fw


by Isabelle Ynesta, Financial Statistics Statistician and Matthew De Queljoe, Statistician, OECD Statistics Directorate

Household debt levels increased rapidly in many economies in the run-up to the 2007-2008 financial crisis, fuelled in part by easy credit and rising property prices. Ratios of debt to annual income – used by lenders to determine households’ repayment capacity – then reached record highs across OECD countries. These debt levels have since continued to rise in most OECD countries, albeit at a much slower pace, both in real terms and as a multiple of annual disposable income. What does this say about households’ financial resilience?

Household indebtedness ratios have trended up since 2000, but the rise has slowed considerably since 2007 in most OECD countries 

Household indebtedness ratios have been trending up since 2000 in nearly all OECD countries, with the notable exceptions of Japan and Germany. Most of the accumulation of debt occurred in the run‑up to the financial crisis, in the period 2000-2007, when households increased their borrowings in response to greater access to credit and increasing house prices, most spectacularly in Ireland where indebtedness went from 111% of annual disposal income in 2001 to 234% in 2007 (figure 1). Following the crisis, the increase in indebtedness slowed considerably in many OECD countries, and even reversed in some of them, as households redeemed their debt and limited new borrowings. The sharpest falls were in Ireland (down 56 percentage points from 2007), Latvia (down 34 percentage points), Spain (down 33 percentage points), Denmark (down 32 percentage points), and the United States (down 31 percentage points).

StatI1Sept2017

Loans, predominantly mortgage loans, make up the largest component of household debt. When real estate prices increase, households must borrow larger amounts to buy a house. Existing homeowners may also feel richer and borrow against their increased collateral to fund spending on consumer goods and services (Statistical Insights: Blowing bubbles? Developments in house prices). Both phenomena were observed in countries where housing bubbles occurred, and contributed to increasing household debt levels in countries such as Denmark, the Netherlands, Spain, the United States, and the United Kingdom.

On the other hand, Japan and Germany did not experience housing booms and their household debt levels fell over the period 2000-2015. Japanese households tended to accumulate large down‑payments before borrowing to buy a house, and existing owners did not extract equity from their houses by increasing their mortgages. In Germany, a key factor is a low home ownership rate relative to other OECD countries.

Household indebtedness ratios can vary widely across countries

Figure 1 also shows that Danish households had the highest indebtedness ratio in 2015 at 293% of annual disposable income, followed by the Netherlands at 276%, whereas Hungary had the lowest at 51% (figure 1). These ratios, however, may not be the best measure of households’ financial resilience, which must also take account of factors such as the level of interest rates, whether mortgages are at fixed or floating rates, and whether tax breaks apply to mortgage interest. In the Netherlands, for example, households can deduct interest paid on mortgage loans from their taxable income, which may partly explain why Dutch mortgages are among the highest in Europe in relation to the value of the underlying collateral.

But to better understand households’ financial resilience assets matter too

To gain a better understanding of households’ vulnerability to economic shocks – such as becoming unemployed – one should also look at the assets they have available to pay down debt. Clearly, having a low debt-to-assets ratio will increase households’ resilience to shocks. However, the assets side of the ratio can be significantly affected by how pension systems work in various countries. Where future pension liabilities are already funded, this will increase households’ assets. This is the case in the Netherlands and Australia, where funded pension schemes are well developed, and pension assets represented 60% and 56%, respectively, of households’ total financial assets in 2015. At the other end of the spectrum, Belgian households’ pension assets only accounted for 6.5% of their total financial assets, since most pensions are funded on a pay-as-you-go system.

Household debt-to-assets ratios rose after 2000 in most OECD countries,
but the picture is mixed since 2007

StatISept2017

The debt-to-assets ratio in 2015 for Denmark, the Netherlands and the United States, countries that experienced a housing bubble, was more or less the same as in 2000 and around 5 percentage points less than in 2007. On the other hand, the debt-to-assets ratio increased considerably between 2000 and 2015 in the Slovak Republic, Greece and Estonia, although from a low base. In the Slovak Republic, the easing of credit restrictions, and the launching of mortgage banking in 2000, made loans more readily available. Since 2007 the debt-to-assets ratio has continued to increase in the Slovak Republic and Greece whereas it fell in Estonia. Household financial resilience depends on the distribution of assets, liabilities and income and the institutional factors prevailing in each country, but in general, debt-to-assets ratios that are trending up indicate that households are becoming less resilient to shocks.

A final remark concerns the distribution of assets and debt. While a country’s average numbers may look comforting, the distribution of assets and debt could be skewed, making certain groups in society very vulnerable to various types of economic shock. The OECD therefore invests considerable effort in obtaining information broken down by various household groups. Preliminary results of this work can be found in “Measuring inequality in income and consumption in a national accounts framework, OECD Statistics Brief, November 2014 – No. 19″ and “Household wealth inequality across OECD countries: new OECD evidence, OECD Statistics Brief, June 2015 – No. 21″.

The measures explained

Household net disposable income: Total annual income received by households after deducting taxes on income and wealth and social contributions, and including monetary social benefits (such as unemployment benefits). This measure thus represents the amount left at the disposal of households for either consumption or saving. It is called “net” because amounts needed to replace capital assets (dwellings and equipment of unincorporated enterprises) are already deducted.

Household indebtedness ratio: Households’ total outstanding debt divided by their annual net disposable income. The debt of households largely consists of loans, primarily home mortgage loans, but also other types of liabilities such as consumer debt (e.g., credit cards, automobile loans).

An indebtedness ratio above (below) 100 percent indicates that the household debt outstanding is larger (smaller) than the annual flow of net disposable income.

Household debt-to-total-assets ratio: Households’ total outstanding debt divided by their total assets. The total assets of households consist of both financial assets (saving deposits, shares and other equity, pension entitlements etc.) and non-financial assets (predominantly residential real estate including both dwellings and land, though due to data limitations, only the value of dwellings is included in the figures shown here).

The higher (lower) the debt-to-total-assets ratio, the higher (lower) is the level of households’ leverage, and the weaker (stronger) is their financial position.

Where to find the underlying data?

  • Financial Dashboard: this dataset contains data on households’ financial wealth and on households’ debt
  • Household Dashboard includes indicators related to the household sector published on a quarterly frequency

Household annual and quarterly financial accounts and financial balance sheet data can be found at:

Annual data

Quarterly data

Further reading


Contact: for further information, please contact the OECD Statistics Directorate at stat.contact@oecd.org.


Improving life in France’s poor neighbourhoods

by Nicola Brandt, France Desk, Country Studies Branch, OECD Economics Department

While overall poverty is relatively low in France, it can be highly concentrated at the neighbourhood level. In some cases the income of up to 40% of households in such neighbourhoods falls short of the relative poverty line. Unemployment is high, many children struggle in school, housing and urban infrastructure is run down, and there is a lack of local employers, public and private services, and amenities. The French government targets education, employment, business and safety measures specifically at these areas. There are also dedicated policies to promote social mixing: municipalities in areas with tensions on the housing market have to reach a social housing share of at least 25% or face fines. A large-scale urban renovation programme aims to attract the middle class to poor neighbourhoods and re-locate some of their inhabitants in wealthier areas when dilapidated social housing estates are demolished and smaller units with a mix of tenures are built on their sites. Such policies are based on the idea that there can be neighbourhood effects, whereby a high concentration of poverty would reinforce and reproduce economic and social disadvantage. Indeed, in the United States children who moved away from neighbourhoods with a high concentration of poverty have been found to attain higher levels of education and earnings than their peers who stayed behind (Chetty et al., 2016; Chetty and Hendren, 2015).

While these results do not necessarily carry over to the French context, as poverty overall is much lower than in the United States and the social safety net is stronger, there is clear evidence that social disadvantage is reinforced for inhabitants of France’s poor neighbourhoods. Their unemployment risk can almost double compared to individuals with comparable characteristics who live in wealthier neighbourhoods (Figure 1). Studies show that this is partly due to discrimination – chances to be invited to an interview simply fall when a CV features a foreign-sounding name or an address in a poor area (Bunel et al., 2016; Petit et al., 2016). Another issue is that many poor neighbourhoods are remote and poorly connected to transport infrastructure and services. This is particularly true at unusual hours, which are more common among low-qualified workers. At the same time they are less likely to have a driver’s license or own a car. The recently released OECD Economic Survey of France concludes that active policies are needed to fight discrimination. This can include awareness campaigns for recruiters as well as mentoring and coaching for candidates to put them into direct contact with employers, which has proven to work well for university graduates.

Franceneighbourhoods1

The urban renovation programme has improved infrastructure, and many inhabitants are satisfied with the results, but the impact on social mixing is more questionable. Echoing the experience from other countries many inhabitants have been relocated to other high-poverty neighbourhoods. Moreover, mixing tenures is no guarantee for more social interaction (Posthumus et al., 2013; Lelévrier, 2013a and b). As the government plans to extend the programme the Economic Survey recommends to better integrate it with employment and social policies. Consultation with inhabitants about the planned projects should be used as an entry point to offer basic skills and language training. Renovation works themselves would be an opportunity to offer apprenticeship-style training for building sector jobs. Indeed, consultation needs to improve, and citizen councils introduced in 2014 to help to draft strategy documents for the economic and social development of poor neighbourhoods are a first step in that direction. Strong resident participation in designing and implementing renovation projects has been successfully practiced in Germany (Blanc, 2010), where self-directed rehabilitation is a common model, and more recently the United States (Kirszbaum, 2013), where residents of demolished sites now have a right to return.

France has run priority education programmes to devote more resources to schools with many disadvantaged pupils for more than 30 years, but the impact of socio-economic background on learning outcomes is still among the highest in the OECD (Figure 2). The OECD Economic Survey of France argues the introduction of various measures to enhance individualised support for struggling students has suffered from a lack of high-quality initial and continuing pedagogical training for teachers to ensure effective implementation. More has to be done to offer attractive pay and career prospects for teaching in schools with many disadvantaged children to attract and retain excellent teachers. While the premium for teaching in priority education schools has recently been lifted, it remains too low to stabilise teaching teams, and, until recently, some advantages for teachers in those schools actually helped them to leave faster, creating perverse incentives.

France2neighbourhoods1

Presentation: What policies for poor neighbourhoods?

quartiers defavorises

This discussion will be introduced by the author on  Friday 13 October at 9h30 at the Université Paris-Est Marne-la-Vallée.  A round table discussion will follow the presentation. The event is open to the public, for more information: http://www.tepp.eu/conferences/ contacts : samir.mellal@u-pem.fr‌

Bibliography

Blanc, M. (2013), “La gouvernance participative et la rénovation urbaine en Allemagne et en France”, 6èmes Rencontres du Réseau transfrontalier ’Participation Grand Est’, Strasbourg.

Bunel, M., Y. L’Horty and P. Petit (2016), “Discrimination based on place of residence and access to employment”, Urban Studies, Vol. 53, No. 2, pp. 267-86.

Chetty, R. and N. Hendren (2015), “The impacts of neighborhoods on intergenerational mobility: childhood exposure effects and county-level estimates”, https://scholar.harvard.edu/files/hendren/files/nbhds_paper.pdf.

Chetty, R., N. Hendren and L. Katz (2016), “The Effects of Exposure to Better Neighborhoods on Children: New Evidence from the Moving to Opportunity Experiment”, American Economic Review, Vol. 106, No. 4, pp. 855-902, April.

Kirszbaum, T. (2013), “Rénovation urbaine et équité sociale: Choice Neighborhoods aux Etats- Unis”, [Rapport de recherche] ISP; CNRS; Commissariat général à la stratégie et à la prospective; secretariat général du Comité interministériel des villes.

Lelévrier, C. (2013a), “La mixité dans la rénovation urbaine : dispersion ou re-concentration”, CAIRN Info, Paris.

Lelévrier, C. (2013b), “Social mix neighbourhood policies and social interaction: The experience of newcomers in three new renewal developments in France”, Cities, Vol. 35, pp. 409-16.

Petit, P., M. Bunel, E. Ene and Y. L’Horty (2016), “Effets de quartier, effet de département ; discrimination liée au lieu de résidence et accès à l’emploi”, Revue Économique, Vol. 67, pp. 525-50.

Posthumus, H., G. Bolt and R.Van Kempen (2013), “Why do displaced residents move to socioeconomically disadvantaged neighbourhoods?”, Housing Studies, Vol. 28, No. 2, pp. 272-93.


Italy’s justice system has quite a long road ahead but already scores better – The Italian View

by the Italian Ministry of Economy and Finance – Pier Carlo Padoan, Italy’s Minister of Finance, was OECD Deputy Secretary-General and Chief Economist from 2009-2014).

Italy’s justice system is gaining greater efficiency, thus gradually closing its paradoxical gap. On the one hand, the clearance rate (measured as the ratio of the number of resolved cases to the number of incoming cases) is 120% and Italy ranks second in the European Union after Slovakia. On the other hand, Italy ranks last for the average length of civil or commercial proceedings, because of the huge backlog that weighs on courts and slows down the wheels of justice. Disposition time decreased by 13% in two years, but it still is as high as 527 days compared with a European average of 248 days. In 60% of Italian courts 1 out of 5 cases has been pending for more than 3 years, thus exceeding the “reasonable time” envisaged in the Pinto law of 2001. As priority will be given to recent cases, disposition time in courts that have a bigger backlog will lengthen. The longer a legal case remains unsettled, the longer the court will take to reach final disposition. The total backlog of civil cases has decreased by 4% from 2015 to 2016 and by a significant 34% from 2009. Nonetheless, the total civil and commercial litigious cases backlog was still as high as 4,400 cases pending (1st instance/ per 100,000 inhabitants) in 2005, 2.6 times higher than the EU average. Court performance varies geographically. Sicilian courts have a backlog of cases 50% of which have been pending for more than three years and less than 10 or 15% of which have been pending for more than three years.

With €4.8 bn of public expenditure, Italy is still the third biggest spender in the EU after Germany (€9.6 bn ) and the UK (€6.6 bn). Despite the crisis, total expenditure increased by 4.2% a year from 2006 to 2016. Better performances are not just a matter of increasing staff levels. Evidence published by the CSM (Consiglio Superiore della Magistratura – the High Council of the Judiciary) shows no correlation between staff shortages and poor performance, at least in conditions of relative and temporary lack of resources. With 1,75 million new legal cases per year, litigation rates in Italy are now in line with the EU average.

Efficiency gains have been achieved thanks to the far-reaching reorganization of the Italian judicial system and the adoption of new best practices in case management. First, e-filing has continued since its introduction in 2014. E-filing of notices increased by 6.7% over 2016, increasing savings by 10% and speeding up the issuing of digital payment orders by over 50% in some districts. E- filing by lawyers and professionals increased by 12% last year (after a first +88% in 2014/15), increasing the average e-files stock by 50% over the last three years.

Alternative dispute resolutions (ADR) contributes to unburdening courts in terms of dispute settlements. ADR includes referral to arbitration, negotiation assisted by a legal counsel (outof- court settlement procedure) and civil mediation. On average around 186,000 civil mediation processes have been initiated each year since 2014. The last two years have seen an increase in filings, followed by more than 30% increase in the number of judgments pending. This has slowed down resolution time from 83 days in 2013 to 115 days in 2015, which remains considerably shorter than that of in-courts settlements; however, a further increase, would affect the effectiveness of the process. The most evident reduction has been observed in commercial litigation, whose disposition time decreased from 40 to 29 months. Figures show that the older and more complex cases are now being settled, thereby contributing to rendering the justice system fairer. Specialization also helps in better managing the workflow. Since their introduction in 22 provinces in 2012, business courts have performed well. They deal exclusively with cases involving industrial property, company law, public contracts and services and European Union public work contracts. The number of resolved cases increased from an initial 404 to over 5,600 at the end of 2016. The increase in registrations raised resolution time: in 2016 the percentage of disputes which took less than a year to be resolved fell to 57% from 74% in 2014. Predictable outcomes and the number of confirmed rulings remain high, which reflect the quality of pronouncements and the effectiveness of judges and prosecutors’ specialization. In Milan verdicts are confirmed in 70-80% of cases.

Alternative dispute resolution is accompanied by measures to discourage initiation of proceedings when unneeded (i.e. no more free appeal proceedings before Justices of the Peace after administrative sanctions have been imposed) and the introduction of a formula to determine attorney fees (together with the possibility of requesting quotes). These rules contributed to decrease the demand for judicial services (civil and commercial cases), from 4 to 2.5 (1st instance/ per 100 inhabitants) between 2010 and 2015. However, the drop may also be ascribed to the economic crisis (a low GDP means fewer filings).

There is a positive correlation between economic growth and a healthy, efficient, fair judicial system. This is an even more important aspect especially during an upswing such as the one Italy is now experiencing. Lengthy proceedings and high enforcement create a climate of uncertainty and skepticism which affects the business environment and keeps investors away from opportunities. Given the same infrastructure and initial business conditions, evidence has shown that differences in the efficiency of judicial systems at provincial level can determine a difference in turnover of €31 K – or 8% of turnover – for an average Italian medium-sized company. A few years ago ECB President Mario Draghi stated that the cost of Italy’s slow judicial system accounts for over 1% of GDP. Gains in efficiency remain a top priority for the Government, which keeps working on reforms to speed up digitalisation and increase the overall effectiveness of the justice system.

Italian View


Boosting economic opportunities and wellbeing in Latvia: why housing matters

by Andrés Fuentes Hutfilter, Germany-Latvia Desk, OECD Economics Department

Unemployment is still above 8% in Latvia and contributes to poverty, in part because many unemployed have been without a job for an extended period of time. High unemployment and poverty are concentrated in some regions (Figure 1).

Latvia1
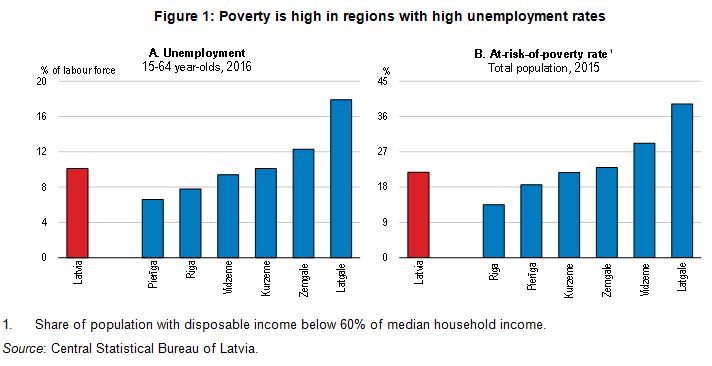
Housing policies shape residential mobility and can encourage workers’ movement to jobs (Andrews et al, 2011). The 2017 Economic Survey of Latvia therefore argues that good housing policies help reduce unemployment in high-unemployment areas. By helping workers find better jobs, they can also boost productivity and wages. Housing policies are particularly relevant for young people since they have a naturally higher propensity to move. Good housing policies could also encourage young people to seek opportunities in Latvia rather than emigrate.

Affordable quality housing is also important for wellbeing. Overcrowded housing is widespread among low- and middle-income households in Latvia. The share of households’ housing spending in total expenditure (26%) is high, and higher than in other countries with similar income level, such as Estonia. Policies are therefore needed to make quality, affordable housing available in neighbourhoods which are well connected to employment opportunities.

Few households rent their homes, even among low-income households (Figure 2).  Home owners from high-unemployment areas are likely to find it difficult to afford buying housing in areas with good employment opportunities, where house prices are likely to be higher. There is little development of new housing for rent. Legal uncertainty and long legal procedures hold back the development of the private rented housing market. Reducing tax evasion and fostering long-term lease contracts could also make contracts more reliable and make rented housing more attractive for tenants. Several OECD countries have also successfully expanded affordable housing by requiring private developers to allocate a proportion of the dwellings as affordable units (Salvi del Pero et al., 2016).Latvia2

Social housing is scarce and waiting lists are long, especially in the Riga area, where unemployment is low and good jobs more abundant. Government spending on social housing and on cash housing benefits for low-income households is low. Support only covers a small share of the low and middle income population. More funding for low-cost rented housing in areas of expanding employment would boost employment and lower poverty. An eligible person can only apply for assistance in the municipality where she resides, limiting labour and residential mobility. A nation-wide register that allowed eligible persons to apply for social housing where they expect better job opportunities could support residential mobility.

References:

OECD (2017) Economic Survey of Latvia.

Salvi del Pero, A., Willem, A., Ferraro, V., Frey, V. (2016), “Policies to promote access to good-quality affordable housing in OECD countries,” OECD Social, Employment and Migration Working Papers, OECD Publishing, Paris.

Andrews, D., A. Caldera Sánchez and Å. Johansson  (2011), “Housing Markets and Structural Policies in OECD Countries“, OECD Economics Department Working Papers, No. 836, OECD Publishing, Paris.


How to make Belgian firms more productive

by Manav Frohde, Economist, OECD Economics Department

A combination of market-based policies and a redistributive welfare state have helped Belgium achieved among the highest living standards in the OECD. While the economy remains highly productive, productivity growth has slowed  over the past two decades (Figure 1 & 2). Reinvigorating productivity growth will be necessary to sustainably increase economic prosperity over the coming years.

Belgium Manav1

Belgium Manav2With a particular focus on the business environment and skills and labour market policies the 2017 OECD Economic Survey of Belgium identifies several measures that could help improve long-term productivity growth.

The general framework conditions in Belgium are by and large favourable for private sector activity. Nevertheless business dynamism, as measured by entry and exit rates, is weak (Figure 3). This is important because international evidence suggests that young firms contribute more than proportionately to innovation, productivity growth and job creation. The low rates of entry and exit in the business sector may reflect a dominating presence of large, established firms. Relatively high administrative burdens on start-ups, including the low threshold from which firms are required to register for VAT, and a high minimum capital requirement for establishing a firm also act as barriers to entry. Many young, innovative firms also face financing constraints, particularly in the scale-up phase, suggesting that increased access to venture capital would enhance firm dynamism.

Belgium Manav3

At around 2.5% of GDP Belgium’s spending on research and development (R&D) is above both the EU and OECD averages. However, it falls short of the Lisbon target of 3% of GDP. Moreover, the share of business enterprise R&D in total R&D spend

ing has declined over the past two decades. Public support programmes for R&D and innovation could be streamlined to improve their effectiveness, while the effectiveness of existing tax incentives for private companies should be critically assessed. Public sector entities at the different levels of government could also step up their innovation co-operation, and could do more to foster collaboration between universities and research centres, and private companies.

Belgium Manav4
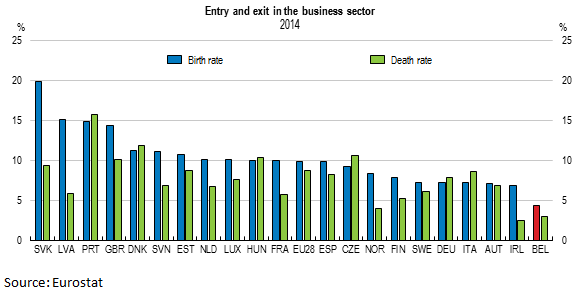
Productivity growth has also been held back by low public investment, particularly in transport infrastructure. Public investment declined from close to 6% of GDP in the early 1970s to just above 2% of GDP since the 1990s (Figure 4). Antwerp and Brussels are among Europe’s five most congested urban centres. Given limited fiscal space, public investment could be financed through a combination user fees, well-designed public-private partnerships, reductions in inefficient public spending, and higher non-distortionary taxes.

References:

OECD (2017), OECD Economic Surveys: Belgium 2017, OECD Publishing, Paris.


Economic research on international capital flows: where do we stand 10 years after the Global Financial Crisis started?

Stéphanie Guichard, our guest author, is a former Economic Counsellor to Catherine L. Mann, OECD Chief Economist.

Financial globalisation has given international capital flows a central role in the functioning of the global economy, leading to considerable economic research over the past 30 years. Making the most of these capital flows has always been a challenge, as they can bring both good and bad. On the one hand, they can support long-term growth through a better international allocation of saving and investment, through technology and management improvements associated with FDI inflows or through enhanced transparency and corporate governance due to the exposure of flow recipients to international investors. On the other hand, they complicate macroeconomic management of recipient countries, increase financial vulnerabilities and amplify domestic distortions, and can lead to financial crises and sudden stops with negative implications for economic growth.

This challenge has become even more acute after the Global Financial Crisis financial revealed the complexity of global financial relations and their role in shock transmission. The crisis also questioned the ability of fundamentals to protect countries from financial instability and the global financial cycle. Overall it showed that global financial integration has not only led to an increase in the size of capital flows (annual gross cross-border capital flows increased from about 5% of world GDP in the mid-1990s to around 20% in 2007) but has also affected the drivers of these flows as well as the transmission and contagion mechanisms.  For instance, there has been a growing decoupling between gross and net flows since the late 90s which means that surplus countries do not necessarily “finance” deficit countries, and economies with a balanced current account may still get important financing from abroad and be vulnerable to sudden stops. These changes have implications for a wide range of policies from surveillance, to how to best deal with inflows and outflows in order to reap their benefits while reducing associated risks. Moreover, over the past few years, while financial globalisation has marked a pause, the nature of capital flows has continued to evolve and new concerns have emerged.

The new OECD working paper Findings of the Recent Literature on International Capital Flows: Implications and Suggestions for Further Research takes stock of recent empirical and theoretical research. It assesses how this literature helps assess the current situation, associated risks and policy needs.  The main findings are as follows.

  • Foreign debt accumulation by EMEs non-financial corporation has become a potential source of instability. Foreign debt accumulated by EMEs non-financial corporation (NFC) has increased substantially since 2010. There is also evidence suggesting a significant part of this debt has been financing financial assets acquisitions or deposited in local banks rather than investment in fixed assets, supported by the favourable carry trade opportunities resulting from the low dollar interest rates. A USD appreciation and an increase in dollar interest rates could hence lead to a fast unwinding on some of these positions.
  • The protecting role of good fundamentals is being questioned. The capital inflow surge to EMEs that followed the implementation of QE in advanced economies, the “taper tantrum” episode, the vulnerabilities associated with EME corporate borrowing have all revived the debate on EMEs vulnerabilities to global financial shocks, especially the monetary policy stance in advanced economies. The analysis of push (global) and pull (local) factors has focused on the mechanisms by which push factors affect EMEs and whether some fundamentals affect the sensitivity of countries to these factors. and mitigate the impact of the global financial cycle. However, findings have been mixed, potentially questioning the traditional view that good fundamentals necessarily protect countries from financial turbulences.
  • The ability of exchange flexibility in mitigating the risks associated with capital inflows is also questioned. The existence of a global financial cycle that affects countries independently of their exchange rate regime has questioned the ability of the move towards more exchange rate flexibility by many EMEs over the past two decades to shield them better from financial turbulences than the less flexible regimes of the 90s. This is especially the case as exchange rate fluctuations may amplify the impact of financial shocks via balance sheets effects. While this point is largely shared by recent analyses, the further implications for policy making including monetary policy and capital controls is under debate. While some argue that under full capital mobility, countries outside the US lose monetary autonomy, even with flexible exchange rate, and call for a greater use of prudential and capital flow management tools, (e.g. Rey 2016), others reject this view and rather stress that central bankers have to deal with worse trade-offs related to financial stability issues (e.g. Banerjee et al. (2015) and Obstfeld (2015)).
  • While capital controls have been increasingly considered as a complementary policy tool to deal with international capital flows, evidence on their impact remains inconclusive. The reliance on capital controls or more generally capital flow management measures remains an important, and yet unsettled, policy debate regarding international capital flows. As the risks associated with international capital flows have become more obvious, there has been a slow shift in the post-Bretton woods consensus view that capital should be allowed to move freely across countries and that the use of capital control, even in face of large inflows or sudden stops, was unwarranted. However, most of the issues regarding the use, effectiveness and spillover effects of capital control remain largely open, as empirical results point to different directions, partly because of the diversity of the measures of capital controls that have been used, the different time horizon and countries under review.
  • International policy coordination is essential. Deeper global financial integration means that monetary and financial shocks are transmitted through the financial system across countries and that imbalances or credit booms abroad can affect the domestic economy and its stability, as seen during the financial crisis. Domestic policies, especially monetary and financial policies, may spill over to other countries and even have spillback effects on the domestic economy. Hence international cooperation and coordination of policies have been put forward to deal with international capital flows in three main areas: monetary policy; capital control management and more broadly financial policies; the global safety nets.

The paper points to many areas where further investigation is needed to guide policy making. They include the role of fundamentals in protecting countries against the risks associated with capital account openness, the impact of exchange rate fluctuations taking into account the balance sheet transmissions channels, the costs and benefits of capital controls, financial policy spillovers, the costs and benefits of the global financial safety net, the drivers of capital outflows — especially as China is further liberalising its capital account–, how the characteristics of the sectors receiving/exporting inflows affect the drivers of the flows and their impact on the economy.

References:

Banerjee, R., M. Devereux and G. Lombardo (2016), “Self-oriented monetary policy, global financial markets and excess volatility of international capital flows“, BIS Working Papers, No 540 Jan.

Guichard, S. (2017), “Findings of the recent literature on international capital flows: Implications and suggestions for further research“, OECD Economics Department Working Papers, No. 1410, OECD Publishing, Paris.

Obstfeld, M. (2015), “Trilemmas and Tradeoffs: living with financial globalization” in Global Liquidity, Spillovers to Emerging Markets and Policy Responses, edited by C. Raddatz, D. Saravia, and J. Ventura, Santiago, Central Bank of Chile.

Rey, H. (2016), “International Channels of Transmission of Monetary Policy and the Mundellian Trilemma”, IMF Economic Review, Vol. 64, Issue 1.


The Italian banking system at a turning point – The Italian View

by the Italian Ministry of Economy and Finance, Pier Carlo Padoan, Italy’s Minister of finance, was OECD Deputy Secretary-General and Chief Economist from 2009-2014).

The Italian banking system has long since been waiting for a comprehensive reform addressing structural inefficiencies and structural rigidities. As of 2014, the Government has defined a comprehensive reform plan while also tackling the crisis affecting several banks.

Narrow path2

To begin with this latter topic, three interventions involved seven banks that were experiencing major strains. The first intervention required the resolution of four small and mediumsized regional banks that led to the formation of “bridge banks” in charge of continuing operations, thus rescuing 12 billion euros in savings for about 1 million customers.

The resolution procedures ended in April 2017 with the sale of three “bridge banks” to a larger bank (UBI). BPER acquired the fourth in June 2017. Buyers were selected through a fair, open and transparent procedure. This resolution did not imply any State aid, thus requiring a major effort by the banking sector. The private sector provided 4.7 billion euros to avoid bankruptcy and its social and entrepreneurial consequences, preserving the issue of loans to over 200,000 small and medium-sized businesses, small retailers and craftsmen.

More recently, the Government intervention was addressed to the liquidation of Banca Popolare di Vicenza and Veneto Banca. After the ECB recognized the two banks as “failing or likely to fail”, the Single Resolution Board stated – under the EU Banking Recovery and Resolution Directive – that the crisis had to be dealt with according to national insolvency rules, since a resolution was not applicable. Consequently, the Italian Government started a liquidation procedure assisted by public resources combined with the sale of some assets and liabilities of the two banks to Intesa Sanpaolo. The Government, after having shared the burden of the intervention with shareholders and junior bondholders, committed around 4.8 billion euros in cash and around 12 billion euros in guarantees for that purpose. As in previous cases, the procedure preserved the flow of credit to clients of the insolvent banks (families, businesses, craftsmen), and limited the impact on the social and business environments of one of the best performing regions in the Country.

Eventually, the precautionary recapitalization of Monte dei Paschi di Siena was approved at the beginning of July by the European Commission, as part of the restructuring plan 2017- 2021, including the disposal of 28.6 billion euros of gross bad loans. The recapitalization was needed to put the bank in conditions to successfully face the adverse scenario of the stress tests that the ECB ran in 2016. The precautionary recapitalization includes 3.9 billion euros of direct capital injection and up to 1.5 billion euros of compensation in favor of retail subordinated bondholders, meeting certain conditions, whose bonds are mandatorily converted into equity.

By facing each case with a suitable solution, according to the specific nature and magnitude, both European and Italian rules could be implemented offering the best possible solutions. Improvements in the banking industry are a different matter altogether, they require a deeper and more thorough approach, to be pursued through structural reforms designed to reduce inefficiencies and address the issue of non-performing loans (NPLs).

The reform of large cooperative banks (the so-called “Popolari”), introduced as early as January 2015, aims at consolidating and bolstering the Italian banking system. Banks included in the cluster were forced to transform into joint stock companies, and as a result, two of them merged, creating the third largest group in Italy. The reform of smaller cooperative banks promotes consolidation in the industry, as well as the adoption of more efficient business models reducing the exposure to market risks. Finally, the self-reform of banking foundations is meant to put greater emphasis on the community-based initiatives of the foundations in place of interfering with the management of participated banks.

Alongside such structural reforms of the banking sector, the Government has adopted measures to encourage the creation of a market for non-performing loans, which helps to reduce the burden of those assets and restore an adequate flow of lending to the real economy.

These provisions include the institution of a guarantee on the Securitization of Bad Loans (GACS), which is a State guarantee on ABS’ senior tranches granted upon request by the banks. Changes to Italian insolvency rules and to foreclosures procedures also may help in creating a market for NPLs, as they improve the efficiency of insolvency proceedings and streamline the enforcements of creditors’ rights. The legislation now includes a series of measures to reduce lead-time for foreclosures such as: competition in pre-bankruptcy agreements with creditors; acceleration of sale transactions to ensure higher NPLs value; new rules for debt restructuring; easier access to credit for troubled companies; amendment of the regulations governing the deductibility of credit losses; and agreements secured by real estate assets, where parties may agree that transfer of the assets will become effective upon default by the borrower.

Even after facing a long recession, the Italian banking sector has proven to be sound and resilient. The stock of NPLs is shrinking at an increasing pace, while the origination rate of new exposure is approaching pre-crisis level. Those comprehensive interventions on specific banks and on the industry as a whole reduced and in some cases excluded major sources of risk. Overall, after years of adjustments, the Italian banking industry is returning to positive, effective and promising levels of performance.

Further reading:

The Narrow Path | Issue #2 | August 2017 | www.mef.gov.it | Italian Ministry of Economy and Finance


The middle-income plateau: trap or springboard?

Rauf Gönenç and Vincent Koen, OECD Economics Department

The overall slowdown and mixed growth performance of emerging market economies in the past 15 years (see chart) has revived angst about a so-called “middle-income trap”. While countries with lower incomes often do grow faster so as to close some of the gap with high income countries, they have done so at very different and uneven speeds.  Clearly, a durable and consistent strengthening of growth in these economies is key for global growth to return to higher long-term averages, as underlined in the latest OECD Interim Economic Outlook.

But how compelling is the notion of such a “middle-income” trap? A guided tour of the recent literature (Gönenç, forthcoming) shows that provided countries adopt the right policies, they are not doomed to get stranded mid-way but can and do converge with the most advanced economies.

Koengonenc

Indeed, a forensic investigation of the statistical evidence reveals that middle-income countries, defined according to GDP per capita or distance to the US benchmark, manage “escape velocity” to higher income levels more often than either poorer or richer countries do (Han and Wei, 2017). However, growth slowdowns are admittedly also more frequent in the middle-income group, which therefore displays greater dispersion in performance.

One reason is that the impact of economic policies on GDP growth is greater at middle than at lower and higher income levels, as shown in recent econometric analysis undertaken at the OECD (Égert, forthcoming).

Earlier long-term growth regressions have highlighted four areas that influence the speed of convergence, and where most middle-income countries have ample room for progress:

  1. Macroeconomic stability and openness, which are enhanced by trade and investment liberalisation, flexible exchange rates, sustainable public finances and strict financial sector supervision.
  2. Education, through the twin channels of workforce employability and productivity (Koen et al., 2013).
  3. Law and rule enforcement, which is hard to quantify but better captured in recent work (Guillemette et al., 2017).
  4. Financial development and diversification – from bank lending to various forms of equity funding, so that savings go to productive uses and entrepreneurs can more readily access funding (Cournède and Denk, 2015).

Even so, regressions leave much of the cross-country variation in growth unexplained. Growth remains a highly idiosyncratic process and may pick up when conditions – as captured by the indicators used in such regressions – look unfavourable, and vice versa (Levy and Rodrik, 2017). One reason may be related to how entrepreneurship flourishes, or is hindered, an area where experience varies considerably across countries and time for myriad reasons.

Many of the relevant factors were recognised already in the early 1960s by Rostow (1960) and others when they advised international organisations and the Kennedy administration on how to promote economic take-off in the developing world, calling for a shift in focus from individual infrastructure projects to more systemic changes in economic incentives and institutions. The latest econometric evidence supports their underlying insight that pushing ahead with reforms on a broad front should enable these economies to catch up over time with the more advanced ones.

Further reading 

 Cournède, B. and O. Denk (2015), “Finance and growth in OECD and G-20 countries”, OECD Economics Department Working Papers, No. 1223.

Égert, B. (forthcoming), “Quantification of structural reforms: Extending the framework to emerging market economies”, OECD Economics Department Working Papers.

Gönenç, R. (forthcoming), “The middle-income plateau: trap or springboard?”, OECD Economics Department Working Papers.

Guillemette, Y. et al. (2017), “A revised approach to productivity convergence in long-term scenarios”, OECD Economics Department Working Paper, No. 1385.

Han, X. and S. Wei (2017), “Re-examining the Middle Income trap hypothesis (MITH): What to reject and what to revive?”, Journal of International Money and Finance, Vol 73.

Koen, V., R. Herd and S. Hill (2013), “China’s March to Prosperity: Reforms to Avoid the Middle-income Trap”, OECD Economics Department Working Papers, No. 1093.

Levy, S. and D. Rodrik (2017), “The Mexican paradox”, Project Syndicate, 10 August.

Rostow, W. (1960), The Stages of Economic Growth, Cambridge University Press.