South Africa: it is time to rekindle the economy

By Falilou Fall, Head of South Africa Desk, OECD Economics Department

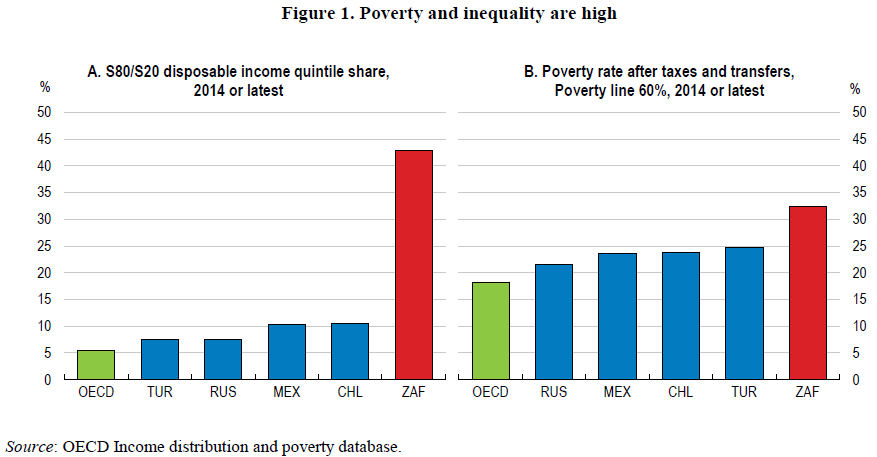
Growth is recovering but inequality remains persistent. Growth is projected to reach 1.5% in 2018 after many years below one percent or negative in per capita terms. Low growth and high unemployment have adversely affected the well-being of South Africans. Since 2010, inequality, measured by the Gini coefficient at 0.62, has almost stagnated withering the social contract in a context of policy mistrust (Figure 1).
ZAF1 Feb 18

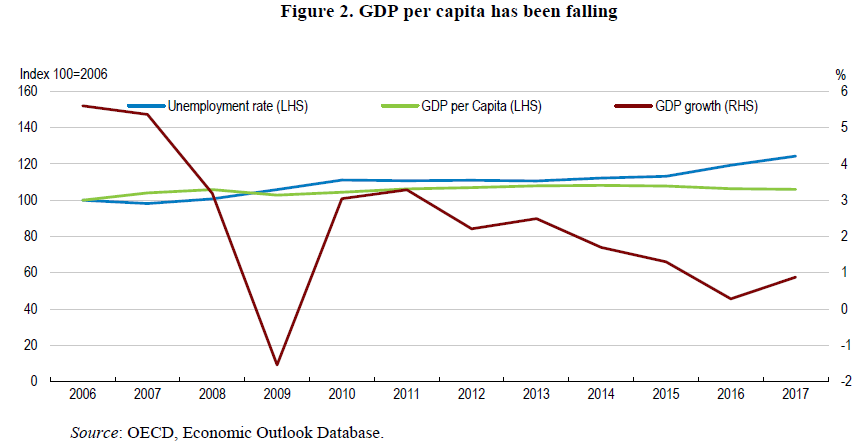
As pointed out by the 2017 OECD Economic Survey of South Africa, the weak growth reflects lacklustre investment and continued low business confidence and the impact of high unemployment, moderate wage increases and persistent indebtedness on sluggish household consumption (Figure 2).

Low growth and weak fiscal discipline contributed to rising public debt burden — from 41% in 2012 to 53% of GDP in 2017. The shortfalls in meeting fiscal objectives, policy uncertainty and corruption concerns in turn led to the downgrading of the government bond ratings to sub-investment level by two major rating agencies in 2017.  This makes it harder to meet the large social needs of much of the population.
ZAF2 Feb 18

The election of a new political leadership should brighten the outlook. Business and household confidence are up. Indeed, after three years of contraction, private investment is now expected to drive growth. But, growth perspectives remain too low to create enough jobs and generate enough government revenues for spending and debt reduction, while social and infrastructure needs are high.

In the short run, a more accommodative macroeconomic policy mix can boost growth. Inflation has come down throughout 2017 and, at 4.4% in January 2018, it is in the middle of the Reserve Bank’s target band. Interest rates can now be further reduced to amplify the investment pick up. Smoothing the pace of fiscal consolidation could further sustain demand and thus contribute to growth acceleration. In a low growth era, fiscal consolidation is detrimental to consumption demand, although reassuring for investors (Blanchard et al., 2013; Sutherland et al., 2012). South Africa made limited progress in fiscal consolidation over the last five years as growth kept falling.

Along with slower consolidation, budget reallocation toward more growth-enhancing investment should continue. Limiting wage growth in the public sector and subsidies and transfers to state-owned enterprises would create fiscal space for infrastructure and social investment.ZAF3 Feb 18

Bold structural reforms are needed to increase potential growth in a longer perspective. OECD South Africa Economic Surveys (2013, 2015) have pointed to many growth boosting reforms: broadening competition in the economy, limiting the size and grip of state-owned enterprises (SOEs) on the economy, and improving the quality of the education system. Important input and technology sectors such as telecommunications, energy, transport and services in general should be opened up to more competition. In particular, telecoms or the airline company, which are in markets with enough competition could be privatised. Moreover, South Africa lacks a proper urban transport system. Putting in place a national plan to expand public transport and allowing more private operators would reduce the cost of transport on the budget and raise well-being.

Job creation remains a major challenge for the quarter of workforce without jobs. The 2017 OECD South Africa Economic survey found that boosting entrepreneurship and growing small businesses can play an important role in creating jobs. Steps have been taken to ease starting a business, but red tape remains a burden. There is room to reduce harmful product market regulations and restrictions to entrepreneurship and entry in professional services. The quality of the education system and lack of work experience contribute to gaps in entrepreneurial skills. Policies should provide more financial and non-financial support for entrepreneurs and small businesses. But, a lack of co-ordination and evaluation hampers effective policy-making.

Greater regional integration within the Southern African Development Community (SADC) could provide new opportunities for growth. Despite large growth potential, economic integration in the sub-region has not advanced much. Intra-regional trade in the Community is only 10% of total compared to about 25% in the ASEAN or 40% in the European Union. Better implementation of SADC protocols and agreements would advance integration and create jobs. Reducing non-tariff barriers by improving customs procedures and simplifying rules of origin would reduce trade costs in the region. Weak infrastructure and institutions and barriers to competition limit industrial development. More ambitious and effective infrastructure and investment policies are necessary at the regional level.

References

Blanchard, O. J., and D. Leigh. “Growth Forecast Errors and Fiscal Multipliers.” The American Economic Review 103, no. 3 (2013): 117-20.

OECD (2013), OECD Economic Surveys: South Africa, OECD Publishing, Paris.
http://dx.doi.org/10.1787/eco_surveys-zaf-2013-en

OECD (2015), OECD Economic Surveys: South Africa, OECD Publishing, Paris. http://dx.doi.org/10.1787/eco_surveys-zaf-2015-en

OECD (2017), OECD Economic Surveys: South Africa, OECD Publishing, Paris. http://dx.doi.org/10.1787/eco_surveys-zaf-2017-en

Sutherland, D., P. Hoeller and R. Merola (2012), “Fiscal Consolidation: How Much, How Fast and by What Means?“, OECD Economic Policy Papers, No. 1, OECD Publishing, Paris.
http://dx.doi.org/10.1787/5k9bj10bz60t-en


Finland: growing and reforming, but no time for complacency

By Christophe André and Jon Kristian Pareliussen, OECD Economics Department

After a long period of lacklustre economic performance, robust growth has resumed. The Finnish economy suffered a series of sizeable adverse shocks alongside the global financial and economic crisis, facing major difficulties in the electronic and forest industries, in addition to a severe recession in Russia. Sound fundamentals and policy settings helped weather the impact of those shocks, and by early 2017 the economy had regained strong momentum. The recovery is broad-based across economic sectors, employment is picking up, and high business and consumer confidence point to a strong expansion going forward.

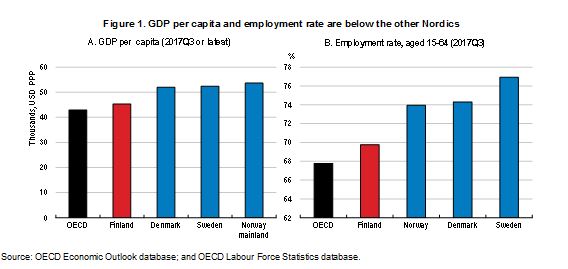
But challenges remain, as the 2018 OECD Economic Survey of Finland shows. GDP per capita exceeds the OECD average, but is significantly lower than in Denmark, Germany and Sweden, reflecting differences both in productivity and labour utilisation (Figure 1). A rapidly ageing population reduces labour supply and puts pressure on public finances. Hence, future growth and well-being will hinge on a higher employment rate and productivity gains, both in the private and public sectors. Reassuringly, these challenges are well understood by the government, which has been implementing structural reforms across a wider range and with more determination and coherence than in most other OECD countries.Finland2.JPG

Many of these reforms concern the labour market. The 2016 Competitiveness Pact between the government and the social partners lowers unit labour costs by about 4% from 2017 by internal devaluation. The social partners have also moved from a system of national-level collective agreements towards a system of “organised decentralisation”, where sector-level collective agreements are coordinated following the lead of export industries, and more leeway is given to local-level bargaining. Furthermore, the duration of unemployment benefits was reduced by 100 days in 2017, a job search requirement and a new activation model for the unemployed were introduced, the trial period for new hires was extended and education made more modular and nimble to better respond to evolving skill needs.

The health, social services and regional government reform will shift the responsibility for organising health care and social services from municipalities to 18 newly created autonomous counties from January 2020, bringing the sub-national government structure closer to that of the other Nordic countries. Goals of the reform include providing people with more equal services, increasing freedom of choice and improving the sustainability of general government finances. The reform is welcome, and its success is crucial to meet the needs of an ageing population and ensure long-term fiscal sustainability (Figure 2).

Finland no time for complacency2

The strong pick-up in economic growth and an impressive reform record are reasons for optimism, not complacency. Social welfare reform could boost employment further, as many unemployed today will see only small net income increases or even incur a loss upon return to work. Coordinating the tapering of various working-age benefits against earnings could drastically improve work incentives and transparency, while preserving the current level of social protection, and is hence a more promising route for future reform than a basic income. Furthermore, specific measures could lift work incentives for parents and older workers. Combined with the new income registry linking benefit payments to real-time incomes from 2019, such reforms would make for a truly efficient and inclusive benefit system, adapted to evolving work patterns. Work incentives could be further strengthened by reducing the tax burden on labour while further increasing indirect and property taxes and reducing tax expenditures. Such a tax shift, along with measures to support business development and entrepreneurship could also give productivity a welcome boost.

References

OECD (2018), OECD Economic Surveys: Finland 2018, OECD Publishing, Paris.
http://dx.doi.org/10.1787/eco_surveys-fin-2018-en


Towards a more prosperous and inclusive Brazil

By Jens Arnold and Alberto González Pandiella

Over the past two decades, strong growth combined with remarkable social progress has made Brazil one of the world’s leading economies. However, Brazil remains a highly unequal country, recent corruption allegations have revealed significant challenges in economic governance and the situation of its fiscal accounts is challenging with high and rising public debt (OECD, 2018). This calls for wide-ranging reforms to sustain and continue progress on inclusive growth. The government has started to put in place significant reforms, including a fiscal rule and a financial market reform that aligns directed lending rates with market rates. The long and deep recession is over and growth is projected to accelerate significantly this year. But more needs to be done to improve the living standards of all Brazilians.

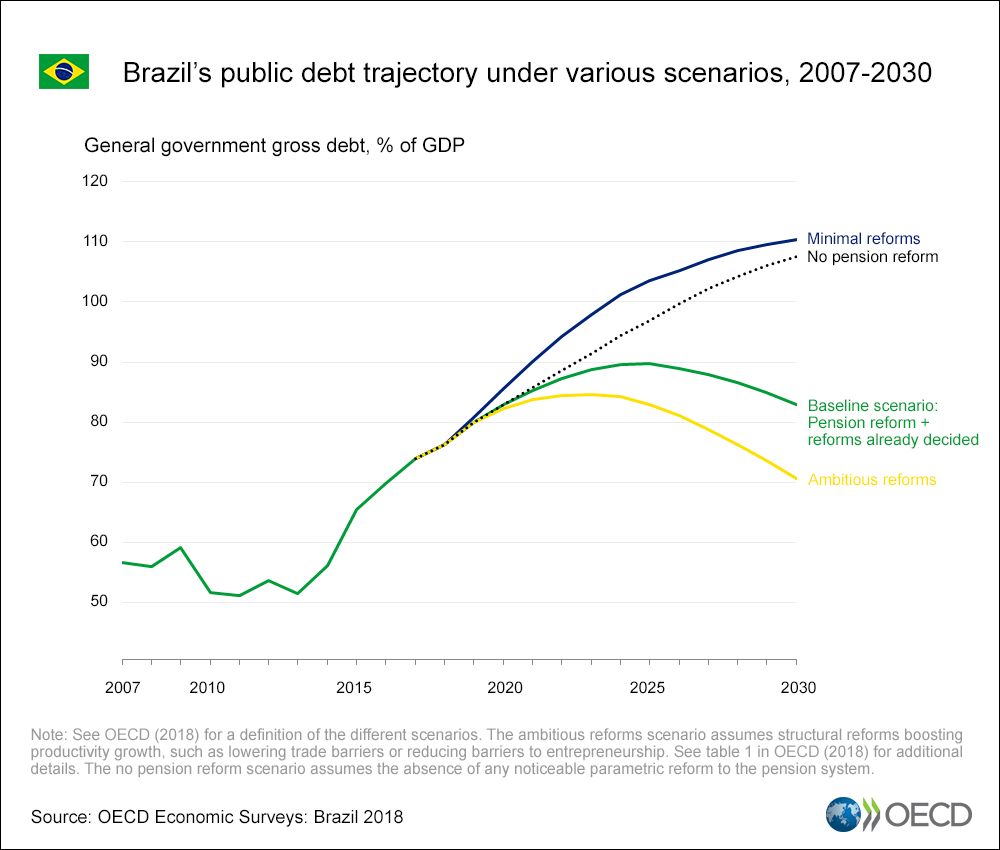
The overall budget deficit is close to 8% of GDP driven by rising expenditures. Gross public debt has increased by approximately 20 percentage points of GDP over the last 3 years and stands around 75% of GDP.  Implementing the planned fiscal adjustment and achieving fiscal targets is crucial for restoring the credibility of fiscal policy and avoiding a fiscal crisis. A comprehensive social security reform has become the most urgent element of the fiscal adjustment, as much of the worsening of the deficits is due to rising pension spending. A pension reform is also an opportunity to make growth more inclusive through better targeting of benefits. Aligning Brazil’s pension rules with those practiced in OECD countries could be done in a way to preserve the purchasing power of pensioners while significantly improving the sustainability of the pension system. For example, in OECD countries people retire on average when they become 66 years old, while the effective retirement age in Brazil is 56 years for men and 53 for women. Establishing a formal minimum retirement age would help, in addition to rethinking the current benefit indexation mechanisms. Without reform, pension expenditure will more than double by 2060 (OECD, 2017), which would lead to unsustainable fiscal dynamics (Figure 1).

6_Public-debt-trajectory_blog


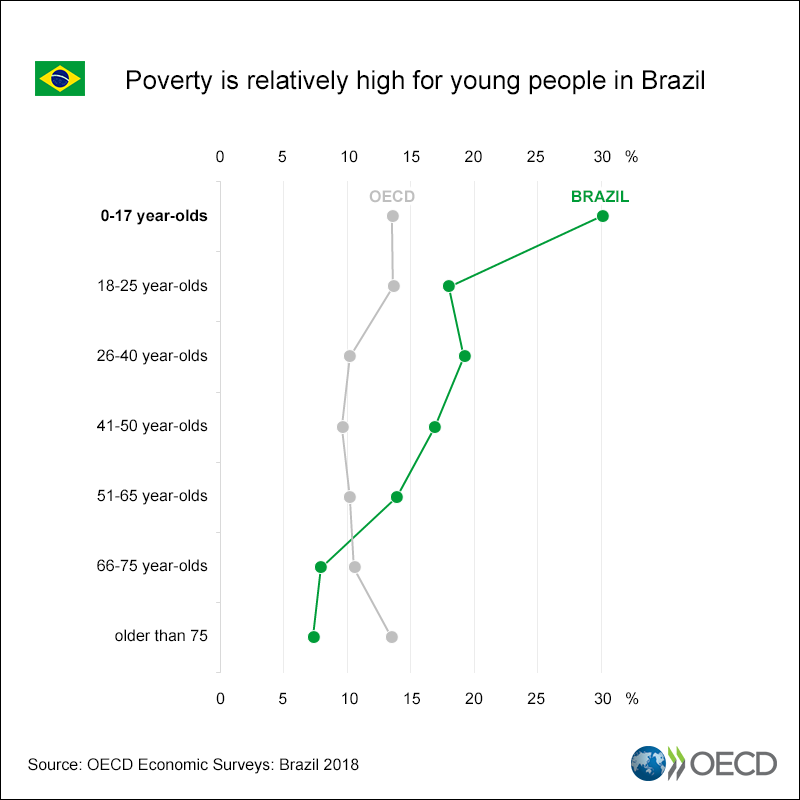
Improving the effectiveness of public spending, and in particular public transfers, will also be crucial for further social progress. At present a large and rising share of social benefits is paid to households that are not poor, which reduces their impact on inequality and poverty. Already, poverty is more than three times higher among children and youths than among those aged above 65 (Figure 2). Limiting future increases in those social benefits that do not reach the poor would be a first step. That would instead allow shifting more resources towards transfers that do reach the poor, such as Bolsa Família, which is highly regarded across the world and reaches the poor like hardly any other social programme in Brazil. This would help particularly children and youths. Currently Bolsa Família only represents 0.5% of GDP out of the 15% of GDP that Brazil spends on social transfers (OECD, 2018). There is also scope to reduce transfers to the corporate sector, which have increased markedly over recent years. These transfers, often granted in the form of tax exemptions or subsidised lending, have not been associated with visible improvements in productivity or investment, but they benefitted primarily the more affluent, besides creating fertile ground for corruption and political kick-backs.

9_Poverty

Further advances in living standards will also hinge on finding a new inclusive growth strategy, ensuring that the benefits of growth will be broadly shared across the population. Productivity will have to become the principal engine of growth in the future, because the demographic bonus that has supported growth in Brazil is reversing. But raising productivity will require significantly higher investment and trade. Brazil has one of the lowest investment rates among OECD and emerging market economies and it is also less integrated into global trade. Boosting investment and trade would raise productivity, helping Brazilians to access higher wages and living standards.

References:

OECD (2018), OECD Economic Surveys:Brazil, OECD Publishing, Paris.

OECD (2017), “Pension Reform in Brazil, OECD Policy Memo“, April 2017, https://www.oecd.org/brazil/reforming-brazil-pension-system-april-2017-oecd-policy-memo.pdf.


Why would a universal credit be better than a basic income for Finland?

By Jon Kristian Pareliussen, Economist, OECD Economics Department

“If you don’t know where you are going, you might wind up someplace else.”

– Yogi Berra

Many Finns seem to agree that the social welfare system should be reformed, but there is no agreement as to which form such change should take. Recognising that the decades-long process of piecemeal welfare reform responding to the pressing issues of the day is behind many of the current problems, the OECD Economic Survey of Finland 2018 argues for developing a common vision for the future of social welfare in Finland, so that upcoming reforms can consistently pull towards the same goal.

In Finland, as elsewhere, income taxation and the withdrawal of benefits reduce the pay-off for individuals who go from benefits to work. Multiple benefits interact in complex ways, trapping individuals in unemployment, underemployment or inactivity. Complex benefit rules combine with administrative practices to create “bureaucratic traps” when individuals taking up temporary, part-time or unstable employment face a real or perceived risk of losing eligibility or receiving benefits with a delay as their claims are re-evaluated. This can further reduce the attractiveness of work for risk-adverse, often cash-strapped, recipients. A third weakness of existing welfare systems is that they are built around traditional employer-employee relationships, and are thus ill-adapted to the future of work, which is likely to involve more changes in careers, part-time work, self-employment and platform work.

Two different benefit reform scenarios are developed in the Survey to inform a common vision for the future of social welfare in Finland. The first is a uniform benefit for all, a universal basic income. The second is a universal tapering rule inspired by the universal credit welfare reform in the United Kingdom. This scenario radically simplifies the existing benefit system and makes it more transparent by merging various benefits and withdrawing them at a single and moderate rate as income from work increases.

Comparing these scenarios with the current system illustrates the inevitable trade-offs between work incentives, inclusiveness and fiscal cost, the policy trilemma at the heart of social insurance and redistribution policy. Neither a basic income nor a universal credit can defy the laws of gravity. But some specific incentive issues can be resolved without much sacrifice by improving benefit design, and the general direction of reform has great consequences for outcomes.

A universal credit would consistently improve work incentives and reduce complexity, with limited changes to the income distribution and limited fiscal cost. A basic income would also remove some incentive traps, but would entail a major redistribution of income, widening inequality and increasing poverty. This happens because the design of a basic income with one uniform benefit for all is too simple to achieve the redistribution of the current system or a universal credit, where benefits are targeted to those who need them more. Assuming that the distribution of income in a longstanding democracy reflects Finns’ social preferences, it seems clear that merging and simplifying existing benefits is a better solution for Finland than a universal basic income. This conclusion is also likely to be relevant for other developed countries with solid and targeted social safety nets.

Finland.JPG

Simulating reforms is one thing but implementation can be a quite different story: experience has shown that major welfare reforms can come with significant costs. Implementation should hence be stepwise and build on the existing institutional context. Important technical building blocks, such as harmonised tax treatment and income definitions for different benefits as well as the new income registry should be fully operational and tested before reforming the overall architecture of the system.

Moreover, many current weaknesses, such as the cliff-edge loss of unemployment benefits once an individual works a certain amount of hours per week, the extended unemployment insurance for older workers and barriers to work for mothers created by childcare fees and the homecare allowance, can be overcome with relatively limited changes to the current system. Such measures should be taken without delay, but every step forward should be a stride towards an agreed vision for the future of Finnish social welfare – a vision where benefits continue to support Finnish citizens throughout their lives, protecting them from shocks and misfortune, but in a coherent, transparent and flexible way, fit for the future of work.

References

OECD (2018), OECD Economic Surveys: Finland 2018, OECD Publishing, Paris.  http://dx.doi.org/10.1787/eco_surveys-fin-2018-en

Pareliussen, J., H. Viitamäki and H. Hwang (2018a), “Basic income or a single tapering rule? Incentives, inclusiveness and affordability compared for the case of Finland”, OECD Economics Department Working Papers, forthcoming, OECD Publishing, Paris.


Mind the gaps: boosting productivity and reducing inequality in Chile

Antoine Goujard and Paula Garda, OECD Economics Department, Chile/Colombia desk

Chile has been one of the fastest-growing economies in the OECD in recent decades. Sound macroeconomic management, bold structural reforms, such as trade and investment liberalisation, and buoyant natural-resource sectors, supported fast convergence in living standards (Panel A). However, progress has slowed: declining productivity gains are limiting prospects for rising incomes and better-quality jobs; and inequality remains stubbornly high (Panels B and C).

Chile2018productivity blog.png

Chile is at a turning point if it is to continue raising the living standards of all. The 2018 OECD Economic Survey of Chile projects a solid expansion of the economy by 2.9% in 2018 and in 2019. Chile will benefit from more favourable global economic conditions and stronger world trade. The rebound in copper prices will also support short-term growth.

The cyclical recovery offers a key opportunity to address the country’s low and stagnant productivity and its persistently high inequality. An ambitious reform agenda could increase GDP per capita by over 5% in ten years and lower inequality, notably through better-quality jobs, according to OECD estimates. This calls for increasing competitive pressures and incentives for innovation, reducing the administrative burden, improving labour market regulations and raising social spending and the employability of all by more training.

Greater productivity would be a major boost for broader-based export growth (Chapter 1 of the Survey). Competition and simplified administrative procedures, notably licences and permits, are key for better competitiveness. The simplification process should include more stakeholders and stronger ex-ante and ex-post evaluations (OECD, 2016). Systematic reviews of competitive pressures and additional technical assistance and mentoring for young and smaller firms would support entrepreneurship and ease access to export markets. Together with higher and well-targeted support for R&D, this will raise innovation and productivity growth. At the same time, further infrastructure investment, notably in intermodal connections, railways and digital networks (OECD, 2017a), are needed to bridge remaining connectedness gaps and to reduce congestion.

Chile has to do more to realise the full potential of its people. Productivity boosting reforms need to go hand-in-hand with measures to raise skills and make the labour market more inclusive (Chapter 2 of the Survey). The recent education reforms will support teaching quality and skills, lowering inequalities (OECD, 2017b). However, continuing to strengthen the quality of education and developing apprenticeships would improve opportunities for all. Female employment and the skills of the youth would benefit greatly from better access to early childcare and extended daycare opening hours. Providing additional relevant training for vulnerable workers would support productivity and employment, notably for women, the lower skilled and the youth. Lower restrictions on permanent contracts and broader access to unemployment insurance would also ease labour market adjustment for workers and firms and increase quality-jobs, thereby reducing informality and boosting well-being.

Further reading:

OECD (2018), OECD Economic Surveys: Chile 2018, OECD publishing.

OECD (2017a), Infrastructure Governance Review: Chile – Gaps and governance standards of public infrastructure, OECD publishing.

OECD (2017b), Education in Chile, Reviews of National Policies for Education, OECD publishing.

OECD (2016), OECD Reviews of Regulatory Reform – Regulatory Policy in Chile, Government Capacity to Ensure High –Quality Regulation, OECD publishing.


Statistical Insights: New evidence shows that almost 40% of people are economically vulnerable in the OECD

By Carlotta Balestra, Policy Analyst, OECD Statistics Directorate

Stat-Insights-200_fwLooking at poverty and vulnerability through an assets lens

Households’ economic well-being is usually measured by income. But what if there is an interruption in the flow of income? Or an unexpected expense? Such events highlight the importance of wealth accumulation to sustain people’s economic well-being. New evidence on the distribution of wealth shows that  in the OECD  many people, who are not considered income poor, are nevertheless economically vulnerable in the event of  a sudden loss of income, e.g. through unemployment, family breakdown, or disability.  If they were to suddenly stop receiving income, such people would not have enough ready assets to keep living above the poverty line for more than three months.

Key findings

Since incomes can be saved and assets can generate returns, one might expect households’ incomes and assets to be closely correlated. However, OECD data on wealth distribution shows that this correlation is far from perfect.  In particular, the elderly tend to have substantial assets, but lower incomes.  Overall, in the OECD area, less than one in three households belongs to the same quintiles for both income and wealth.

Figure 1 shows that, on average in the OECD, 11% of people are both income and asset poor, and another 36% are not income poor but are economically vulnerable because of insufficient ready assets.

Fig 1 Stat insight feb 2018

The scope of the problem varies widely across countries. In Greece and Latvia, for example, more than half of the population lacks enough liquid financial wealth to maintain just above poverty‑level income for three months. By contrast, the share is much lower in Korea and Japan.

Figure 2 shows how different population groups are affected by economic vulnerability. Vulnerability tends to be highest among working‑age two-parent households and those headed by a person with only a primary or secondary education. Economic vulnerability also diminishes with the age of the head of household, as assets are generally accumulated over one’s life.Fig 2 Stat insight feb 2018

The fact that so many individuals who are not income poor are still vulnerable to sudden losses of regular income – whether from losing their jobs, family breakdown, disability or other causes – needs to be factored into policies. One issue that may need addressing is waiting periods.  While most OECD countries have social safety nets, access to relief may involve a significant delay to establish or assess eligibility, during which families may incur significant distress.

The measure explained

Definitions of asset-based poverty vary, depending on which assets are considered, what income level is deemed necessary for an adequate standard of living, and how long that income level could be maintained from cashing in available assets. We define relevant assets as excluding housing wealth, since people still need a place to live even when they have no income. An adequate income level is defined as the standard OECD poverty line of 50% of median disposable income; and we assume that assets would need to yield three months of that income.  So individuals are “asset poor” if they do not have enough liquid financial wealth to keep them above the standard poverty line if their incomes stopped for three months. Evidence on alternative asset-based poverty measures is available in the OECD Wealth Distribution Database.

In the OECD Wealth Distribution Database, household net wealth means the real and financial assets held by private households resident in the country, net of liabilities. Assets and liabilities are classified based on the nomenclature in the OECD Guidelines for Micro Statistics on Household Wealth, which distinguishes five categories of non-financial assets, eight categories of financial assets, and three categories of financial liabilities. The data in the OECD Wealth Distribution Database are by household, rather than by persons or adults: contrary to the convention when analysing household income, no adjustment is made for differences in household size.

Where to find the underlying data?

OECD Wealth Distribution Database, https://stats.oecd.org/Index.aspx?DataSetCode=WEALTH

Further reading

Balestra, C. and R. Tonkin (2018), “Inequality in household wealth across OECD countries”, OECD Statistics Working Papers, OECD Publishing, Paris, forthcoming.

Murtin, F. and M. Mira d’Ercole (2015), “Household wealth inequality across OECD countries: new OECD evidence”, Statistics Brief, No. 21, June, http://www.oecd.org/std/household-wealth-inequality-across-OECD-countries-OECDSB21.pdf

OECD (2017), How’s Life? 2017: Measuring Well-being, OECD Publishing, Paris.

http://dx.doi.org/10.1787/how_life-2017-en

OECD (2015), In It Together: Why Less Inequality Benefits All, OECD Publishing, Paris.

http://dx.doi.org/10.1787/9789264235120-en

OECD (2013), OECD Framework for Statistics on the Distribution of Household Income, Consumption and Wealth, OECD Publishing, Paris.

http://dx.doi.org/10.1787/9789264194830-en

OECD (2013), OECD Guidelines for Micro Statistics on Household Wealth, OECD Publishing, Paris.

http://dx.doi.org/10.1787/9789264194878-en


How does ageing affect income redistribution?

By Mikkel Hermansen, Economist, OECD Economics Department

In many advanced countries, the share of citiziens having reached post-retirement age is growing fast. Since elderly rely for a good part on a public pension scheme for income support, population ageing tends to result in more income redistribution, in particular in the form cash transfers. However, insofar as ageing also means a growing share of population in groups that are close to retirement age, but still considered as part of the working-age population, a more interesting question is how this facet of ageing affects redistribution. As we show in a recent paper on “Income redistribution through taxes and transfers across OECD countries” ageing actually tends to reduce income redistribution when the latter is measured as the reallocation of resources between people in working-age to limit the influence of redistribution across lifetime. This is primarily a result of ageing being associated with higher employment rates among seniors.

The purpose of redistribution is to reduce income inequality. Therefore it is natural to measure redistribution as the difference between the Gini coefficients of households incomes before and after personal income taxes and cash transfers.[1] This is done only for the working-age population (age 18-65)  to avoid the influence of public pensions, mostly reflecting that people pay taxes in working-age they then receive back as benefits in retirement age.

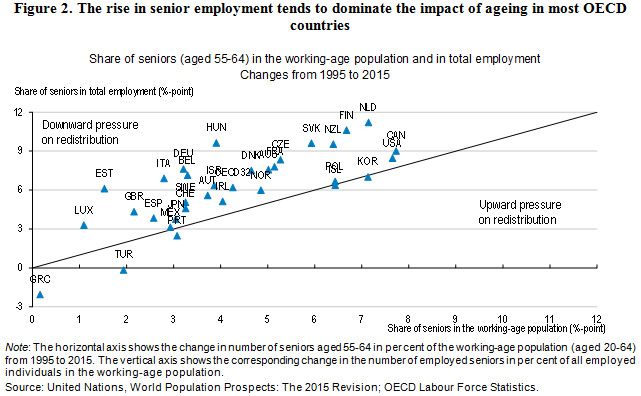
But how does ageing then affect redistribution? As Figure 1 shows, the working-age population has been ageing over the last two decades in the sense that the composition has changed towards relatively more seniors and fewer people below age 40.

ageinghh1

Such ageing of the working-age population tends to produce two counteracting effects on redistribution. It may drive redistribution:

  • upwards since seniors (age 55-64) approaching retirement are more likely to receive transfers than younger age groups and such transfers are likely to be sizeable, e.g. from early retirement, pension benefits available before age 65 or disability insurance.
  • downwards since more seniors tend to work longer than in the past. Rising life expectancy has generally been associated with more years in good health, which, combined with widespread policy reforms to reduce early withdrawal from the labour market, has implied substantive increases in employment rates among seniors.

A simple empirical exercise shows that the share of seniors in total employment has risen more than the share of seniors in the working-age population in most OECD countries (Figure 2). This suggests that the employment effect has tended to dominate and ageing has thus exerted a downward pressure on redistribution in most OECD countries. We confirm this by computing the change in redistribution with and without the senior group and find for most countries a larger decline in redistribution when including seniors. Nevertheless, for most countries the impact on measured redistribution is limited and is therefore not the main factor driving the overall  decline in redistribution observed  in most OECD countries since the mid-1990s.

ageinghh2

[1] The difference is scaled by the Gini coefficient for households incomes before taxes and transfers to account for cross-country differences in the initial level of market income inequality. See Section 3.4 in Causa and Hermansen (2017) for details.

References

Causa, O. and M. Hermansen (2017), “Income redistribution through taxes and transfers across OECD countries”, OECD Economics Department Working Papers, No. 1453, OECD Publishing, Paris, http://dx.doi.org/10.1787/bc7569c6-en.


Income redistribution through taxes and transfers across OECD countries: A focus on the bottom 40 per cent

By Orsetta Causa, Senior Economist, OECD Economics department

Tax and transfer systems are fundamental pillars of an inclusive growth policy agenda that aims at sharing the benefits of growth more equally and securing decent living standards for those in most need.  A new OECD report by Causa and Hermansen (2017) (“Income redistribution through taxes and transfers across OECD countries”) documents that redistribution through taxes and transfers has tended to decline across OECD countries since the mid-1990s. By and large, the decline in overall redistribution across OECD countries over the last decades has been primarily driven by a decline in redistribution by cash transfers. This is not surprising insofar as cash transfers account for the bulk of redistribution.

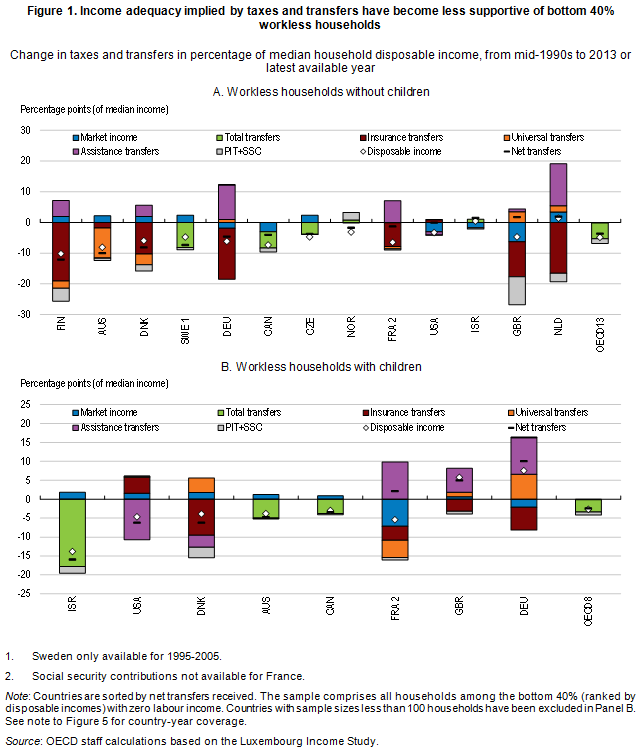
While the analysis cannot disentangle between policy and non-policy drivers of such decline in redistribution, this picture raises the concern that welfare systems are becoming less effective at ensuring income adequacy among vulnerable households. This question can be addressed by focusing on developments in market (or pre-tax and transfer) income and redistribution among households in “the bottom 40%” of the distribution. In order to isolate the effect of changes in population structure within that group, the composition of households is adjusted according to the working status of adults and the presence of children, two key parameters affecting the “need” for redistribution. This delivers the following insights, focusing on developments over the last two decades:

  • Income support provided by social transfers to bottom 40% workless households has declined in the majority of countries for which data are available (Figure 1). Given the overwhelming weight of transfers relative to market income among that group, their disposable income declined markedly relative to median income. In the majority of countries for which data are available, cash transfers have become increasingly ineffective at preventing workless households from falling into relative poverty, especially in the presence of children.

Iineq1

  • By contrast with workless households, income support provided by taxes and transfers to bottom 40% working households has increased in the majority of countries for which data are available (Figure 2). The increase in net transfer support was largely driven by declines in income taxes and social security contributions that tended to mitigate widespread declines in market incomes.

Iineq2

The decline in redistribution may to some extent reflect the effects of tax and transfer reforms to make work pay for individuals with low earnings potential and weak labour market attachment. Concluding from this that such reforms were inappropriate would fail to consider redistribution policies as part of broader policy packages to make growth more inclusive. For example well-designed policy packages should combine tax and transfer policies to make work pay and boost jobs with policies to improve employability, skill adaptability and wage prospects. In other words, to raise job quality for less-skilled and at-risk individuals such as disadvantaged youth and immigrants, but also for older workers facing displacement in declining sectors. The policy implication is that tax and transfer reforms should be designed within an array of complementary policy instruments to address equity and efficiency objectives, taking into account country-specific context, constraints and social preferences.

References

Causa, O. and M. Hermansen (2017), “Income redistribution through taxes and transfers across OECD countries”, OECD Economics Department Working Papers, No. 1453, OECD Publishing, Paris, http://dx.doi.org/10.1787/bc7569c6-en.


Income redistribution through taxes and transfers across OECD countries

By Orsetta Causa and Mikkel Hermansen, OECD Economics department

Many OECD countries have been facing a prolonged period of low growth and stagnating income of the poorest. This challenges governments’ fiscal redistribution, all the more so in a context where new forms of work are calling into question the effectiveness of traditional social safety nets and population ageing is putting pressure on public finances. Yet, the system of taxes and transfers  that underpins social protection  is a fundamental pillar of an inclusive growth policy agenda that aims at sharing the benefits of growth more equally. A new OECD report by Causa and Hermansen (2017) (“Income redistribution through taxes and transfers across OECD countries”) takes stock of the extent to which tax and transfer systems mitigate market income inequality today, and how this has changed over a period of rising globalisation and rapid technological change.

Redistribution through taxes and transfers has tended to decline across OECD countries since the mid-1990s

Since the mid-1990s, the redistributive effect of taxes and transfers has declined in the majority of OECD countries for which data are available (Figure 1, Panel A). The trend towards less redistribution was most pronounced over the pre-crisis period, and was temporarily reversed during the first phase of the crisis, reflecting the cushioning impact of automatic stabilisers and fiscal discretionary measures. The decline in redistribution was particularly pronounced in some Nordic countries, which are among the most egalitarian OECD countries. Admittedly, the extent of the decline observed in these countries was amplified by high levels of redistribution prevailing in the mid-1990s due to high unemployment. The steadily improving labour market outlook during the subsequent decade reduced the need for redistribution. The inequality-reducing effect of redistribution also declined among the least egalitarian of OECD countries, especially Israel, but also Australia and Canada. Trends in redistribution were more heterogeneous over the most recent decade, with increases in around half of OECD countries, in particular those hardest hit by the crisis (Figure 1, Panel B).

Orsetta1

The decline in redistribution was largely driven by insurance transfers to working-age households

By and large, the decline in redistribution across OECD countries has been primarily driven by a decline in redistribution by cash transfers, which is not surprising insofar as cash transfers account for the bulk of redistribution. Personal income taxes also contributed but played a less important and more heterogeneous role across countries (Figure 2, Panel A). In turn, the decline in transfer redistribution was largely driven by insurance transfers (e.g. unemployment insurance, work-related sickness and disability benefits). This was partly mitigated by more redistributive assistance transfers (e.g. minimum income transfers, means- or income-tested social safety net) in some countries such as Germany and the United Kingdom (Figure 2, Panel B). Assistance transfers are in many OECD countries less redistributive than insurance transfers, for instance due to low take-up but also due to relatively low benefit amounts, so that their size is generally smaller than insurance transfers.

Orsetta2

Policy implications

One finding highlighted  in Causa and Hermansen (2017) is a fairly widespread shift in transfer policy from out-of-work to in-work support, at least partly driven by reforms to make work pay, especially for workers with weak labour market attachment. While this is likely to have mitigated market income inequalities by spurring employment growth, it could have contributed to the decline in redistribution. This should not lead to the conclusion that countries have no choice but to trade more efficiency for less equity. The reason is that redistribution policies should be considered as part of broader policy packages to make growth more inclusive. For example, well-designed inclusive growth packages should combine tax and transfer policies to make work pay and boost jobs with policies to improve employability, skill adaptability and wage prospects. To the extent that such packages have not been broadly deployed by OECD countries, potentially reflecting budgetary constraints, reductions in market income inequality induced by such reforms have not been sufficient to prevent disposable income inequality from rising.

References

Causa, O. and M. Hermansen (2017), “Income redistribution through taxes and transfers across OECD countries”, OECD Economics Department Working Papers, No. 1453, OECD Publishing, Paris, http://dx.doi.org/10.1787/bc7569c6-en.


Switzerland’s productivity puzzle: Being a leader and an underperformer

by Patrice Ollivaud, Economist, Switzerland Desk, OECD Economics Department

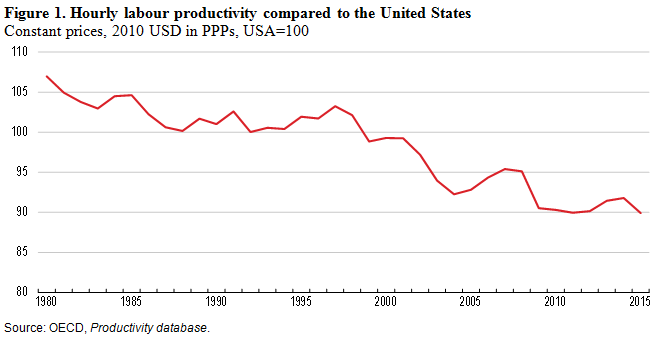
Switzerland is among the leaders in many global rankings including on R&D, innovation, infrastructure, universities and competitiveness. It is well integrated in global value chains, specialised in some high-value-added activities and home of many large multinationals. These factors should contribute to high, and rising, labour productivity. However, it has been falling behind other OECD countries, including the United States (Figure 1). Switzerland’s labour productivity still ranks amongst the top-10 OECD countries, but its growth performance has been poor in recent decades. During the 2000s its GDP per capita growth was driven mainly by an increasing employment rate, which reached record highs. That no longer has much scope to continue, which calls for focusing policy efforts on bolstering productivity to sustain Swiss living standards.

swissproductiv

The recently published OECD Economic Survey of Switzerland (OECD, 2017) studies Swiss labour productivity from a firm-level perspective using the KOF Swiss Innovation Survey database. The results point to a growing gap between Swiss frontier firms and the rest (Figure 2), similar to the pattern observed in other OECD countries (Andrews et al., 2016). This is particularly the case in the services sector.

Labour productivity growth is higher in firms that have introduced innovations and those with a larger share of high-skilled employees. However, fewer and fewer firms conduct R&D, while they spend more and more francs on it. This accentuates the concentration of R&D in a limited number of firms (around two-third of patents over 2006-11 originated from just 20 firms) and in pharmaceuticals (which accounted for nearly 30% of Switzerland’s business R&D in 2013). In addition, small firms report facing constraints in finding workers with needed skills.

This suggests the existence of a two-speed economy. A small segment of firms does extremely well. Others are suffering, driving the weak overall labour productivity growth outcome.

Swissprod2

Facilitating firm entry and exit are key ingredients for business dynamism and boosting productivity growth. Furthermore, entrepreneurship is not very high for the 18-24 year-old population. Several recommendations would boost the creation of innovative start-ups:

  • Promoting incubators at higher education institutions
  • Increasing the share of academic staff with entrepreneurial skills
  • Facilitating collaboration between firms through universities and research laboratories.

Risk-taking would also be facilitated – pushing up start-up rates – if Switzerland implemented a personal bankruptcy regime, allowing honest, hard-working entrepreneurs to have a second chance.

Bibliography:

Andrews, D., C. Criscuolo and P. Gal (2016), “The Best versus the Rest: The Global Productivity Slowdown, Divergence across Firms and the Role of Public Policy”, OECD Productivity Working Papers, No. 5, OECD Publishing, Paris, http://dx.doi.org/10.1787/63629cc9-en

OECD (2017), OECD Economic Surveys: Switzerland 2017, OECD Publishing, Paris, http://dx.doi.org/10.1787/eco_surveys-che-2017-en