Boosting export performance in Chile

by Antoine Goujard, Chile Desk, Economics Department

Chile’s export growth has disappointed over the past two decades. In particular, exports of goods and services – in volume – have only grown at 1.1% annually over 2009-17 and at around 2.0% for non-copper products and services, compared to 4.2% in the average Latin American country (Panels A and B).

Chile’s weak export performance reveals structural weaknesses. Beyond copper and copper-related products that are highly dependent on external demand, export growth has been weak in manufacturing and services sectors. At the same time, with low investment in innovation and skills, productivity gains have stalled (Panel C). Exports remain mostly natural-resource based (Panel D) and highly concentrated across products, firms and destinations, with SMEs participating little in international trade.

To enhance inclusive growth potential decisive policy efforts are needed to improve productivity and competitiveness, and broaden the export base. The 2018 OECD Economic Survey shows that while the implementation of the 2014-18 Productivity Agenda and measures to raise the efficiency of electricity markets have been positive steps, more efforts are needed to raise productivity in four key areas:

  1. Strengthening competition. Perceived market dominance that tends to reduce efficiency and raise rents, is among the worst in the OECD. Competition is limited in key sectors, such as telecommunications, maritime services and railways. The recent strengthening of the competition framework is welcome, but systematic reviews of competitive pressures are needed. Moreover, the guidelines issued by the OECD (2016b) should be used to review existing regulations from a competition perspective according to a set schedule, and pro-competitive and streamlining measures should be implemented rapidly.
  2. Simplifying the business environment. Administrative procedures, such as licenses and permits, are burdensome, notably for smaller and younger firms complicating entry of new businesses. Streamlining unnecessary and complex regulations would allow substantial productivity gains. Improving the digital procedures for firms (Escritorio Empresa), and focusing on ex-post controls for businesses that have low associated sanitary and environmental risks, would ease firm creation and growth. On the trade side, simplifying regulations of preferential trade agreements would help SMEs to go global. Going forward, the regulatory process should build on all stakeholders and strengthened ex-ante and ex post evaluations such as the new productivity assessments (OECD, 2016a).
  3. Increasing innovation and skills. Business investment in R&D and innovation is particularly weak, while entrepreneurial and managing skills are low and unequal. Increasing public support for R&D and innovation, and strengthening its evaluation, would help develop public-private links and ease R&D financing for SMEs. Additional technical assistance and mentoring for young and smaller firms, building on the recent Centros de Desarrollo de Negocios, would also support firm growth, innovation and access to export markets.
  4. Improving logistic and digital infrastructure. Investment in intermodal connections, railways and digital networks is needed to bridge connectedness gaps (OECD, 2017b). Developing national and local infrastructure strategies, integrating the regulation of public and private ports and better accounting for environmental damages in transport taxes and road pricing would ensure money is well spent. Fully integrating the single window mechanism for exports and imports (SICEX) with the domestic logistic infrastructure and with regional partners would deliver significant synergies and gains for exports.

xports and chile 2018

Find out more:

OECD (2018), OECD Economic Surveys: Chile 2018, OECD Publishing.

OECD (2017a), OECD Economic Outlook (November 2017), OECD Publishing.

OECD (2017b), Infrastructure Governance Review: Chile – Gaps and governance standards of public infrastructure, OECD publishing.

OECD (2016a), OECD Reviews of Regulatory Reform – Regulatory Policy in Chile, Government Capacity to Ensure High –Quality Regulation, OECD Publishing.

OECD (2016b), Competition Assessment Toolkit – Volume I: Principles, OECD Publishing.

Goujard, A. (2018), “Boosting export performance in Chile”, OECD Economics Department Working Papers, forthcoming, OECD Publishing.


Achieving an inclusive and sustainable recovery in Greece

by Mauro Pisu and Tim Bulman, Greece Desk, Economics Department

Greece is finally recovering from a deep depression. In 2017 GDP expanded by 1.3%, according to initial estimates, and is projected to accelerate to 2% in 2018 and 2.3% in 2019 (Figure 1). Labour market reforms have improved competitiveness and exports are leading the expansion. Overall the economy is becoming more open. Exports rose from 24% of GDP in 2008 to 34% in 2017. Employment is rising strongly while the external and fiscal imbalances are being addressed. Public finances are outperforming European Stability Mechanism (ESM) Stability Support programme’s targets, helping to restore fiscal credibility. Financial markets are taking notice, with bond spreads falling and agencies upgrading their ratings of Greece’s public debt.

Greece1.JPG

Despite these positive developments, the long crisis has left deep scars in the society that have yet to heal. GDP per capita is still 25% below its pre-crisis level. The public debt is still high. Wages are low. Though poverty has stabilised, it remains near a record high, especially among the young and families.

The OECD’s 2018 Economic Survey of Greece suggests that maintaining the reform momentum and strengthening reform ownership will be essential to sustaining the recovery and moving towards a more inclusive and prosperous society. Keeping the reform momentum is crucial to tackle the three key challenges highlighted in the 2018 Survey: Improving debt sustainability, sustaining job growth and reducing poverty, boosting investment.

The public debt has stabilised but at about 175% of GDP is still one of the largest in the world. A three-pronged strategy would place this on a downward path for the long-term (Figure 2). This includes: additional pro-growth reforms; large but realistic primary surpluses; and additional debt restructuring, as needed:

  • Pro-growth reforms, focusing on improving the functioning of public administration and product markets as well as boosting labour force participation, will do most to bolster long term GDP growth.
  • Maintaining the primary surplus above 2% of GDP into the long-term will be challenging but can be achieved through further broadening the tax base – by improving tax collection and reducing the informal economy – and improving spending effectiveness – by using spending reviews regularly and continuing the ambitious public administration reform.
  • As concerns debt restructuring, locking-in the currently low interest rates on concessional loans would reduce public debt below 80% of GDP by the 2050s, under prudent assumptions, if combined with additional pro-growth reforms.

Greece2.JPG

For Greece’s recovery to be inclusive, it must be rich in jobs. Greece’s recent labour market reforms have improved flexibility and supported job creation. However, over 1 million people are still unemployed, three-quarters for over a year. New jobs often pay the minimum wage, and are part-time or temporary. Reintroducing sectoral collective wage agreements should aim at maintaining the flexibility of the current system, ensuring wages align with productivity and better protecting individuals from labour market risks. They should cover broad working conditions and have no automatic extensions. Since small firms employ most workers, wage agreements need also to be flexible enough to take into account their specific circumstances.

The number of Greeks suffering from poverty doubled between 2010 and 2016, to almost 2.4 million on some measures, harming families with children the most. Recent reforms have already started to address this problem by better targeting social programmes. However, the many small and poorly targeted programmes and cumbersome administrative processes lower the effectiveness of and access to the welfare system. Progress towards better targeting social programmes and simplifying administrative processes should continue so as to create a fairer and more effective welfare system.

Investment has dropped by 60% since the onset of the crisis and has yet to recover, because of a mixture of weak demand, tight financial conditions and structural problems. The productive stock capital is now falling, dragging down GDP growth.

Recent reforms have already improved important areas of the investment climate, but Greece’s business environment still lags other countries. Further addressing product market restrictions, improving regulatory quality and transparency through Regulatory Impact Assessments, completing the land registry, and fully implementing the legislated insolvency reforms are priorities the OECD survey highlights.

Greece also needs to continue tackling the challenges facing its banking sector. Governance standards have improved drastically but these still need to become entrenched practices. Addressing the large stock of non-performing loans will require fully implementing out-of-court workout procedures and e-auctions, and strengthening temporary tax incentives to encourage the disposal of banks’ non-performing loans. Carefully phasing out capital controls, while preserving financial stability, will also be needed to restore access to finance.

References:

OCDE (2018) OECD Economic Surveys: Greece 2018 OECD Publishing.


A balancing act: Why inequality increased in the Nordics

Mr. Jon Pareliussen, Economist, Sweden/Finland desk, Economics Department

The Nordics are rightly renowned for being inclusive societies with low inequality compared to other OECD countries. However, some of the largest inequality increases over the past few decades took place in Sweden, Finland and Denmark. A newly released article  building on previous OECD work discusses how market forces, demographic trends and redistribution together shaped the income distribution of the Nordics.

It may seem like a paradox that the Nordics, which are very open economies, heavily integrated in global value chains and front-runners in the use of new technologies, have not seen even more widening distributions of market incomes. However, the extent to which skill-biased technological change and other forces widening the earnings distribution of workers will actually drive up inequality depends on a number of factors, and key policies and institutions in the Nordics play a dampening role. First, institutions such as unions and collective bargaining, employment protection legislation and minimum wages dampen the direct effect of market trends on earnings. Second, higher demand for skills are met by publicly-funded higher education, increasing the supply of skilled workers and thus holding back skills premiums. Third, a widening earnings distribution among workers coincided with increasing employment, limiting the overall effect on inequality.

Nordic1.JPG

With a relatively modest overall impact from market forces, explanations for increasing inequality must be sought elsewhere:

  • Demographic trends have been relatively strong drivers of inequality in the Nordics. Household structure, with more single-headed households has widened income dispersion in Denmark, Finland, Norway and Sweden. Ageing has increased inequality significantly in Finland, and immigration has increased inequality in Norway, Denmark and Sweden.
  • Redistribution through taxes and transfers has weakened significantly in Denmark, Finland and Sweden, notably due to less insurance transfers (i.e. unemployment, sickness, disability insurance) and only partially offset by more assistance (i.e. means-tested) transfers. Income taxes have played a less important and more heroegneous role, as progressivity increased in Sweden while it decreased in Denmark and Iceland.

Technological and demographic pressures are set to continue going forward, and these challenges need to be embraced. Continued flexibility and constructiveness of the social dialogue and improvements to education are essential to seize opportunities from technological change and avoid a widening wage distribution. Making social insurance and welfare transfers more flexible and agile would improve workers’ protection in a rapidly changing world of work. Improving benefit system design so that work always pays, notably in Denmark and Finland, and linking benefits to real-time income registries are important steps to this end.

The Nordics demonstrate that equity and efficiency can be compatible if incentives are right. Low inequality and strong safety nets can even be an advantage in today’s globalised world, which requires constant adaptation. Reaping the full benefits from globalisation and technological progress requires broad support, which is easier to muster when the social dialogue is constructive and representative, when everyone is given opportunities to fulfil their potential, risks are shared and losers compensated.

References:
Pareliussen, J. K., Hermansen, M., André, C. and Causa, O. (2018), Income Inequality in the Nordics from an OECD perspective, Nordic Economic Policy Review 2018.


Will the inflation genie escape the bottle? New evidence on globalisation, competition and inflation

By Dan Andrews, Peter Gal and William Witheridge, Economics Department

Markets and commentators are speculating that there may be a sustained pick-up in inflation in the United States, after years of subdued price pressures. Along with continued solid US jobs growth and low unemployment, there are tentative signs of higher wage growth and the fiscal stimulus will also boost short-term growth. Global growth is also getting stronger (OECD, 2018a).

As well as these recent developments, longer-term worldwide trends which have kept inflation generally low since the mid-1990s may also be reversing. In particular, globalisation appears to have stalled since the crisis, aggregate demand in strengthening and output gaps have closed or are generally close to zero in most major countries. Moreover, there is mounting evidence of rising market power in services sectors. Together, these trends risk letting the inflation genie out of the bottle.

Declining inflation in many countries over the past few decades at the same time as rising global competition has led to a debate on the importance of globalisation for domestic inflation. Auer, Borio and Filardo (2017) at the BIS have argued that rising GVC integration has accentuated the importance of global factors – particularly global economic slack – for domestic inflation. However, recent research at the ECB (Tagliabracci, Osbat and Koester, forthcoming) and at the US Federal Reserve (Yellen, 2017) has disputed this conjecture.

Figure 1 shows that global value chain (GVC) integration expanded significantly from 1995 until the crisis, while inflation remained relatively subdued. In the post-crisis period, GVCs flattened off and remained around the pre-crisis peak, while producer price inflation has fallen dramatically and remains very low on average across industries for our sample of countries.*

Figure 1

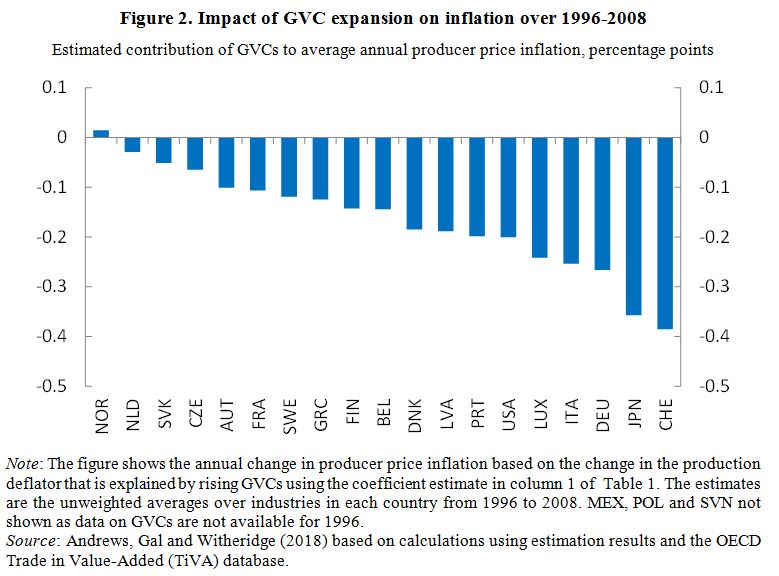
Motivated by this pattern, our new analysis of prices and globalisation (Andrews, Gal and Witheridge, 2018) goes beyond existing research by using recently released cross-country OECD data on prices and GVCs by industry, rather than at the country level, which allow us to control for time-varying country-specific and global shocks. We find that stronger Backward GVC Participation – that is, domestic producers relying more on foreign value added content – is associated with lower producer price inflation at the industry level. For example, we estimate that the rise in GVCs from the mid-1990s up to the crisis reduced annual producer price inflation by 0.15 percentage points on average, but this effect is more than double in some OECD countries (Figure 2).

Figure 2.JPG

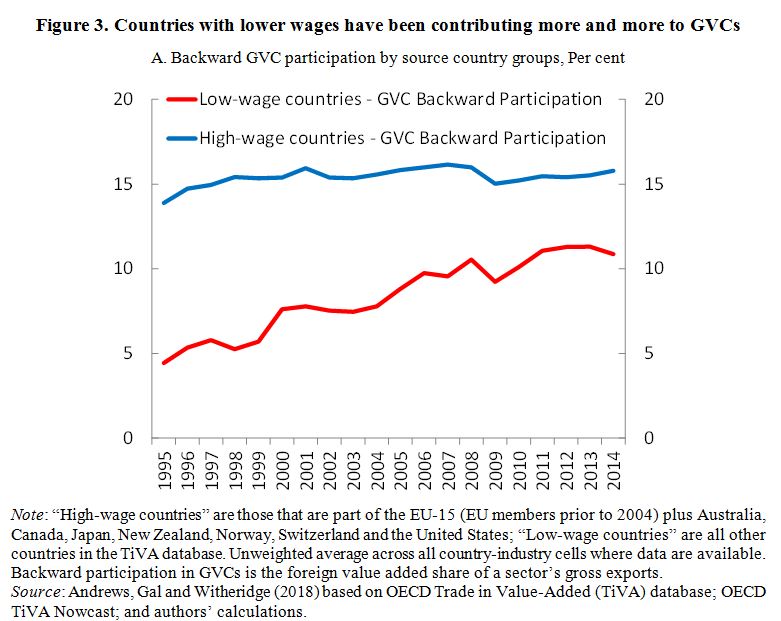
Confirming the existence of a cost-reduction and wage moderation channel, we also show that higher backward GVC participation is associated with lower wages and rising productivity in the importing countries and industries, especially when low-wage countries are integrated in their supply chains. This channel is likely to have contributed to lower inflation in recent years as the structure of the source (i.e. supplying) countries in GVCs has moved increasingly towards low-wage countries (Figure 3), despite a stall in the overall level of GVC integration (Figure 1). Therefore, inflation in advanced economies could remain low if the composition of GVCs continues to shift towards low-wage countries.

Figure 3.JPG

Moreover, we find that a high level of GVC integration can also dampen producer price inflation by accentuating the impact of global economic slack on domestic inflation. This provides new industry-level evidence to support the finding of Auer et al (2017) who use aggregate data covering the pre-crisis period. We show this by using a similar approach combining bilateral industry-level GVC and national output gap data to measure changes in global slack over time.

This implies that weak global demand has a larger disinflationary impact when GVC participation is higher. For example, given our sample of countries facing an average global output gap of -1.5 per cent in 2014, we estimate that annual producer price inflation was on average 0.25 percentage points lower in 2014 than for 1996 GVC levels. This figure is more than 0.5 percentage points, however, for countries that experienced a particularly large rise in GVC participation. But with slowing expansion of GVCs since the crisis, coupled with stronger aggregate demand and output gaps closing in most countries, this could lead to greater inflationary pressures in the medium term.

The third longer-term trend posing an upside risk to inflation is declining competition and market contestability. We exploit harmonised cross-country firm-level data to show an increasing trend in mark-ups, which suggests rising market power in services sectors (Figure 4). This upward trend in mark-ups is consistent with other estimates for the United States (De Loecker and Eeckhout, 2017) and other OECD countries (Calligaris et al, 2018). In turn, in these market services sectors we find a significant positive correlation between producer price inflation and mark-ups within industries since the early 2000s. This leads us to conjecture that if market power continues to rise it may pose a further risk to letting the inflation genie out of the bottle.

Figure 4.JPG
This analysis suggests that the expansion of GVCs facilitated by trade liberalisation and advances in technology has put downward pressure on producer prices, with potential implications for monetary policy. Looking forward, a continuation of the stalling globalisation observed since the crisis poses an upside risk to future inflation. This provides a further reason to resist the rising threat of trade protectionism in the global economy.

In addition, if more intense competition in product and labour markets contributed to global disinflation in over recent decades (Rogoff, 2003), then it follows that waning structural reform ambition (OECD, 2018b) – against the backdrop of strengthening global growth – could lead to inflationary pressures. Given the growing importance of ICT-based activities in the economy, as well as evidence of increasing market power in those industries, policy efforts to adapt anti-trust and pro-competitive market regulations to the digital age will not only bring benefits to long-run productivity growth but will also be desirable from a monetary policy perspective.

References:

Andrews, D.,  P. Gal and W. Witheridge (2018), “A Genie in a Bottle? Globalisation, Competition and Inflation”, OECD Economics Department Working Papers, No. 1462.

Auer, R., C. Borio and A. Filardo (2017), “The globalisation of inflation: The growing importance of global value chains”, BIS Working Papers, No. 602, January.

Calligaris, S., C. Criscuolo and L. Marcolini (2018), “Digital and market transformations”, OECD Science, technology and industry working papers, forthcoming.

De Loecker, J. and J. Eeckhout (2017), “The Rise of Market Power and the Macroeconomic Implications”, NBER Working Papers No. 23687.

* The sample of countries are: Austria, Belgium, Czech Republic, Denmark, Finland, France, Germany, Greece, Italy, Japan, Luxembourg, Latvia, Mexico, Netherlands, Norway, Poland, Portugal, Slovenia, Slovak Republic, Sweden, Switzerland and the United States.


Unblocking the productivity potential of local businesses in Ireland

By Yosuke Jin and Ben Westmore, Ireland Desk, OECD Economics Department.

Irish GDP growth made headlines recently due to enormous upward revisions (e.g. + 25.6% for the sole year of 2015) related to the activities of a small group of multinationals. This raises the question of how much Irish productivity relies on multinational companies alone. In fact, while it has not made headlines as much as the GDP revisions, the divergence in productivity performance among firms in Ireland over recent years is particularly striking. This matters a lot for the sustainability of Irish living standards.

New firm-level analysis undertaken in tandem with the OECD Economic Survey of Ireland 2018 finds that the majority of businesses in Ireland have actually experienced falling productivity since the mid-2000s (Department of Finance, 2018). This analysis also identifies rising dispersion in the productivity between top-performing firms and other firms in most industries (Department of Finance, 2018: Figure 1), with most top-performing firms being multinational enterprises (MNEs). Indeed, a rise in aggregate productivity observed in official statistics has relied on a small group of very large successful firms, most likely the same ones whose activities have been chiefly responsible for the eye-catching GDP outturns of recent years.

Capture.JPG

At first glance, the efficiency of resource allocation in Ireland appears to be very high (Figure 2). However, this result owes largely to the presence of MNEs that can raise a huge amount of resources from different channels. Once the MNE-dominated sectors have been excluded, the efficiency of resource allocation in the Irish economy is greatly reduced and is close to the average of other OECD countries (Figure 2).

Ireland.JPG

Recent OECD studies show that non-viable firms (i.e. those kept alive by forbearance loans but otherwise insolvent) have reduced the investment and employment growth of healthy businesses in many OECD countries over the past decade (Adalet McGowan et al., 2017). In Ireland, SME default rates are among the highest in the euro area countries, while forbearance has frequently been granted to defaulted loans, which instead could be reallocated to enable highly-productive businesses to expand (OECD, 2018). This could be a major explanation of the lower productivity of domestic firms.

Another key channel through which productivity gains occur is via knowledge spillovers from top, “frontier” firms. Given Ireland’s high share of multinational enterprises, there is potential for virtuous productivity spillovers from high-productivity foreign firms to local businesses. However, such spillovers cannot be taken for granted. Other firm-level empirical analysis undertaken in tandem with the OECD Economic Survey of Ireland 2018 finds that such knowledge spillovers are overall limited in Ireland and local firms are even crowded-out by MNEs in some instances (Di Ubaldo, Lawless and Siedschlag, 2018).

What explains these limited spillovers? First, trade linkages, expressed as the intensity of supply chains between foreign- and locally-owned firms, are weak (OECD, 2018). Moreover, the productivity gains of such linkages can only be fully realised if local firms have the capacity to absorb the new ideas and technologies utilised by frontier firms, which requires investment in knowledge-based capital and human capital by local firms. For example, the above mentioned analysis shows that trade linkages produce positive productivity spillovers for those local firms that exhibit high absorptive capacity, captured by R&D investment (Di Ubaldo, Lawless and Siedschlag, 2018).

Could local firms take greater advantage of the performance of multinational enterprises? Policymakers should promote reforms that encourage the absorptive capacity of local businesses. At present, the capacity of local firms to absorb and implement new technologies is impeded by relatively weak managerial skills. This partly reflects the low proportion of workers participating in lifelong learning activities. With burgeoning skill demand, there should be an increase in the share of training funding to those in employment. Innovation and the ability for Irish firms to fully utilise new technologies is also weakened by low research and development activities. There is scope to reorient innovation policy to better promote the research intensity of local firms. In particular, targeted public grants for business research and development could be increasingly used, as it would better reach local entrepreneurs that may be in a loss-making position and hence less swayed by tax exemptions on research funding.

Finally, the OECD Economic Survey of Ireland 2018 argues that, beyond spillovers, the productivity potential of local businesses can be raised through reducing regulatory barriers to entrepreneurship and the costs of business failure. Access to finance for young firms needs to improve as well and will benefit from further efforts that mend the health of the banking sector and raise the efficacy of state-supported lending initiatives. Further improvements in Irish infrastructure will also promote firm growth. The government plans to increase capital spending significantly over the coming four years and the projects undertaken must continue to be carefully prioritised through evidence-based evaluation of those with the highest returns. To do this more effectively, systematic collection of information on the performance of existing assets is crucial.

References:
Adalet McGowan, M., D. Andrews, and V. Millot (2017), “The Walking Dead?: Zombie Firms and Productivity Performance in OECD Countries”, OECD Economics Department Working Papers, No. 1372, OECD Publishing, Paris.
Department of Finance (2018), “Patterns of firm level productivity in Ireland”.
Di Ubaldo, M., M. Lawless and I. Siedschlag (2018) “Productivity spillovers from multinational activity to indigenous firms in Ireland”, ESRI Working Paper 587, March 2018.
OECD (2018), OECD Economic Surveys: Ireland 2018, OECD Publishing, Paris.


Costa Rica: Distribuir los beneficios del crecimiento más ampliamente

CRI cover ESP smallPor Sonia Araujo y Lisa Meehan, Sección de Costa Rica, Departamento de Economía de la OCDE
La economía de Costa Rica es sólida y continúa convergiendo hacia los niveles de vida de los países miembros de la OCDE (Figura 1). Si bien la productividad ha repuntado recientemente, sigue habiendo una gran brecha con respecto a la de los países de la OCDE. Las tasas de empleo son bajas y el desempleo sigue por encima de los niveles previos a la crisis, afectando predominantemente a los jóvenes y a quienes están poco calificados. Como resultado, y en contra de la tendencia general en América Latina, la informalidad y la desigualdad no están disminuyendo (Figura 2). La OCDE, en su reciente Estudio Económico de Costa Rica, encuentra que las regulaciones anticompetitivas y la alta segmentación del mercado laboral obstaculizan la materialización plena de oportunidades para hacer que el crecimiento sea más inclusivo. Para poner en marcha un “círculo virtuoso” de crecimiento inclusivo será necesario adoptar reformas en varias áreas de políticas que presentan oportunidades beneficiosas para todos, en términos de equidad y mejoras de la productividad.

CRIblog2018launchFig1-2esp

En primer lugar, existen obstáculos importantes al emprendedurismo, amplias exenciones antimonopolio y alto control estatal en muchos sectores. Aportarían grandes beneficios de crecimiento medidas orientadas a mejorar la gobernanza de las empresas estatales según las normas de la OCDE, establecer ventanillas únicas para el registro y la concesión de licencias, simplificar los procedimientos de insolvencia, eliminar las exenciones antimonopolio y mejorar la facilitación del comercio.

Segundo, Costa Rica debe implementar una estrategia integral para combatir la informalidad, que incluya una mayor exigencia al cumplimiento con las obligaciones de pago de contribuciones y la continuación de la reducción de la compleja estructura del salario mínimo, lo que agrava los costos de las empresas y desalienta la formalización laboral. Costa Rica debe de continuar reduciendo su compleja estructura actual de 23 salarios mínimos bajo categorías sectoriales, ocupacionales, de niveles educativos y de habilidades.

En tercer lugar, la educación debería seguir siendo una prioridad política como estrategia para pasar a niveles de ingresos más altos y responder al cambio estructural en curso hacia actividades de mayor valor agregado. Pero Costa Rica obtiene muy poco de su inversión sustancial en educación. Con casi un 8% del PIB, el gasto en educación es más alto que en todos los países de la OCDE. Sin embargo, los resultados de las pruebas PISA revelan que un tercio de los estudiantes carecen de competencias básicas y los resultados están fuertemente influenciados por los antecedentes socioeconómicos. Los recursos deben canalizarse a la educación secundaria, donde hay crecientes presiones demográficas y una necesidad de aumentar el acceso y la educación, y hacia la educación y atención infantil, para que todos los niños puedan desarrollar plenamente su potencial. Se debe brindar un apoyo más focalizado y dirigido a los estudiantes en riesgo desde el principio del proceso educativo. En general, el gobierno debería hacer la transición del enfoque actual basado en los recursos y el financiamiento hacia uno basado en el logro de resultados, así como establecer una meta clara y verificable basada en el desempeño para medir el éxito de sus políticas educativas.

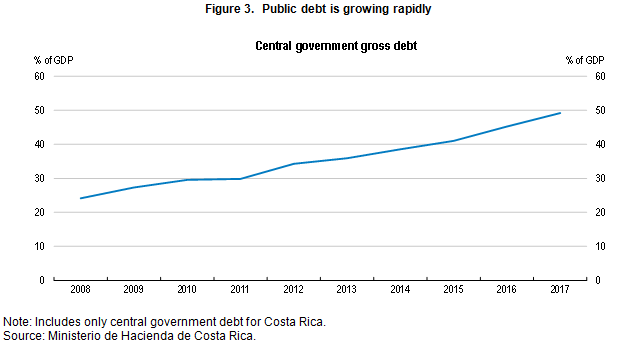
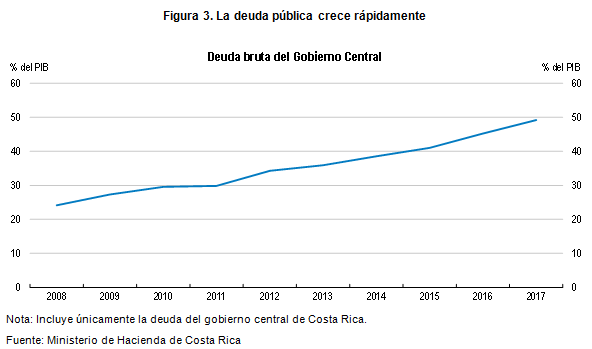
Pero la mayor amenaza para el crecimiento y los niveles de vida en el mediano plazo sigue siendo la sostenibilidad fiscal. El déficit presupuestario superó el 5% del PIB en los últimos cinco años. Los esfuerzos recientes para aumentar la recaudación de impuestos no han reducido el déficit presupuestario, debido al amplio uso de la asignación obligatoria de fondos, la fragmentación del sector público en instituciones autónomas y las obligaciones de gasto vía legislación. Como resultado, la deuda del gobierno central se ha disparado de menos del 25% del PIB en 2008 al 49% en 2017 (Figura 3). Se necesita con urgencia un paquete de reforma fiscal integral que permita estabilizar la relación de deuda a PIB. Existe un amplio margen para recaudar ingresos adicionales ampliando la base tributaria y continuando en la lucha contra la evasión y elusión fiscal. Sin embargo, el aumento de los ingresos fiscales no ayudará a contener el déficit, a menos que se restrinja la marcada asignación de recursos con destinos específicos. Reformar la estructura salarial del sector público, fortalecer el marco presupuestario con una nueva regla fiscal que sea operativa y mejorar la gestión de la deuda, son medidas que contribuirían a equilibrar el presupuesto.

CRIblog2018launchFig3esp

Referencias
Estudios Económicos de la OCDE: Costa Rica 2018


Costa Rica: Sharing the benefits of growth more widely

CRI cover engBy Sonia Araujo and Lisa Meehan, Costa Rica Desk, OECD Economics Department

Costa Rica’s economy is strong and continues to converge towards OECD living standards (Figure 1). Although productivity has picked up recently, a wide gap relative to the OECD remains. Employment rates are low and unemployment remains above pre-crisis levels, hitting predominantly youth and the low skilled. And against the general trend in Latin America, informality and inequality are not declining (Figure 2). The OECD 2018 Economic Survey of Costa Rica finds that anti-competitive regulations and high labour market segmentation hinder the full realisation of opportunities to make growth more inclusive. Setting in motion a ‘virtuous cycle’ of inclusive growth will require reforms across several policy areas that present win-win opportunities in terms of equity and productivity improvements.

CRIblog2018launchFig1-2

First, there are high barriers to entrepreneurship, anti-trust exemptions and state control in many sectors. Improving state-owned enterprises’ governance according to OECD standards, establishing one-stop shops for business registration and licensing, streamlining insolvency procedures, removing anti-trust exemptions and enhancing trade facilitation would bring large growth benefits.

Second, Costa Rica should implement a comprehensive strategy to fight informality, including greater enforcement of compliance and by continuing to reduce the complex minimum wage structure, which increases firms’ costs and discourages job formalisation. Costa Rica should continue to simplify its complex web of 23 sectoral, occupation, education attainment and skill minimum wages.

Third, education should remain a policy priority as a strategy to move to higher income levels and respond to the ongoing structural change towards higher value-added activities. But Costa Rica obtains too little from its substantial investment in education. At almost 8% of GDP, education spending is higher than in all OECD countries. However, PISA results reveal that one third of students lack core competencies and outcomes are strongly influenced by socio-economic background. Resources need to be channelled to secondary education, where there are growing demographic pressures and a need to increase access, and early childhood education and care, in order for all children to fully realise their potential. More focused, targeted support should also be given to students at risk early on. Overall, the government should move from the current focus on resources and funding to outcomes, and establish clear and verifiable performance based targets against which to measure the success of its education policies.

But the major threat to growth and living standards in the medium term continues to be fiscal sustainability. The budget deficit has exceeded 5% of GDP for the past five years. Recent efforts to increase tax collection have not reduced the budget deficit due to the extensive use of earmarking, public sector fragmentation into autonomous agencies and spending mandates. As a result, central government debt has soared, from less than 25% of GDP in 2008 to 49% in 2017 (Figure 3). A comprehensive fiscal reform package is urgently needed to stabilise the debt-to-GDP ratio. There is ample room to raise additional revenue by broadening the tax base and continuing to fight tax evasion and avoidance. However, raising tax revenue will not help to contain the deficit unless strong earmarking and mandated spending are restricted. Reforming public-sector compensation, strengthening the budgetary framework with a new, operational fiscal rule and improving debt management would help to balance the budget.

CRIblog2018launchFig3

References:

OCDE (2018), OECD Economic Surveys: Costa Rica 2018, OECD Publishing,


Thailand 4.0: boosting productivity

By Hidekatsu Asada, Head of South East Asia Desk, Economics Department.

Thailand has made commendable socio-economic progress since the 1970s and has set itself the goal of joining the group of high-income countries by 2036. To make that happen, the government has spelled out a Thailand 4.0 vision that involves a transformation to a more productivity- and technology-driven economy. This is the next step – after Thailand 1.0 (accumulation of capital and labour inputs led by the agricultural sector), Thailand 2.0 (light industry) and Thailand 3.0 (heavy industry).

Thailand’s historical competitive advantage in labour-intensive manufacturing is being eroded by higher wage costs that partly reflect the acceleration of ageing. Gains from imported technology are contributing less to productivity growth, while high-technology and knowledge-intensive activities, domestic innovation, investment in knowledge-based capital and human resource development have become increasingly important, as discussed in the Initial Assessment Report of the Multi-dimensional Review of Thailand (OECD, 2018).

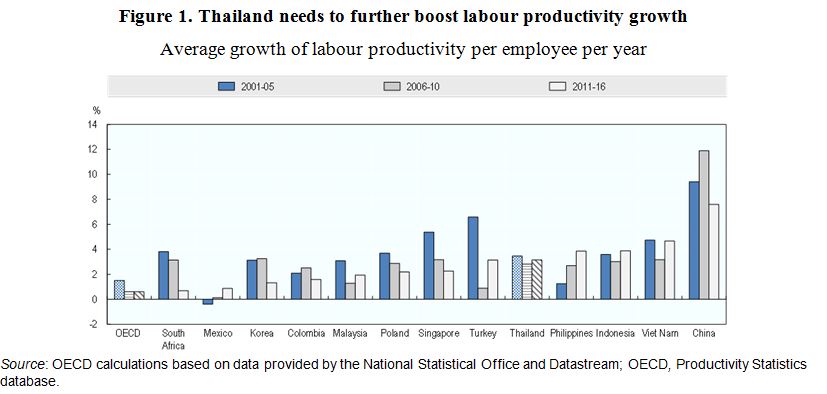
Since the first half of the 2000s, Thailand’s labour productivity growth has averaged 3%. However, in recent years, like in many OECD countries, it has not quite recovered to pre-global financial crisis rates (Figure 1), partly due to weak demand arising from lacklustre global trade, which slowed capital formation and the associated productivity gains. Intensified competition for foreign direct investment from China, the Philippines and Viet Nam has also held back investment, as have domestic political uncertainty, delays in public investment projects and widening skills gaps.

Thailand 2.JPG

Historically, structural reforms have played an important role in Thailand’s economic transformation, with trade and investment liberalisation and business-friendly regulatory reforms encouraging participation in global value chains. However, over the past decade, limited structural reform and capital investment have held back productivity growth and improvements in well-being.

In recent years, economic growth has started to regain momentum, helped by a pick-up in global trade, which has supported exports, and by a substantial public infrastructure investment programme. This upturn is expected to continue in the near future, presenting a great opportunity to firmly implement extensive structural reforms to boost Thailand’s economic potential. These reforms need to include:

  • Developing human capital by improving education performance and strengthening technical and vocational education and training, as well as encouraging life-long learning and training to address skills mismatches.
  • Promoting innovation by enhancing collaboration between the government, the business sector and academia.
  • Improving the policy framework to encourage entry of innovative entrepreneurs and medium-sized enterprises by facilitating access to finance, streamlining licensing procedures and reducing transaction costs by increasing the use ICTs such as the QR payment system.
  • Furthering regional integration by reducing barriers to the entry of foreign firms, such as caps on the foreign ownership in services sector.

The government has recognised the importance of these structural reforms, all of which are enshrined in Thailand 4.0. However, to adequately implement these reforms and address these cross-cutting issues, improved co-ordination and rigorous performance evaluations are needed across all planning and implementation agencies.

Reference
OECD (2018), Multi-dimensional Review of Thailand: Volume 1. Initial Assessment, OECD Development Pathways, OECD Publishing, Paris.


Thailand’s achievements and challenges as it aspires to become an inclusive high-income country

By Hidekatsu Asada, Head of South East Asia Desk, and Vincent Koen, Head of Division, Economics Department

From a feudal trading hub connecting South with East Asia in the 18th and 19th centuries, Thailand has developed into a rapidly modernising and more urban economy. The second half of the 20th century saw the rapid expansion in manufacturing and services, which underpinned its transformation into an upper-middle-income country (Figure 1).

Thai achievements and challenges 1

To achieve high-income country status by 2036, as is Thailand’s ambition, growth will need to rise from its current pace of around 4% to a cruising speed of 5-6% per annum. At the same time, Thailand’s pursuit of the United Nations 2030 Sustainable Development Goals reflects its commitment to make this growth more inclusive and environmentally sustainable.

The constraints and challenges Thailand faces in this process are discussed in the OECD’s first comprehensive evaluation of Thailand’s socio-economic development, the Initial Assessment report of the Multi-dimensional Review of Thailand (OECD, 2018).

Compared to countries at a similar level of development, Thailand performs relatively well in most well-being dimensions. Performance is notably strong in terms of life evaluation and social security (in particular thanks to the Universal Health Care programme implemented from 2002). The picture is more mixed, however, when it comes to dimensions such as the environment, education and skills, or work. For instance, while unemployment is very low, working conditions are worse than might be expected given Thailand’s level of development (Figure 2).

Thai achievements and challenges 2

The Initial Assessment report identifies a number of key priorities for policymakers in Thailand.

First, structural change is needed to create more quality jobs and overcome regional imbalances. The necessary structural reforms encompass addressing infrastructure bottlenecks, promoting innovation and enhancing competition. Improving education and life-long skills training is key in this regard.

Second, Thailand’s ageing population and pervasive labour informality make better provisioning and funding of social protection essential. The fragmented social security system does not adequately protect the large informal and precariously employed labour force, and many elderly are at risk of poverty. While public finances are presently in robust shape, gradual revenue increases will be needed to fund rising pension and healthcare outlays arising from a rapidly ageing population and declining workforce. Inducing greater formal labour market participation will be key to expanding social protection and boosting tax revenue.

Third, environmental conservation and disaster risk management should be prioritised. Thailand has to enhance the management of its natural resources to safeguard sustainable development. Rapid urbanisation has put pressure on water resources and quality, and the effectiveness of water management must be improved.  Insufficient disaster prevention readiness in the face of recurrent droughts and floods also entails significant costs. Measures to better mitigate and adapt to climate change are necessary to meet agreed international commitments and minimise economic and social losses.

Last not but least, Thailand’s sustainable and inclusive development requires good governance and effective public service delivery. Good governance is essential to enable markets to provide goods and services in an efficient manner, with minimal diversion of resources to less productive uses. Challenges in the public sector such as the gap between planning and implementation, and insufficient inter-ministerial co-ordination and public participation, must be overcome for the government’s aspiration to high-income-country status while ensuring inclusive growth and sustainable development to be realised.

Reference

OECD (2018), Multi-dimensional Review of Thailand: Volume 1. Initial Assessment, OECD Development Pathways, OECD Publishing, Paris.


A new perspective on inequality: The income distribution across advanced countries

By Mikkel Hermansen, Economist, OECD Economics Department

What is the relevant perspective for evaluating people’s living standards in advanced countries? According to standard assessments of inequality it is fellow citizens within the country. In a recent paper (Hermansen, 2017), I argue that an interpersonal income distribution across advanced countries can provide a useful complement to comparisons of relative inequality across countries. For instance, the United States is well-known to be more unequal than Sweden, but how do the incomes of the bottom and top of the distributions across these and other countries compare directly in PPP terms?

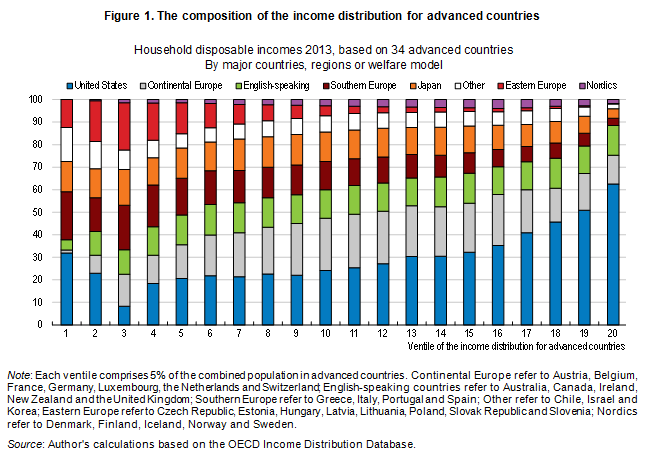
Figure 1 illustrates how countries (grouped by regions or similar welfare models) are spread across the income distribution for advanced countries. Because this is a homogeneous set of countries, almost all subgroups are represented across the distribution from the bottom 5% to the top 5%. The United States stands out as it composes more than half of the top 5% of the aggregate distribution, but also makes up more than 30% of the bottom 5%. By contrast, the egalitarian Nordic countries are concentrated in the upper half, but nearly absent from the tails.

Fig 1 new perspective inequality -hermansen

Inequality across all individuals living in advanced countries reaches 37 based on the Gini index, which has a scale going from 0 (perfect equality) to 100 (all income accruing to one person). This is relatively high, corresponding to the inequality levels observed in Israel and Estonia, but lower than inequality within the United States.

Inequality across advanced countries has increased by almost 3 Gini points from the mid-1990s to 2013, roughly in two phases, first from the mid-1990s to the mid-2000s and then again in the aftermath of the crisis. This was mainly driven by the top and bottom 10% drifting apart, as can be seen from the growth incidence curve in Figure 2. This curve relates incomes across the aggregate distribution for advanced countries in 2013 to the same percentile in 1995, ignoring changes in country composition across the distribution (as illustrated in Figure 1).

Fig 2 new perspective inequality -hermansen

The growth incidence curve is a powerful and popular tool in inequality studies since it can provide granular information not available from measures such as the Gini. In the paper, I present a new approach to decompose the growth incidence curve into a within- and between-country component, allowing further granularity of within- and between-country inequality changes. For advanced countries, the between-country curve is almost flat from 1995 to 2013, meaning little change in inequality when replacing all households’ income with average income of their country of residence. This implies that almost all of the rise in inequality across advanced countries is driven by the well-known rise in inequality within countries, reflected by the parallel shape of the within-country component and the growth incidence curve in Figure 2.

References

Hermansen, M. (2017), “The global income distribution for high-income countries”, OECD Economics Department Working Papers, No. 1402, OECD Publishing, Paris, http://dx.doi.org/10.1787/65206dc1-en.