Structural Policy Indicators Database for Economic Research: SPIDER on the web

by Égert Balázs, Peter Gal and Isabelle Wanner, OECD Economics Department

spider5.pngResearchers looking for empirical evidence on the relative impact of policy and non-policy drivers of economic growth know how much time and efforts can go into assembling a large database of policy variables and other determinants covering as many countries and years as possible. Even when such database can be patched-up from tapping into earlier studies, up-dating the series often requires going through a vast number of different data sources. Thanks to a recent OECD initiative, such task could be greatly facilitated from now on. A new OECD’s Structural Policy Indicators Database for Economic Research (SPIDER) is now available online and provides a broad range of data to researchers in ready-to-use formats to facilitate empirical/econometric research investigating the nature and the impact of structural policies. Available as a text file (TXT), STATA (.dta) and Eviews (.wf1) formats, the database includes about 500 policy and institutional indicators from almost 50 different OECD and non-OECD data sources. The policy variables stored in the database are annual or less frequently available (every five years or only once). The database will be updated on a yearly basis.

The database covers the following broad categories of policy variables: i) legal infrastructure and institutions describe features of the political system, the underlying legal institutions and indicators measuring the quality and various aspects of public governance; ii) framework condition policies include policies that condition the environment in which firms operate and make decisions such as the product market regulation (PMR/ETCR) indicators, the competition law and policy (CLP) indicator and a number of labour market institutions; iii) specific policies cover policies relating for instance exclusively to specific segments of the labour market (older workers, women or the youth) and include family benefits, policies influencing decisions to retire. Examples of other specific policies are measures primarily designed to support R&D investment or exports. Table 1 gives an overview on the main categories of variables included in SPIDER.

spidertable

Aimed primarily at helping researchers to kick-start empirical analysis by keeping the costs of assembling the required data very low, the usefulness of the SPIDER database to economic research can be demonstrated through the range of possibilities it offers in terms of assessing the impact of institutions and policies in growth regressions. For instance, it allows for runing cross-country time series growth regressions for OECD countries including indicators of product and labour market regulations with about 20 to 30 years of data. As an illustration, the scope of variables that can be included in several variants of growth regressions.

The analysis can also be extended to non-OECD countries, although in that case the time series dimension of the data will likely to be shorter and regulations and institutions will be measured by indicators available from non-OECD data sources. Finally, for purely cross-sectional regressions, with a very large set of indicators that also capture the geographical, social and cultural aspects, the number of observations reach about 90. These examples indicate the scope of the database for such an exercise.

Aside from facilitating cross-country/time-series empirical analysis, the new database is a one-stop shop where a large set of internationally comparable policy variables can be found and used to gauge in a more descriptive manner the magnitude of structural reform actions in specific countries and areas over a broad range.

References:

The database is described in more detail in Égert, Gal and Wanner (2017), “Structural policy indicators database for economic research (SPIDER)”, OECD Economics Department Working Paper No. 1429.


The UK productivity puzzle through the magnifying glass: A sectoral perspective

Rafał Kierzenkowski, Gabriel Machlica and Gabor Fulop, Economics Department.

Labour productivity has flatlined since the global financial crisis, which contrasts with its recovery profiles from past recessions over the last decades (Figure 1).  The productivity shortfall, defined as the gap between actual productivity and the level implied by its pre-crisis trend growth rate, reached nearly 20% at the end of 2016. This unprecedented levelling off represents the so-called productivity puzzle, with the level of output being surprisingly weak relative to high total hours worked in the economy. At the aggregate level, the weakness in productivity is driven by subdued investment developments and total factor productivity, and this underperformance appears to be mainly structural rather than cyclical.

Fig1.JPG

Using disaggregated data at the sectoral level provides additional insights about the determinants of the productivity puzzle, as shown in a recent OECD Economics Department Working Paper (Kierzenkowski et al., 2018). There has been a marked increase in the dispersion of productivity performance across UK sectors since the crisis, with sectors lagging behind becoming even more disconnected from the best-performing sectors (at a given point in time). Moreover, the aggregate productivity slowdown appears to be mainly driven by the weakness in productivity within each sector, which suggests sector-specific determinants of the productivity shortfall.

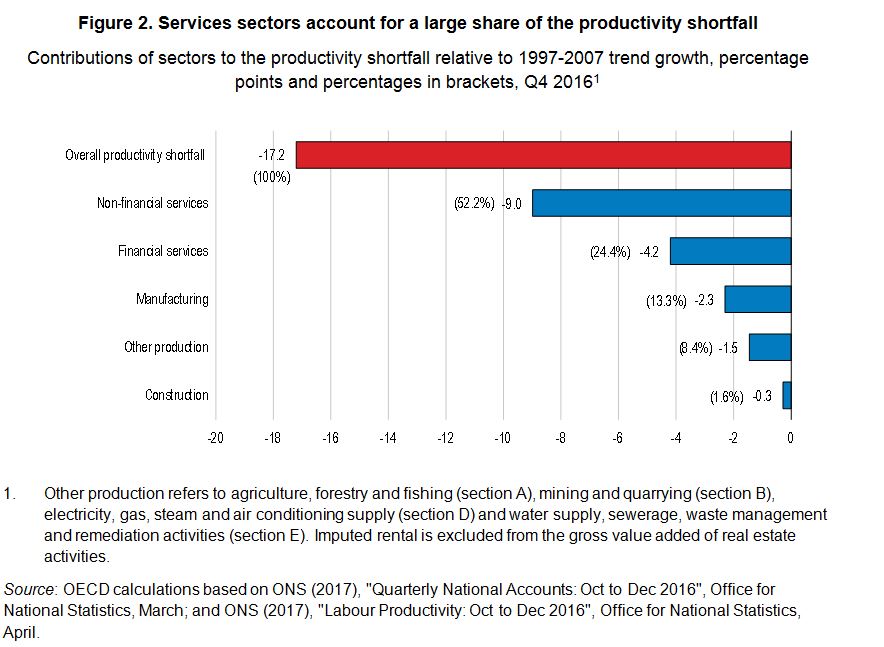
To investigate the issue further, it is possible to calculate the contribution of each sector to the aggregate productivity shortfall since 2007. Such calculation shows that half of the gap is explained by non-financial services (with information and communication being the largest contributor), a fourth by financial services, and another fourth by manufacturing, other production and construction (Figure 2). All but non-financial services and the construction sectors contribute disproportionately to the productivity shortfall compared to their shares in overall output and hours worked of the UK economy.

Fig2.JPG

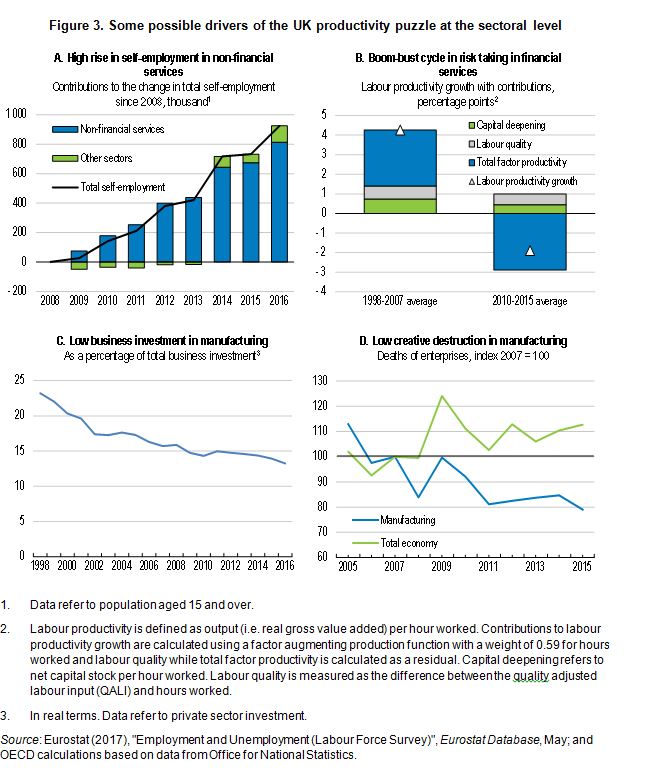
In non-financial services, large increases in self-employed with no employees may have reduced the economies of scale and scope of organised work (Figure 3, Panel A), while the production of the sector has become less capital-intensive at the same time. Greater mismatches between changing skills and created jobs may have also curbed productivity growth, in particular in the information and communication sector where many high-skilled occupations have been created but where increases in labour quality have been comparatively weak.

In financial services, stagnant labour productivity is mainly linked to reduced risk-taking and leverage, as reflected by the decline in total factor productivity following its steep increases in the run-up to the crisis (Figure 3, Panel B).  Although the measurement of output of the financial sector is difficult, this finding is corroborated by the relative size of the financial sector, which was expanding quickly to become significantly larger than in the rest of the G7 in the run-up to the crisis. Looking ahead, the key issue is the extent to which the financial sector can add to productivity growth of the UK economy without undermining financial stability.

In manufacturing, low accumulation of the capital stock (Figure 3, Panel C), suggests a greater substitution from capital towards labour in the production process and a drag on the productivity of the sector. Also, there are indications that weak corporate restructuring may have been another driver, with company exits being smaller than in the overall economy (Figure 3, Panel D). Particularly, in low-tech manufacturing , the percentage of capital and labour that is held up by zombie firms (defined as firms which persistently fail to cover their interest payments from current profits) is estimated to be respectively at around 18% and 13% (OECD, 2017).

The UK productivity puzzle is also partly explained by pre-crisis developments, which include a low tangible investment in comparison with other OECD countries, a too rapid expansion of the financial sector despite the comparative advantage of the City, productivity gains in the manufacturing sector that were insufficiently “offensive” (driven by innovation), and a secular decline of the oil and gas sectors with dwindling resources in the North Sea.

Fig3.JPG

References:

Kierzenkowski R., G. Machlica and G. Fulop (2018), “The UK productivity puzzle through the magnifying glass: A sectoral perspective”, OECD Economics Department Working Papers, No 1496, OECD Publishing.

OECD (2017), OECD Economic Surveys: United Kingdom 2017, OECD Publishing.


Improving the Czech health care system

by Falilou Fall, Czech Republic desk, OECD Economics Department

czech rep 2018

Health outcomes in the Czech Republic have improved considerably over the last decade. Life expectancy rose by 2.6 years to 78.7 years between 2005 and 2015 towards the OECD average of 80.6 years. This was achieved with relatively low expenditures on health care of about 7% of GDP. However, the population is ageing challenging the financial sustainability of the health care system. As the old-age dependency ratio deteriorates, so do revenues of the health care system as they rely heavily on social security contributions of the working population. Ageing is expected to account for roughly half of the future rise in health care spending, which would reach about to 40% of the government budget by 2060 (OECD 2018).

healthcareCzecrep2018

To maintain and  improve health outcomes and to set a basis for healthy ageing, healthier lifestyles need to be promoted. Risky behaviour, such as smoking, alcohol consumption and obesity are close or above the OECD average. Excise taxes on alcohol are among the lowest in the OECD, contributing to the relatively high alcohol consumption that reached 11.5 litres per capita in 2015 – compared to an OECD average of 9 litres per capita. Price incentives through higher taxation of tobacco, alocohol and unhealthy food and beverages could reduce consumption. Policy measures to promote healthier lifestyles should however follow an integrated approach beyond tax incentives and include further development of health education, disease prevention and screening programmes.

Alcoholczechrep2018

A well functioning primary care sector can bring both efficiency gains through reducing avoidable use of hospital facilities, and better quality of care through better management of patients’ pathways. However, in the Czech Republic, the efficiency of delivery of primary care is suffering from lack of co-ordination. Patients’ ability to access specialist care without a prior general practitioner (GP) consultation, poorly defined mutual responsibilities of outpatient specialists and GPs and current payment systems mean that primary care’s potential to lead for instance chronic disease management is not being fulfilled. GPs should be entrusted with a greater gate-keeping and co-ordination role to ensure that patients are better directed to the most appropriate place for their treatment. User fees for specialist visits without referral could be introduced to strengthen GP’s gate-keeping role.

As the economy is doing well, reforms to the health care system and its financing should be adressed now. The Czech health system is heavily regulated by the government through the Reimbursement Decree. Through this decree, most prices and volume limitations of activities of health providers are set. Having a genuine negotiation process between health care providers and insurance funds would help reduce some of the inefficiencies in service delivery. Overall, there is a need to rebalance the system towards more competition between health providers and insurance funds and private funding to improve quality, efficiency and reduce the reliance on public funding.

References:

OECD (2018), OECD Economic Surveys: CZECH REPUBLIC 2018, OECD Publishing

OECD (2017), Health at a Glance 2017: OECD Indicators, OECD Publishing, Paris


Rising financial integration amplifies the global impact of financial market  shocks

by Nigel Pain and Véronique Salins, OECD Economics Department

EOcovStronger cross-border economic and financial integration implies that macroeconomic shocks in one country are increasingly likely to spill over into other economies. This is particularly true in national financial markets, where developments increasingly reflect common underlying factors, as shown in the special chapter of the latest OECD Economic Outlook. Thus, a change in risk sentiment in a major market, such as the United States, may spread quickly to other markets, with implications for activity and economic policy.
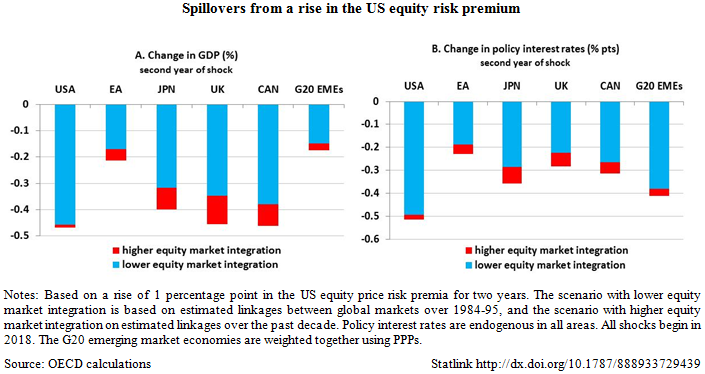
This is illustrated below, using simulations based on the global macro model NiGEM. The shock considered is a 1 percentage point rise for two years in the US equity risk premium – the compensation investors require for taking on more risk by investing in equities. To isolate financial transmission channels we assume that agents have adaptative expectations and exchange rates are fixed[1]. By itself the shock is relatively modest, reducing US equity prices (relative to baseline) by around 10%. However, linkages between financial markets around the world mean that the shock spreads to other markets, to an increasing extent over time as the linkages deepen.

Two different scenarios are considered to reflect the change over time in the importance of global factors in the equity markets, as estimated in the OECD Economic Outlook 103. In a lower integration scenario, based on the strength of equity market linkages up to the mid-1990s, equity risk premia also rise by 60 basis points in the major advanced countries, and by 40 basis points elsewhere. In a higher integration scenario, reflecting the estimated strength of linkages over the past decade, equity risk premia rise by 80 basis points and 60 basis points, respectively.

GDP declines in all major economies in both scenarios, reflecting the impact of lower net wealth on household spending and the hit to investment from the higher cost of (equity) capital (Panel A in figure). The adverse effects are greater in the higher integration scenario, particularly in open economies where the importance of equity finance for investment is relatively high, such as Canada and the United Kingdom.

The impact of the shock and the cross-border spillovers would be larger still if they were not cushioned by monetary policy easing. Since, in NiGEM, central banks react to the deviation of inflation and nominal GDP from their target levels, the fall in GDP leads them to cut policy interest rates by around ¼ percentage point in the major advanced economies by the second year, and by around ½ percentage point in the United States (Panel B in figure).

spilloversJuly2018

In practice, there could be challenges for monetary policy if this type of shock, or a larger one, were to occur at a time when policy interest rates are very low. If monetary policy did not respond to the shock at all, the fall in GDP would be steeper by between one-quarter and one half relative to the case where shocks are cushioned by monetary easing.

Increased financial integration brings benefits including more efficient resource allocation, but it also strengthens cross-border shock transmission channels. This exposes countries to greater harm from negative shocks abroad increasing the need for stronger monetary and fiscal buffers.

[1] Allowing for flexible exchange rates would soften the effect of the shock on GDP over the short term in all countries but increase its persistence in most G20 emerging markets.

Reference:

OECD (2018), OECD Economic Outlook, Volume 2018 Issue 1, OECD Publishing, Paris.


The global impact of weaker demand growth in China

by Nigel Pain and Elena Rusticelli, 

Greater international integration has modified the transmission channels and the impact that external shocks have on domestic economies via increased trade openness and exposure to global financial developments. One important change, discussed in the special chapter of the latest OECD Economic Outlook, is that growth prospects in OECD economies have become more sensitive to macroeconomic shocks in non-OECD countries. This reflects the rising share of the emerging market economies (EMEs) in global trade and finance. EMEs now account for one-fifth of world trade, up from around one-tenth two decades ago.

Changes in trade patterns and also in the intensity of trade (trade openness) have implications for the strength of the spillovers from any shocks in the EMEs. One particular example – the size of spillovers from a negative demand shock in China – is discussed below, using simulations on the global macroeconomic model NiGEM. The scenario considered is a 2-percentage point decline in Chinese domestic demand growth that persists for two years.

The trade-related spillovers from this shock are considered using versions of the model with different sets of trade patterns and different levels of trade openness (the share of trade in GDP).

  • In a first scenario, the shock is simulated at a single point in time with two different sets of bilateral trade linkages in the model – the linkages that existed in 1995 and those that existed in 2016. The share of China in total global trade rose by close to 8 percentage points between these years.
  • In a second scenario, the shock is simulated using a single set of bilateral trade linkages – those for 2016 – but with the shock occurring at two different starting periods with very different levels of trade openness. On average across economies, trade openness is 11 percentage points higher in the second starting point for the shock than in the first. This change is broadly comparable to the rise in trade openness in the decade or so prior to the financial crisis.

The adverse effects of the China shock on GDP growth in other countries increase as China becomes more integrated into global markets and as each country becomes more open to trade (figure below). In the scenarios considered, negative spillovers increase by more when trade openness is changed than from the stronger role of China in global trade, thus indicating that the general rise in cross-border trade over recent history contributes more extensively to changing transmission of shocks than the increase in the weight of single countries. GDP growth in most major OECD economies is reduced modestly, by 0.1-0.2 percentage points per annum, with a stronger impact in Japan. Negative output spillovers are larger in open economies more exposed to China via tighter GVC linkages, such as East Asia or commodity exporters.

GDP growth in China declines by between 1¼-1½ per cent per annum, depending on the particular scenario considered, with import demand falling sharply. In the scenario with the higher level of trade openness, world trade growth declines by 1 percentage point per annum relative to baseline. At the same time, the slowdown in China puts downward pressure on export prices and import prices decline in all trade partners, partially helping to correct negative growth spillovers. Such effects become more important as the share of trade with China increases, and as economies become more open to trade.

The negative output spillovers would be larger still if monetary policy did not react, or was unable to react, to offset the adverse demand shock. Central Banks, targeting the deviation of inflation and nominal GDP from their target levels, cut policy interest rates, which by the second year of the shock decline by 25-50 basis points on average in the OECD countries (depending on the scenario considered) and by more in the economies most heavily exposed to China.

Heightened financial market uncertainty and weaker commodity prices could intensify the adverse impact of a demand shock in China over and above the direct trade-related impact considered here (OECD, 2015).

EOchina2018blogJuly

References:

OECD (2015), OECD Economic Outlook, Volume 2015 Issue 2, OECD Publishing, Paris.

OECD (2018), OECD Economic Outlook, Volume 2018 Issue 1, OECD Publishing, Paris.


A sustainable European currency needs a common fiscal stabilisation instrument

Jan Stráský and Guillaume Claveres, OECD Economics Department, Euro Area/EU desk

The euro area sovereign debt crisis has exposed important flaws in the design of the Economic and Monetary Union, especially when it comes to dealing with macroeconomic shocks. Compared to federal states, fiscal transfers at the euro area and EU level are virtually non-existent. Since labour mobility remains low, private risk sharing in the euro area mainly takes place through cross-border flows of capital and credit, which may not always be sufficient to deal with large negative shocks.

The lack of effective risk-sharing is particularly damaging in a monetary union, where countries cannot use independent monetary policy or exchange rate depreciation to support growth and employment and national fiscal policies in some countries may be unable, in the short run, to deal with country-specific shocks through national counter-cyclical policies. Moreover, monetary policy may become overburdened even when dealing with common shocks. During the financial crisis, contagion effects and negative feedback loops between sovereigns and banks threatened price stability and forced the ECB to reduce policy interest rates to below zero, coming probably close to an effective constraint for monetary policy. Even though the ECB put in place other unconventional measures, such as asset purchases, to ensure transmission of its policy, these measures are not without costs and limits.

The weak potential growth and inflation outlook for the euro area, as well as the global shifts in saving and investment preferences, also suggest that nominal interest rates may stay close to zero for a prolonged period of time and return close to zero more often in the future (Rachel and Smith, 2017).

In this situation, where the ECB monetary policy may remain constrained for some time and fiscal space limited in some countries, a common fiscal stabilisation instrument would improve the policy toolkit. Our recent paper,  Euro area unemployment insurance at the time of zero nominal interest rates  simulating a general equilibrium model of the euro area with imperfect risk-sharing mechanisms shows that a fiscal capacity, in the form of a common unemployment benefit scheme, can significantly improve macroeconomic stabilisation when the monetary policy constraints become binding.

Building a common fiscal stabilisation instrument for the euro area is an important topic of the 2018 Economic Survey of the Euro Area. The concept of a common fiscal instrument goes back at least to the 1970s Marjolin’s Report and the interest in the topic has been rekindled post-crisis by several concrete proposals, including the IMF’s rainy-day fund (Arnold et al., 2018), the European Commission’s investment protection scheme (European Commission, 2017) and several variants of unemployment insurance and re-insurance schemes (Beblavý and Lenaerts, 2017; Dullien et al., 2018). However, such schemes face significant resistance, due to the fears of permanent transfers towards some countries that would reduce incentives to carry out structural reforms. To overcome these criticisms, the scheme must avoid permanent transfers among countries, a condition made explicit in the Five President’s Report.

Our companion paper, Stabilising the euro area through an unemployment benefits re-insurance scheme, discusses a novel design for a common fiscal stabilisation instrument, in the form of an unemployment benefits re-insurance scheme. As other recently proposed mechanisms (European Commission, 2017), the scheme is activated according only when unemployment increase and is above its long-term average, and involves a cap in payments, ensuring that pay-outs to individual countries are limited. These features, together with a mechanism charging higher contributions to countries that draw more frequently on the fund (experience rating), effectively prevent permanent transfers in the medium term.

Using counterfactual simulations of the proposed mechanism for individual euro area countries on annual data from 2000 to 2016, we show that the scheme would have delivered considerable stabilisation gains, both at the individual country level and euro area level (Figure 1). Macroeconomic stabilisation would be timely in most cases and achieved at the cost of limited debt issuance (less than 2% of the euro area GDP) and average annual contributions not exceeding 0.17% of GDP (Figure 2). It would have also avoided permanent transfers among countries, as none of them would have been a major net contributor or receiver with respect to the scheme, and all countries would have benefited from the scheme at one point in time.

StratskyJuly2018

Figure_2_C&S

References:

Arnold, M., Barkbu, M., Ture, H., Wang, H. and J. Yao (2018), “A central fiscal stabilization capacity for the Euro Area”, IMF Staff Discussion Note SDN/18/03 , International Monetary Fund. https://www.imf.org/en/Publications/Staff-Discussion-Notes/Issues/2018/03/22/A-Central-Fiscal-Stabilization-Capacity-for-the-Euro-Area-45741

Beblavý, M. and K. Lenaerts (2017), “Feasibility and added value of a European Unemployment Benefit Scheme”, Centre for European Policy Studies, Brussels. https://www.ceps.eu/system/files/EUBS%20final.pdf

Claveres, G. and J. Stráský (2018a), “Euro area unemployment insurance at the time of zero nominal interest rates”, OECD Economics Department Working Paper No. 1498, OECD Publishing, Paris.

Claveres, G. and J. Stráský (2018b), “Stabilising the euro area through an unemployment benefits re-insurance scheme”, OECD Economics Department Working Paper No. 1497, OECD Publishing, Paris.

Dullien, S., Fernández, J., López, M., Maass, G., del Prado, D., & von Weizsäcker, J. (2018), Fit for purpose: a German-Spanish proposal for a robust European Unemployment Insurance. http://www.fes-madrid.org/media/2017_FESpublicaciones/Arbeitslosenversicherung_doc.pdf

European Commission (2017), New budgetary instruments for a stable euro area within the Union framework, Communication from the Commission COM(2017) 822 final. https://ec.europa.eu/info/sites/info/files/economy-finance/com_822_0.pdf

OECD (2018), OECD Economic Surveys: Euro Area 2018, OECD Publishing, Paris.


Does public spending foster inclusive growth in your country?

by Debbie Bloch, Public Economics Division, Economics Department

Governments today need to balance the policy goals of boosting economic growth and improving equity when making budget decisions.  How can public spending choices promote inclusive growth?  What can be learned from previous spending decisions in times of crisis?

As it becomes increasingly important for policymakers to look at public finances in terms of both growth and income equality, a new set of indicators has been developed to help governments assess how public spending can be geared toward achieving these twin goals.

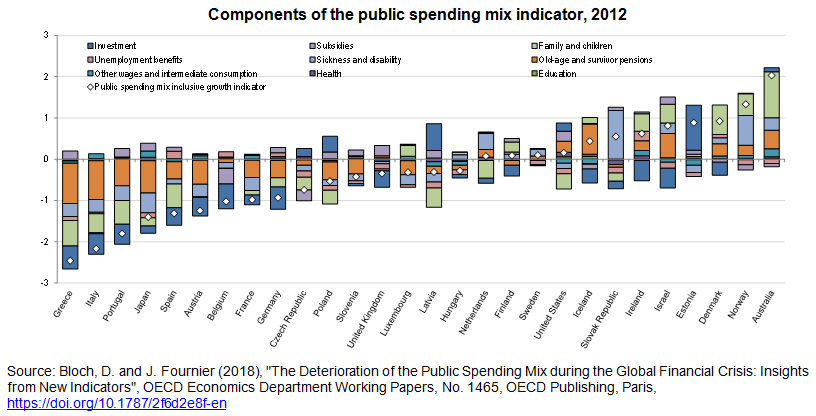
A first set of indicators combines information on the mix of public spending. Each spending item share is multiplied with an estimated coefficient from growth and inequality equations to build both a growth and an income distribution component, which is then summed up to an aggregate inclusive growth indicator.  The outcomes show that public investment and family and child benefits help butress inclusive growth, while old age pensions and government subsidies hurt the most. The indicator below shows that the public spending mix is least conducive to inclusive growth in Greece and most conducive in Australia.

publicspending-components-blog debbie

Taking the analysis further, a second set of indicators adds information on the size and effectiveness of governments to the public spending mix analysis, providing an overall indicator on the effects of public spending on inclusive growth.  This indicator shows that countries with large but efficient governments, such as Nordic countries, along with those favouring inclusive-growth friendly spending items do well in the indicator ranking, while those with less-effective governments, and with high old-age pension spending tend to do worse.


public-spending-components blog debbie2
Policymakers need to be aware of these effects when facing hard choices, particularly during times of economic crisis.  Analysis based on these new indicators have shown there is a striking link between the growth component of the public spending mix indicator and the output gap: the capacity of the public finances to support inclusive growth deteriorated markedly in the countries hardest hit during the recent crisis, as governments slashed budgets with little regard to which items would underpin inclusive growth.

What can we take away from this?  Countries facing pressure to reduce spending during an economic downturn need to consider which spending items would be most – and least – condusive to inclusive growth, to ultimately help them come out stronger after a crisis.  Increasing public investment and family benefits, for example, while targetting reductions in less productive spending items should help assure healthier, fairer economies.

Reference:

Bloch, D. and J. Fournier (2018), “The Deterioration of the Public Spending Mix during the Global Financial Crisis: Insights from New Indicators”, OECD Economics Department Working Papers, No. 1465, OECD Publishing, Paris, https://doi.org/10.1787/2f6d2e8f-en.

Further reading:

Fournier, J. and Å. Johansson (2016), “The Effect of the Size and the Mix of Public Spending on Growth and Inequality”, OECD Economics Department Working Papers, No. 1344, OECD Publishing, Paris, https://doi.org/10.1787/f99f6b36-en.

Johansson, Å. (2016), “Public Finance, Economic Growth and Inequality: A Survey of the Evidence”,OECD Economics Department Working Papers, No. 1346, OECD Publishing, Paris,https://doi.org/10.1787/094bdaa5-en.

Bloch, D. et al. (2016), “Trends in Public Finance: Insights from a New Detailed Dataset”, OECD Economics Department Working Papers, No. 1345, OECD Publishing, Paris,https://doi.org/10.1787/4d3d8b25-en.


Delivering on the promise of better outcomes for Canadian women

by Andrew Barker, Canada Desk, OECD Economics Department

The current Canadian government has declared itself feminist and has taken a number of steps to improve labour market outcomes for women. This includes increased funding for early learning and child care and improving equality of parental leave by introducing five weeks of leave for the second parent (generally fathers) on a take it or lose it basis. In terms of employment and labour force participation, Canadian women do much better than the OECD average.

However, there remains a sizeable gap in earnings between Canadian men and women (Figure 1).

Canadawomenblog 2018

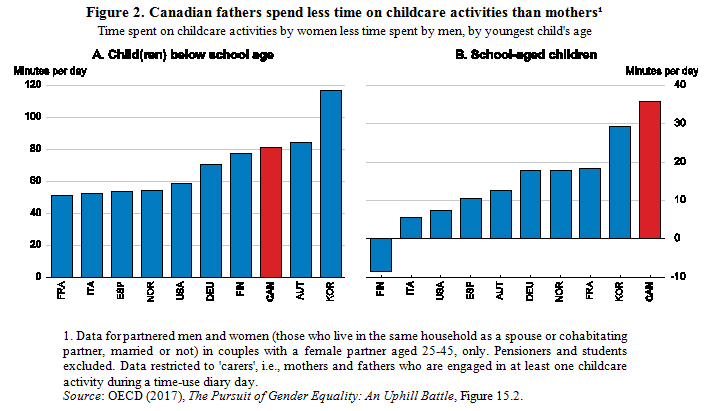
The earnings gap is particularly large for women with children, in part explained by fewer years of work experience and more hours devoted to unpaid work (Figure 2). This might be fine if it was the result of personal choices on how to split paid and unpaid work between couples, but international survey evidence indicates that women would like to work more and, within Canada, comparison with Quebec – where women have for many years enjoyed affordable child care and more equitable division of parental leave – indicates that Canadian women would choose to work more if given access to more family-friendly policy support.

Canadawomenblog2 2018

An important step in this regard is to make sure that new fathers use the additional leave that they are now entitled to. Governments need to work with businesses and lead by example to create a culture where men are encouraged to take leave to look after their young children. Payment rates for parental leave may need to be adjusted if take-up remains low, as it has in some other OECD countries with low payment rates.

Improving access to high-quality, affordable early childhood education and care (ECEC) is the best way to improve labour market outcomes for Canadian women. Canada stands out among OECD countries for the high cost of childcare (in the comparison province of Ontario, at least) and the low share of Canadian youth who have attended ECEC for two years or more. Affordable and high quality ECEC can address barriers to mothers’ labour force participation, reduce the motherhood wage penalty and support child development, particularly for disadvantaged children. While there are upfront fiscal costs, these are offset over a longer period through women’s higher participation and productivity. Women’s productivity, and thus incomes, would also be assisted by further steps to promote female entrepreneurship and to boost women’s representation in senior management, computing and engineering.

References:

OECD (2018), OECD Economic Surveys: Canada 2018,  OECD Publishing, Paris.


Enhancing labour-market integration of immigrants in Canada

by David Carey, Head of Canada Desk, OECD Economics Department

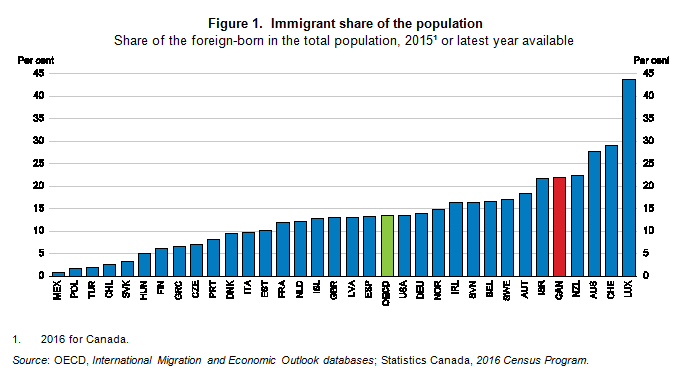
Canada has long taken in more immigrants relative to its population than most other countries. Immigration policy in Canada aims to promote economic development by selecting immigrants with high levels of human capital, to reunite families and to respond to foreign crises and offer protection to endangered people. Economic immigrants, who are selected for their skills, are by far the largest group. The immigration system has been highly successful and is well run. Outcomes are monitored and policies adjusted to ensure that the system’s objectives are met. Immigrants and their children are better integrated in Canada based on a variety of indicators than in most other countries. Immigrants selected for their skills earn substantially more than other immigrants, indicating that selection is succeeding in identifying immigrants with the greatest potential for labour market integration.

Canadaimmigrationblog 2018

A problematic development is that immigrants’ entry earnings fell sharply relative to those of the comparable native-born in recent decades. Important causes of the fall include weaker official language skills and a decline in the returns to pre-immigration labour market experience.

Canadaimmigrationblog2 2018

In response, immigration policy has been changed to select immigrants with better earnings prospects. More are selected for their human capital, and greater weight has been given to official language competence, age (inversely related to foreign work experience) and Canadian work experience. Recently, the selection system was overhauled with the introduction of Express Entry, which only invites candidates with the highest point scores to apply for permanent residence and gives employers a greater role in selection. The system would be still more effective if more weight were given to skilled Canadian work experience in selection and applications from candidates with skilled work experience and a relevant job offer were processed before others.

Canada also has an extensive array of programmes that facilitate integration. The Targeted Employment Strategy for Newcomers facilitates foreign-credentials recognition and helps immigrants gain Canadian work experience in their profession. Bridge programmes, which help with post-secondary credentials recognition in regulated occupations, and mentoring programmes, which help immigrants overcome underrepresentation in high-quality jobs by developing professional networks, have proved effective and should be expanded. The federal government’s settlement programmes are extensively used but it is not clear whether utilisation patterns reflect differences in needs or availability. There are large differences in efficiency of government language programmes, pointing to possibilities for reorganisation to improve outcomes.

References:

OECD (2018), OECD Economic Surveys: Canada 2018,  OECD Publishing, Paris.


An empirical investigation on the drivers of income redistribution across OECD countries

By Orsetta Causa, OECD Economics department

Income inequality has increased in most OECD countries over the past two decades. This has come about both because incomes before taxes and transfers have become more unequally distributed, and because the extent of redistribution through taxes and transfers has fallen (“Income redistribution through taxes and transfers across OECD countries”). A new OECD paper by Orsetta Causa, Anna Vindicis and Oguzhan Akgun provides an empirical investigation on the drivers of the widespread decline in income redistribution across OECD countries over the last two decades.

The results suggest that the size of the redistribution system plays a major role for income redistribution, in particular on the spending side, confirming previous OECD findings. Hence, the relatively widespread decline on cash transfers to the working-age population is found to have contributed to the decline in income redistribution to the working-age population.

On the revenue side, the empirical analysis uncovers an interaction between increased economic integration and the capacity of personal income taxes to reduce income inequality. Indeed, the results suggest that stronger trade ties across countries have made a given level of tax receipt through personal income taxes less effective at reducing income inequality. The estimated marginal effect of the personal income tax to GDP (PIT-to-GDP) ratio on redistribution thus depends on the degree of countries’ openness (Figure 1): for around half of OECD countries, the effect of the PIT-to-GDP ratio on redistribution is significantly positive but this effect declines with openness levels. For a country at the OECD average level of trade openness, a one percentage point increase in the PIT-to-GDP ratio is associated with a 2% increase in redistribution. For the countries for which such effect is statistically significant, it ranges from 3.7% (USA) to around 1.5% (Korea).

sizeofpitblogcausa1

For a given overall size of the tax and transfer system, the estimation results suggest that changes in specific tax and transfer instruments have contributed to the decline in redistribution. Most important among these are:

  • Reductions in the progressivity of personal income taxes, driven by a flattening of the tax schedule in the upper-part of the wage distribution as well as by a decline in top personal income tax rates and in the taxation of dividend income at the personal level.
  • Reductions in the generosity and duration of unemployment-related transfers, including cuts to social assistance for the long-term unemployed, which have often taken place in combination with increases in spending on active labour market policies. This finding is thus likely to reflect the effect of policy reforms to boost work incentives among target groups and to shift from passive to active support for the unemployed.

At the same time, not all policy changes went in the direction of reducing redistribution: the decline in redistribution has been partly mitigated by progressive family-friendly policies, such as widespread increases in spending on early education and childcare, as well as by tax cuts to low wage earners.

These estimates are used to simulate the income redistribution effect of selected tax and transfer reform scenarios, taking into account the countries’ relative starting point in each policy area. Transfer reform scenarios deliver larger effects than tax reform scenarios. The scenarios consistently point to major redistribution gains in countries where social spending on working-age population is relatively low and/ or weakly targeted to low-income households (Figure 2). Increases in long-term unemployed- related transfers to married couples deliver major redistribution gains where these transfers are low or non-existent  (e.g. Chile, Greece, Italy, Turkey and the United States)  The magnitude of these effects reflects the large implied size of the simulated reforms for these countries and should therefore be interpreted in light of alternative policy objectives, in particular efficiency objectives in terms of job search incentives, alongside budgetary constraints.  Still, those same countries that exhibit comparatively low passive support for the long-term unemployed tend to also exhibit comparatively low active support. As a result, policy packages that would combine more generous cash transfers with more effective activation and training for jobseekers would likely meet equity and efficiency objectives. The United States and Turkey would also boost redistribution by increasing spending on early education and childcare; and so would Mexico and Japan. This would not only increase redistribution but also help narrowing gender gaps and curbing child poverty. Reforms to enhance access to quality childcare for disadvantaged families are likely to maximise policy synergies between efficiency and equity.

sizeofpitblogcausa2

References: 

Causa, O., A. Vindics and O. Akgun (2018), “An empirical investigation on the drivers of income redistribution across OECD countries“, OECD Economics Department Working Papers, No. 1488, OECD Publishing, Paris, https://doi.org/10.1787/5cb47f33-en.