La Croissance est à son pic, la négociation d’un atterrissage en douceur s’annonce délicate

‌Laurence Boone, Chef économiste de l’OCDE

PE Nov2108L’économie mondiale traverse des zones de turbulences. La croissance du PIB mondial est élevée, mais a probablement atteint son pic. Dans de nombreux pays, le chômage est bien en dessous de ses niveaux d’avant-crise, les tensions sur l’emploi augmentent et l’inflation demeure modérée. Mais les échanges et l’investissement marquent le pas, sur fond de hausse de certains droits de douane. De nombreuses économies émergentes sont confrontées à des sorties de capitaux et ont vu s’affaiblir leur monnaie. L’économie mondiale paraît prête pour un atterrissage en douceur, avec une croissance du PIB mondial qui devrait passer de 3.7 % en 2018 à 3.5 % en 2019-20. Mais les risques s’accumulent et les gouvernements et banques centrales devront naviguer prudemment pour préserver des rythmes de croissance du PIB certes plus modestes, mais durables.

Négocier un atterrissage en douceur a toujours été délicat, mais l’exercice est particulièrement difficile aujourd’hui. Avec des banques centrales qui réduisent progressivement, et à juste titre, leurs injections de liquidités, les marchés ont commencé à revoir les prix des risques, la volatilité fait son retour, le prix de certains actifs baisse. Les flux de capitaux, qui ont contribué à l’expansion des économies de marché émergentes, s’inversent progressivement. Les tensions commerciales génèrent de l’incertitude et risquent de perturber les chaînes de valeur mondiales et l’investissement, plus spécialement dans les régions aux liens étroits avec les États-Unis et la Chine. Des incertitudes politiques et géopolitiques montent également en Europe et au Moyen-Orient.

Une accumulation de risques pourrait créer les conditions d’un atterrissage plus brutal que prévu. La recrudescence des tensions commerciales pourrait peser sur la croissance des échanges et du PIB, et générer encore plus d’incertitude pour l’investissement des entreprises. Le durcissement des conditions financières pourrait accélérer les sorties de capitaux en provenance des économies émergentes et faire reculer encore la demande. Un net ralentissement de l’activité en Chine frapperait non seulement les économies émergentes, mais aussi les économies avancées, si ce choc entraînait un repli des cours des actions et une augmentation des primes de risque dans le monde.

Les tensions politiques autres que commerciales augmentent aussi. Au Moyen-Orient et au Venezuela, les difficultés géopolitiques et politiques ont accru la volatilité des cours du pétrole. En Europe, les négociations autour du Brexit suscitent des inquiétudes. Dans certains pays de la zone euro, l’exposition des banques à la dette souveraine pourrait peser sur la croissance du crédit si les primes de risque devaient encore augmenter, ce qui ralentirait la consommation, l’investissement, la croissance et l’emploi.

Dans ce contexte, nous invitons instamment les responsables politiques à rétablir la confiance dans les institutions internationales et dans le dialogue entre tous les pays. Notamment pour apporter une solution coopérative aux discussions sur les échanges commerciaux. L’adoption de mesures concrètes au niveau du G20 serait aussi un signal positif, démontrant que les pays peuvent agir de manière coordonnée et concertée si la croissance devait ralentir plus nettement que prévu.

La coopération est d’autant plus nécessaire que les marges de manœuvre de politique économique sont limitées. Dans certains pays, les taux sont très bas et la politique monétaire est encore très accommodante, alors que les ratios dette privée/PIB et dette publique/PIB se situent à des niveaux historiquement élevés. Le soutien budgétaire diminue, à juste titre, mais si la croissance devait ralentir plus brutalement, les pouvoirs publics devraient profiter de la faiblesse des taux d’intérêt pour s’engager dans une relance budgétaire coordonnée. Dans cette édition des Perspectives économiques, nous présentons des simulations qui montrent qu’une relance budgétaire coordonnée au niveau mondial serait un moyen efficace de réagir rapidement à un ralentissement plus marqué que prévu.

La fragilité de l’environnement rend d’autant plus important l’achèvement de l’Union monétaire européenne, comme suggéré dans la dernière Étude économique de la zone euro réalisée par l’OCDE. Il est urgent que l’Europe mène à son terme l’union bancaire. L’absence de progrès dans ce domaine n’incite pas les banques à réduire la part, toujours importante, d’obligations souveraines domestiques dans leur bilan, ce qui nourrit la perception du risque de redénomination. Progresser sur la mise en œuvre d’une capacité budgétaire commune aiderait aussi à accroître la confiance dans l’aptitude de la zone euro à réagir aux chocs, et à inscrire la croissance dans la durée.

Enfin, la reprise mondiale depuis la crise financière n’a pas produit d’améliorations tangibles du niveau de vie pour un grand nombre de citoyens. Si la pauvreté absolue a fortement reculé dans un certain nombre d’économies émergentes, la crise a montré que les écarts de bien-être entre la partie de la population mobile et hautement qualifiée et la part, plus nombreuse, de personnes moins mobiles et souvent moins qualifiées, se sont creusés depuis plusieurs décennies dans de nombreuses économies avancées. Les écarts de revenu se perpétuent d’une génération à l’autre : trop souvent les perspectives d’avenir de chaque individu dépendent de l’endroit où il est né, où il a été scolarisé et où il a commencé à rechercher un emploi. Ces inégalités, l’absence de mobilité intergénérationnelle, menacent la croissance et alimentent le rejet de la mondialisation, qui a pourtant été vecteur de prospérité de nombreuses régions du monde.

Le ralentissement des gains de productivité dans de nombreuses économies bride la hausse des salaires réels mais même dans les entreprises très productives, la progression des salaires a été modeste. L’innovation technologique, qui tire vers le bas le prix relatif des investissements, renforce le pouvoir de marché des entreprises très productives. En même temps, la baisse du prix relatif des investissements peut entraîner une substitution du capital au travail, en particulier pour les emplois faiblement qualifiés et répétitifs, pour toutes les entreprises. Avec la diffusion du numérique, le fossé entre les emplois hautement qualifiés peu répétitifs et les emplois faiblement qualifiés répétitifs se creuse. Conjuguées à une redistribution moins poussée, ces tendances risquent d’aggraver les inégalités.

Les pouvoirs publics peuvent faire davantage pour favoriser l’augmentation de la productivité et des salaires. Renforcer la concurrence sur les marchés des produits permettrait de favoriser la croissance de nouvelles entreprises, d’encourager une diffusion plus large des nouvelles technologies, et de contribuer ainsi à une hausse des gains de productivité, mais aussi de mieux répercuter les gains de productivité sur les salaires. Renforcer les compétences est également essentiel parce qu’une main-d’œuvre qualifiée est moins facile à remplacer par de nouvelles technologies. Des politiques actives du marché du travail et des politiques de formation axées sur les compétences sont aussi clés pour aider ceux qui courent le risque d’être exclus du marché du travail.

Certaines décisions des pouvoirs publics renforcent les vents contraires qui soufflent sur nos économies. Aujourd’hui plus que jamais, nous avons besoin de meilleures politiques, qui reposent sur la coopération, la confiance et l’ouverture, pour pouvoir créer des emplois, pérenniser la croissance et relever les niveaux de vie.

Éditorial extrait des Perspectives Économique de l’OCDE, Novembre 2018

References

OECD (2018), Perspectives économiques de l’OCDE, OECD Publishing, Paris.


Growth has peaked: Challenges in engineering a soft landing

by Laurence Boone, OECD Chief Economist

EO-nov-2018-cover-enThe global economy is navigating rough seas. Global GDP growth is strong but has peaked. In many countries unemployment is well below pre-crisis levels, labour shortages are biting and inflation remains tepid. Yet, global trade and investment have been slowing on the back of increases in bilateral tariffs while many emerging market economies are experiencing capital outflows and a weakening of their currencies. The global economy looks set for a soft landing, with global GDP growth projected to slow from 3.7% in 2018 to 3.5% in 2019-20. However, downside risks abound and policy makers will have to steer their economies carefully towards sustainable, albeit slower, GDP growth.

Engineering soft landings has always been a delicate exercise and is especially challenging today. As central banks progressively, and appropriately, reduce their liquidity support, markets have started repricing risks as reflected by the return of volatility and the decline of some asset prices. Capital flows, which had fuelled the expansion of emerging market economies, have been reversing towards advanced economies and especially the United States. Trade tensions have heightened uncertainty for businesses and risk disrupting global value chains and investment, especially in regions tightly linked to the United States and China. Political and geopolitical uncertainty has increased in Europe and the Middle East.

An accumulation of risks could create the conditions for a harder-than-expected landing. First, further trade tensions would take a toll on trade and GDP growth, generating even more uncertainty for business plans and investment. Second, tightening financial conditions could accelerate capital outflows from emerging market economies and depress demand further. Third, a sharp slowdown in China would hit emerging market economies, but also advanced economies if the demand shock in China triggered a significant decline in global equity prices and higher global risk premia.

Political tensions other than trade have also grown. In the Middle East and Venezuela, geopolitical and political challenges have translated into more volatile oil prices. In Europe, Brexit is an important source of political uncertainty. It is imperative that the European Union and the United Kingdom manage to strike a deal that maintains the closest possible relationship between the parties. In some euro area countries, the exposure of banks to their government debt could weigh on credit growth if risk premia were to increase further, with dampening effects on consumption, investment, GDP growth, and ultimately jobs.

Against this backdrop, we urge policymakers to restore confidence in international dialogue and institutions. This would help strengthen trade discussions in order to tackle critical new issues and to address concerns with the rules and processes of the existing trading system. Concrete action at the G20 level will send a positive signal and help demonstrate that countries can act in a coordinated and cooperative fashion should growth slow more sharply than envisaged.

It is all the more important to cooperate now that policymakers have limited margins for manoeuvre in case of an abrupt slowdown. In some countries, monetary policy is still very accommodative, while public and private debt-to-GDP ratios are historically high. Fiscal stimulus will be scaled back, which is appropriate. But in the event of a downturn, governments should leverage low interest rates to coordinate a fiscal stimulus. In this Economic Outlook, we report simulations showing that a coordinated fiscal stimulus at the global level would be an effective means of quickly responding to a sharper-than-expected global slowdown.

The fragile environment heightens the importance of completing European Monetary Union, as suggested in the latest OECD Economic Survey of the Euro Area. It is urgent for Europe to complete the banking union. The lack of progress has led to higher domestic sovereign debt holdings by banks in some countries, magnifying hazards and maintaining the redenomination risk that undermines confidence. Progress towards establishing a common fiscal capacity would help maintain confidence in the ability of the euro area to react to shocks and sustain growth.

The global recovery since the financial crisis has not led to tangible improvements in the standards of living of many people. While absolute poverty has plummeted in a number of emerging market economies, the crisis exposed decades of widening well-being gaps between the higher-skilled mobile part of the population and a larger number of less mobile, often less-skilled people in many advanced economies. Income gaps pass from one generation to the next: one’s future prospects are framed by where one is born, educated and starts looking for a job. These entrenched inequalities threaten growth, intergenerational mobility, and fuel discontent with the integrated global economy, which has brought prosperity across large parts of the world.

The general slowdown in productivity growth in many economies constrains real wage growth. But even in highly productive firms, wage growth has been more sluggish than expected, a result in part of technology driving down investment prices. This can prompt substitution of labour by capital, particularly for low-skilled, high-routine jobs. As digitalisation deepens, the divide between high-skill, low-routine jobs and low-skill, highroutine work risks widening. In addition, slower business dynamics preserve firms which are less productive and accordingly are less able to increase wages.Together with declining redistribution, this trend risks fuelling inequalities.

Governments can do more to foster higher productivity and wages. Strengthening product market competition would not only favour wider diffusion of new technologies, thereby raising productivity growth, but also help transfer productivity gains to wages. Investment in skills can help workers seize the gains from technological progress as higher-skilled labour is less easily replaced by new technologies. Effective active labour market and skills training policies can help those at risk of being excluded from the labour market.

Certain policy decisions are exacerbating many of the headwinds faced by our economies. Better policies, built on greater trust and openness, are needed now more than ever in order to create jobs, sustain growth and raise living standards.

Editorial from the November 2018 edition of the Economic Outlook

References:

OECD (2018), OECD Economic Outlook, Volume 2018 Issue 2: Preliminary version, OECD Publishing, Paris, https://doi.org/10.1787/eco_outlook-v2018-2-en.


Making trade and digitalisation work for all

by Laurence Boone, OECD Chief Economist

IncgrowthblogLB12-11-2018For some, the financial crisis was an eye-opener exposing the inequalities in life chances between those with the right skills and those without, between those born and educated in the right places and those who were not.  But for many others the growing gap in well-being has been a reality for decades.
Widening inequalities threaten economic growth, undermine trust in government and democracy, and fuel discontent with the multilateral rules-based system of market economies.

Governments can and should seek to reverse the trend towards growing inequality and ensure that  economic growth benefits everyone. Making trade and digitalisation work for all is not about idealism: it is about improving people’s standard of living, boosting opportunities for inter-generational mobility and ensuring a brighter future for all.

The OECD has developed a whole-of-government approach, built around analysis of policies and strategies to ensure that the fruits of economic growth are better shared across society. We identify comprehensive policy packages that optimise gains in GDP and households incomes, including among the less well off.

There are no one-size-fits-all reform packages, but key principles can guide policy-making for inclusive growth by targeting three broad areas for action: firms, skills and workers.

  • Firms: to promote business dynamism and the diffusion of knowledge by, for instance, lowering barriers to market entry or improving the efficiency of the corporate tax system.
  • Skills: by fostering higher quality education and greater innovation and through better-adapted R&D policies so that innovation fosters productivity gains across all types of activities.
  • Workers: with policies that ensure workers benefit from a fast-evolving labour market, including those who are most vulnerable to the changing demand for skills and automation, or who have less bargaining power.

The principles build on extensive OECD empirical research into the effects of pro-growth structural policy reforms on household disposable incomes. This research highlights the trade-offs between productivity gains and inequality when they appear, as well as possible synergies between efficiency and equity.

The policies needed to raise equality of opportunity are clear. It is striking that a child whose parents did not graduate from secondary school has only a 15% chance of doing so himself or herself, compared to a 65% chance for more well-off children.  Equality of opportunities can foster social mobility: an equal access to education, finance, jobs, health, transport and other public services helps compensate for the environment in which people were born. Good quality education is primordial throughout life – especially early childhood education, but also training at work, which too often benefits those already well educated.

Other reforms have more ambiguous effects on efficiency and equity. Policies which reduce labour costs by lowering unemployment benefits increase employment, but also make the vulnerable more fragile when there is an economic downturn. Meeting the twin objectives of raising employment while mitigating the negative consequences on poor households requires well-targeted active labour market policies to enhance the employability of low-skilled workers, the long-term unemployed and discouraged job seekers.

Some policies have more ambiguous effects: raising the minimum wage reduces inequality, just as stronger unions may strengthen workers’ bargaining position.  When firms have the option of investing in automation technology,  striking the right balance between bargaining power and the economic environment is  crucial to preserving employment with appropriate wage gains.

Spurring productivity, by easing barriers to firm entry and competition in product markets, supports GDP growth gains without exacerbating inequality, but only to the extent that the associated job gains are fairly equally shared across households. This requires the distributional effects of higher employment – which tends to benefit the less affluent households disproportionately – to more than offset those of higher labour productivity, which tends to benefit  the wealthiest households.

Inclusive growth also requires devoting careful attention to transition. Opening markets to trade or progress in technology inevitably leads to the decline of certain companies and obsolescence of particular skills. Accompanying measures – building on an active partnership between employers and governments, often at the regional level – can help workers and strengthen trust in the protective capacity of governments. Safety net packages and trampoline policies for keeping workers in the labour markets are all relevant. For example, in Sweden, job security councils, founded by employers, assist workers whose employment is put at risk when firms restructure. The programmes have enabled  85% of displaced workers to find a new job within a year, a higher rate than any other OECD country. Conversely, the US Trade Adjustment Assistance and the EU Globalisation Adjustment Fund, which lack such partnerships, have barely benefitted those affected by the displacement of economic activities.

It is important to acknowledge that transitional policy responses have limits. This is especially the case for persistent shocks concentrated in specific regions, sectors or skills. When distributional effects are persistent, direct fiscal policy measures may be needed to restore equity and opportunity. These may include well-designed wealth and inheritance taxation, paying particular attention to the progressivity of the tax system, and better targeting social benefits towards those who need those most. Separately at the global level, the international  programme to tackle Base Erosion and Profit Shifting (BEPS) and increase information transparency of the tax system will help strengthen the level-playing field and ensure a fair share of firms’ revenues is allocated to where value added is produced. This will help stabilise government revenues and ensure redistribution  benefits to those who need it most, but perhaps more importantly may help increase trust in multilateral cooperation.

Sustained growth is a pre-condition for improving living standards and job creation, but sustainability depends on an effective and perceived broad sharing of the growth dividends. The OECD has been promoting an inclusive growth framework based on three pillars: equal opportunities, business dynamism and inclusive labour markets, efficient and responsive governments. Implementation needs to start today.

References:


Fostering formal sector job creation to further improve living standards in Indonesia

By Christine Lewis, Head of Indonesia Desk, OECD Economics Department

The Indonesian economy has grown solidly in recent years, which together with helpful government policies has raised incomes and brought down poverty rates to record lows, as highlighted in the latest OECD Economic Survey of Indonesia (OECD, 2018). Prudent macroeconomic policies have contributed to economic stability, muted inflation and limited government debt. Even with the more challenging external environment, GDP growth is expected to remain around 5¼ per cent in 2018 and 2019.

Indonesia’s youthful population represents an opportunity to lift future growth and living standards. In contrast with higher-income countries, the working-age population share is rising and will likely continue doing so for another decade (United Nations, 2017). OECD estimates suggest that over the next decade this demographic change alone is expected to boost trend GDP growth by around 0.3% on average (OECD, 2018; Guillemette and Turner, 2018).

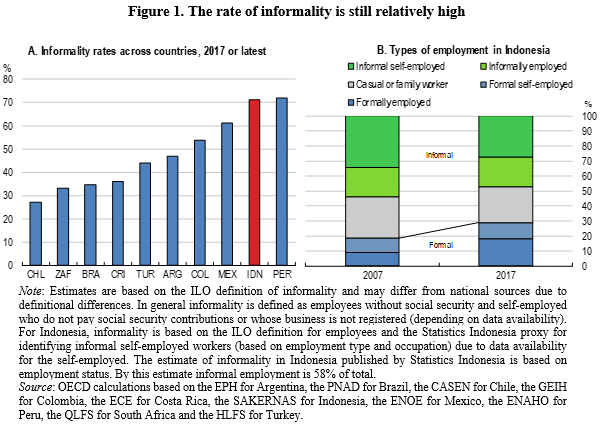
Indonesia’s favourable demographics could provide a bigger boost to growth if a larger share of employment consisted of high-quality jobs in the formal sector. Informality is usually associated with insecure jobs with lower pay and fewer training opportunities (OECD, 2015; Allen, 2016). Although the rate of informality has fallen in Indonesia, it remains pervasive. The OECD estimates that around half of all dependent employees and 70% of all workers are informally employed, compared to 35% in Brazil or around 55% in Colombia (Figure 1). Growing the share of formal sector jobs would increase incomes and, by raising government revenues, would allow better services to be provided for future generations.

Indo CLewis informality 1

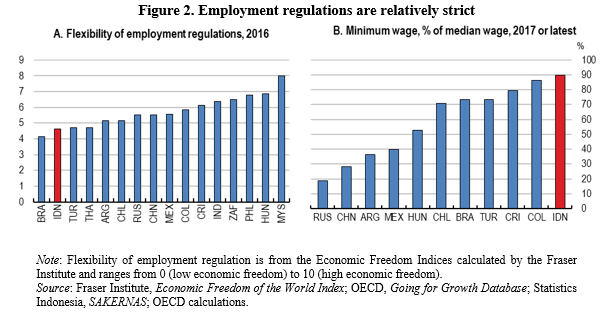
There are different reasons for informal employment so tackling it requires a multi-pronged approach. Stringent employment regulations, including high dismissal costs and minimum wages, limit firms’ ability and incentive to hire formal employees (Figure 2). The Survey recommends trialling easier employment regulations and a discounted wage for youth in special economic zones and extending these reforms if they are successful. Continuing to simplify business regulations and to improve the new online submission system for licensing would help reduce barriers to businesses operating formally.

Indo CLewis informality 2-2018

Low skill levels combined with a relatively high minimum wage also limit the growth of formal sector employment. Only half of all Indonesians aged 25-35 have completed upper secondary school. The OECD PISA test results show that many 15 year-olds still lack basic skills in maths and reading. Improving the quality of education can be difficult but it is crucial for improving the prospects of future generations. Reforms should focus on improving teacher quality in schools and better linking vocational education with employers to ensure students graduate with the skills they need to find good jobs and continue developing over their career.

References

Allen, E. (2016), “Analysis of trends and challenges in the Indonesian labor market”, ADB Papers on Indonesia, No. 16, Asian Development Bank, Manila.

Guillemette, Y. and D. Turner (2018), “The long view: scenarios for the world economy to 2060”, OECD Economic Policy Papers, No. 22, OECD Publishing, Paris, http://dx.doi.org/10.1787/b4f4e03e-en.

OECD (2018), OECD Economic Surveys: Indonesia, OECD Publishing, Paris, https://doi.org/10.1787/eco_surveys-idn-2018-en.

OECD (2015), “Enhancing job quality in emerging economies”, in OECD Employment Outlook 2015, OECD Publishing, Paris, http://dx.doi.org/10.1787/empl_outlook-201h5-9-en.

United Nations (2017), World Population Prospects: The 2017 Revision, DVD Edition;


If potential output estimates are too cyclical, then OECD estimates have an edge

by Yvan Guillemette and Thomas Chalaux, OECD Economics Department

To assess the cyclical position of an economy, macroeconomists use a concept called potential output, which measures the economy’s production rate that is consistent with stable inflation at the target. When actual output is below potential, the ‘output gap’ is negative, the economy is depressed and, without prompt intervention by the central bank, inflation would tend to sag below target. Conversely, a positive output gap indicates an overheating economy and portends price and wage pressures, signalling the need for tighter monetary policy.

A country’s output gap is also a crucial ingredient in the estimation of the structural budget balance, which serves to assess the impulse that fiscal policy is imparting on the economy. Since the 2005 reform to the European Union’s fiscal framework, the Stability and Growth Pact, the structural budget balance has been at the centre of assessments by the European Commission of member countries’ adherence to the Union’s fiscal rules.

The difficulty is that potential output, and measures derived from it, such as the output gap and the structural budget balance, are not directly observable but must be estimated. The objective is for potential output to capture structural changes in the economy, such as a declining working-age population associated with ageing, while letting cyclical fluctuations, which are expected to be temporary, flow through to the output gap measure. Potential output estimation is therefore largely a matter of separating out cyclical fluctuations from structural changes. Three international organisations routinely produce such estimates for their member countries: the European Commission (EC), the International Monetary Fund (IMF) and the OECD. Despite using broadly similar methods, differences arise from a number of methodological and judgemental choices.

It is difficult to assess the quality of potential output estimates because there are no ‘true’ observed values to compare them to. Nevertheless, one criticism increasingly levelled against such estimates is that they treat too much of regular economic fluctuations as being structural. Estimated potential growth tends to be too weak when the economy is weak and vice-versa. In other words, potential output estimates are excessively ‘pro-cyclical’. One consequence is that governments will tend to have a pessimistic view of the structural budget balance in bad times and, conversely, an optimistic view in good times. Too much procyclicality in potential output therefore encourages procyclicality in fiscal policy, whereas economists generally agree that fiscal policy should be countercyclical.

For instance, the economists Antonio Fatás and Lawrence Summers have argued that the financial and economic crisis of 2008 created an overly pessimistic view of potential output among policy makers, which led them to support contractionary fiscal policy (i.e. cuts in spending or increase in taxes). Fiscal austerity affected economies negatively by subtracting a vital source of demand and, via hysteresis effects, caused a reduction in potential output that not only validated the original pessimistic assessment, but also led to a second round of fiscal consolidation. As Fatás says, this succession of contractionary fiscal policies was likely self-defeating for many European countries in the sense that their public debt-to-GDP ratios are barely better today than when austerity measures started.

A simple measure of the cyclicality of potential output series can be obtained by regressing the annual change in estimated potential growth on a constant and the annual change in actual growth. The estimated coefficient on actual growth then measures the sensitivity of potential growth to actual growth. Intuitively, this measure should be positive but small.

The chart below reports the result of this exercise for potential output estimates published by the three aforementioned institutions as part of their spring 2018 forecasting rounds, using a common panel of 24 countries over the 1980-to-2017 period. Each regression uses 682 observations, so an average of 28 years per country.

OECD estimates yvan

The results show clearly that the spring 2018 European Commission potential output series were the most cyclical. On average in the Commission estimates, a one-percentage point change in actual real GDP growth is associated with a 0.18 percentage point change in potential growth. The coefficient on the IMF estimates is only slightly smaller. On the other hand, the OECD coefficient is less than half of the two others. One reason the OECD potential output measure may be less cyclical is that before smoothing them with a filter, the component series used to construct potential output are first cyclically adjusted by making use of other variables – such as survey measures of capacity utilisation or the investment rate – which are known to be correlated with the cycle (see Turner et al., 2016).

The above exercise does not use ‘real-time’ estimates of potential output so, for instance, the 2010 potential growth estimate for France is different now than it was back in 2010. The 2010 estimate was of course the relevant one for the conduct of policy at the time. Rather, the test assesses the amount of cyclicality inherent in current methodologies, which may also have evolved since 2010. And if current estimates for past years are considered too sensitive to actual growth, then it is likely that the real-time estimates being produced now with a given methodology are too sensitive as well.

The sensitivity of changes to potential growth to changes in actual growth rates is neither a perfect nor a comprehensive measure of the quality and reliability of potential output estimates. After all, simply using a fixed number for a country’s potential growth would show a zero correlation but would obviously be problematic. However, in the absence of other obvious flaws, the OECD potential output estimates appear less exposed to the procyclicality criticism than those of the EC or IMF.

References

Coibion, O., Y. Gorodnichenko and M. Ulate (2017), “The Cyclical Sensitivity in Estimates of Potential Output”, NBER Working Papers, No. 23580, National Bureau of Economic Research.

Fatás, A. (2018). “Fiscal Policy, Potential Output and the Shifting Goalposts”, CEPR Discussion Papers, No. 13149, Centre for Economic Policy Research.

Fatás, A. and L.H. Summers (2018), “The permanent effects of fiscal consolidations”, Journal of International Economics, Vol. 112, pp. 238–250.

Turner, D. et al. (2016), “An investigation into improving the real-time reliability of OECD output gap estimates”, OECD Economics Department Working Papers, No. 1294, OECD Publishing, Paris.


How best to keep up rapid tourism growth in Indonesia

by Patrice Ollivaud, Economist, Indonesia Desk, OECD Economics Department

Bali, where the 2018 OECD Economic Survey of Indonesia is being released, is emblematic of Indonesia’s success in creating a popular tourism brand. The number of foreign tourists arriving in Bali soared from 2.5 million in 2010 to 5.7 million in 2017. In 2014, the authorities committed to replicate this success in “10 new Balis” with the aim of doubling tourist numbers to 20 million by 2019. To reach that target, the government accelerated transport infrastructure development and stepped up its promotion efforts. In 2017, tourist arrivals reached 14 million and other destinations are becoming popular, such as Borobudur.

tourism bali

However, success in numbers also poses challenges. Environmental infrastructure such as water and waste treatment remains insufficient in most of Indonesia. Growing numbers of foreign tourists are widening the infrastructure gap because their consumption is higher than that of a typical Indonesian. To wit, the increased use of plastic bottles, since tap water is typically not potable. Improperly disposed waste from land largely contributes to Indonesia’s position as the second-largest contributor to plastic marine pollution in the world. Indonesia has also the most plastic-ridden coral reefs in the Asia-Pacific (Lamb et al., 2018). In Bali, the ocean carries waste onto beaches that need to be regularly cleaned.

Addressing infrastructure gaps would allow more sustainable development of tourism, and development of tourism to be sustained. Better planning, especially at the destination level, can help accommodate tourist inflows (OECD, 2018). Focusing more on attracting high-spending visitors could also limit the burden without reducing the economic benefits. The involvement of local government and stakeholders is crucial so that plans address local needs and have the population’s acceptance.

Preserving the environment and developing tourism can be mutually reinforcing. Visitors are attracted by the richness of Indonesia’s environmental assets. Preservation of those assets is essential for sustaining Indonesia’s brand and attracting tourists. For example, forests need protection as deforestation is destroying more than just trees and wildlife but also the economic returns from properly using them for tourism. Protecting more areas would contribute to preserving those assets (OECD, 2018). More of those areas could also be opened to the tourism industry, when it is environmentally viable. Imposing fees will help control the number of visitors and contribute to the cost of maintenance.

References

Lamb, J. et al. (2018), “Plastic waste associated with disease on coral reefs”, Science, Vol. 359/6374, pp. 460-462.

OECD (2018), OECD Economic Surveys: Indonesia 2018, OECD Publishing, Paris.


Making the most of Riga metropolitan area can boost wellbeing and economic growth in Latvia

By Daniela Glocker and Andrés Fuentes Hutfilter, OECD Economics Department

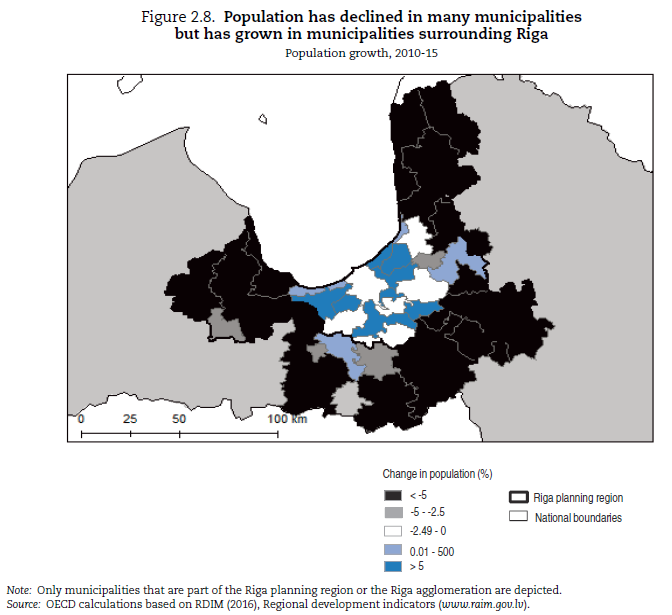
Located at the centre of the Baltic States, Latvia’s capital city Riga and its surrounding municipalities are a strategically important logistic centre with access to markets in Europe and Russia. It is the largest city in the Baltic States and the third largest in the Region of the Baltic Sea.The city and its surrounding municipalities are not only home to more than half of the Latvian population but also contribute about 69% to national GDP.  Better urban policies improve the quality of life for a large share of the population,  boost economic performance by making the area more attractive, and can help retain young people who have emigrated from Latvia in large numbers, as argued in the 2017 Economic Survey of Latvia (OECD, 2017).

The city of Riga has lost inhabitants mostly to surrounding suburban municipalities in commuting distance, resulting in urban sprawl. Urban sprawl is driven by low density developments. It can give rise to socio-economic, transport, infrastructure and environmental concerns, with negative effects on economic performance and quality of life. Urban sprawl therefore increasingly contributes to congested roads and environmental pollution. For instance, between 2000 and 2010 the number of private vehicles in Riga increased by 60%, whereas the flow of incoming vehicles from surrounding areas of Riga doubled.

Riga Fuentes

Urban sprawl is driven by middle to high income households, contributing to a concentration of households with similar socio-economic status in neigbourhoods. Residential segregation can result in unequal access to quality education. Residential segregation in Riga is still lower than in other European capital cities but has been increasing. Latvia’s fiscal framework incentivises municipalities to follow a strategy that maximises their revenues by individually adjusting their spatial planning. This is because high income households generate more local tax revenues. Municipalities may lack incentives to provide amenities that might attract lower income households, such as social housing. While there is redistribution of tax revenue across municipalities, it only offsets a small part of the revenue differences.

To reap the benefits that come with urban agglomeration, Riga city and the surrounding municipalities need better co-ordination and joint strategic planning. The appropriate scale of such metropolitan governance needs to match daily mobility patterns of residents and ensure good co-ordination not only across local but also regional and national governments as well as across policy sectors (OECD, 2015a). Across the OECD, good metropolitan governance has shown to be linked to higher productivity, durably higher wages and better quality of life (Ahrend et al., 2014; OECD, 2015b). For example, residents’ satisfaction with public transport in metropolitan areas with a dedicated transport authority is higher and air pollution is lower. Metropolitan areas without tailor-made governance arrangements have experienced an increase in urban sprawl, whereas those with a metropolitan authority densified.

References

Ahrend, R., C. Gamper and A. Schumann (2014), “The OECD Metropolitan Governance Survey: A quantitative description of governance structures in large urban agglomerations”, OECD Regional Development Working Papers, Paris, http://dx.doi.org/http://dx.doi.org/10.1787/5jz43zldh08p-en.

OECD (2017), Economic Survey of Latvia, OECD Publishing, Paris.

OECD (2015a), Governing the City, OECD Publishing, Paris, https://doi.org/10.1787/9789264226500-en.

OECD (2015b), The Metropolitan Century: Understanding Urbanisation and Its Consequences, OECD Publishing, Paris, http://dx.doi.org/10.1787/9789264228733-en.


High uncertainty is weighing on global growth

By Laurence Boone, OECD Chief Economist

Less than 6 months ago, the global economy enjoyed healthy synchronised growth. Now, the landscape has changed. Global growth is hitting a plateau, uncertainties over the path forward abound, and risks from trade restrictions and tighter financial conditions have already started to materialise in some countries.

Global growth is projected to be at 3.7% in 2018 and 2019 in our latest Interim Economic Outlook, which remains an elevated pace. At the same time, it also reflects weaker prospects than anticipated just a few months ago, and some fragilities. Growth performance has become less synchronised across the world: while it remains strong in the United States, India and China, it has faltered in many other economies. Unemployment has continued to decline and is now below its pre-crisis level in the OECD, but wage growth remains persistently weak, raising uncertainties about how much spare capacity remains in the labour market. In other words, many workers would like to work more hours in Europe, or have left the labour force in the United States, fueling poor well-being perceptions.

GDP projections 20-08-2018

More worryingly, risks – trade, emerging economies’ sensitivity to tightening financial conditions, politics, finance – are intensifying, casting shadows over the outlook for the coming months and years.

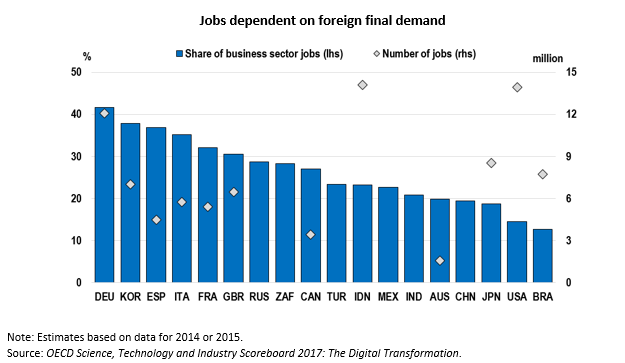
The consequences of rising trade restrictions are already visible. World trade in goods has markedly slowed in recent months, with acute impacts in the sectors directly targeted. For instance, the prices of washing machines for US consumers jumped by 20% between March and July this year after the imposition of tariffs. US imports of steel from China are sharply down, just like Chinese imports of cars from the US. Down the line, higher tariffs mean higher prices for consumers, less investment and less jobs for workers, and ultimately losses in productivity and standards of living. Just consider that 13 million jobs in the US and 8 million in Japan depend, directly or indirectly, on foreign consumption.

Jobs dependent 20-09-2018

Another risk that has started to dent growth is, in emerging market economies (EMEs), the effect of rising interest rates and US dollar appreciation. Argentina and Turkey, having significant shares of debt in foreign currency, large external financing needs and high domestic inflation, have been the most exposed to turbulence in currency markets. Other EMEs with high foreign reserves, credible monetary frameworks and prudent fiscal policies, are better equipped to withstand shifts in investors sentiment that are unavoidable as monetary policy normalises around the world. Floating exchange rates have played their cushioning role which has limited contagion so far, but measures to ensure persistent macroeconomic policy credibility and resilience in more vulnerable economies are essential to safeguard financial stability.

In Europe, political risks could harm growth and social cohesion. Brexit is an obvious source of uncertainty. It is vital that a deal is struck that maintains the closest possible relationship between the United Kingdom and the European Union. As for Italy, public finances need to respect EU rules, ensure debt sustainability while privileging productive investments badly needed to raise growth. More largely, the EMU policy framework needs to be strengthened along the commitment made in the wake of the euro area crisis to enhance confidence, growth and ensure the euro area thrives as it should.

As we mark the tenth anniversary of the financial crisis, there is no denying that some lessons have been learned: banks are now better capitalised, and financial regulation has been stepped up thanks to a large extent to international coordination. But in other areas, financial risks have built up again. Debt has reached unprecedented highs, particularly in the public sector and for corporate debt. Less regulated shadow banking has expanded rapidly. In some countries, equity prices and housing markets are further cause for concern.

In light of the many risks, what should policymakers do?

The immediate priority is to preserve business confidence and investment by reducing policy uncertainty – including by restoring international dialogue to avoid the escalation of trade restrictions. Enhancing resilience is also key in the financial sector as well as, in the case of Europe, by completing the banking union launched in 2012.

In case risks materialise further, there is little space left for monetary policy to react in advanced economies. This makes it all the more important for countries currently enjoying strong growth not to widen fiscal deficits to support an already vibrant consumption, but instead to rebuild room for manoeuvre for those which lack it, and expand public investment to shore up the foundations for sustained growth for all.

At the same time, to foster thriving societies and provide a durable response to political tensions, structural policies should focus on ensuring all people have access to better opportunities. In the long term, the keys to healthy productivity gains and growth that benefits all lie in quality education, from early childhood to lifelong learning, and in offering  better support for all workers to find good and fulfilling jobs. This is vital to reduce political uncertainty in a sustainable manner.

Reference

OECD Interim Economic Outlook, September 2018.


Speeding up economic catch-up in the BRIICS with better governance and more education

by Yvan Guillemette, Macroeconomic Analysis Division, Economics Department

Economic research has established that a large part of income disparities between poor and rich countries can be attributed to differences in governance and in the quantity and quality of human capital. In the latest long-run reference scenario published by the OECD, GDP per capita growth is relatively strong in the BRIICS in the coming decades, but living standards nevertheless remain less than half those of the United States in 2060, in part because of remaining gaps in governance and educational attainment. But the BRIICS can accelerate economic catch-up by improving these aspects of the economic environment, as demonstrated in an alternative scenario.

The quality of governance depends on a cluster of related institutions, including economic, political, legal and social aspects. In the model behind the long-run projections, institutional quality is proxied by a rule of law index, one of six governance indicators regularly updated by the World Bank. It is a perceptions-based index intended to capture “…the extent to which agents have confidence in and abide by the rule of society, and in particular the quality of contract enforcement, property rights, the police, and the courts, as well as the likelihood of crime and violence”. In the model, improved governance not only raises productivity in the long run, but it also boosts the speed at which the full long-run effects of reforms are attained, including in other domains, such as education.

Education not only embeds knowledge and skills in individuals, raising their productivity, but it also encourages participation in groups, opens doors to job opportunities, develops social interactions, makes individuals better aware of their rights, improves health, reduces poverty and facilitates the sharing and transmission of knowledge needed for developing new technologies.

The potential for reforms in these areas to improve long-run economic prospects in the BRIICS can be illustrated by comparing the reference scenario – featuring no change to governance and only a “most likely” evolution of educational attainment – with an alternative scenario in which governance is strengthened and bigger gains in educational attainment are made. The alternative scenario assumes that rule of law scores and mean years of schooling in the BRIICS catch up to the OECD medians over the 2020-to-2060 period.

Better governance and higher educational attainment raise an economy’s productivity, allowing living standards to rise. The gains build up slowly over time but by 2060, annual growth in living standards in the BRIICS is roughly 2 percentage points higher than in the reference scenario (see figure), and levels are between 30% and 50% higher. The positive growth impacts from the reforms would start tapering off gradually after 2060 while the level impacts would continue to accumulate, corresponding to the long lags involved in benefitting fully from structural reforms. In terms of relative importance, strengthening governance makes the largest contribution in this alternative scenario, with two thirds of the aggregate BRIICS effect. It is particularly important in Russia, while Brazil, China and India also have much to gain by improving educational attainment.

Projected annual growth in living standards in BRIICS Sept 2018

The results underscore the importance for the BRIICS of targeting education and governance as areas for improvement, and of taking a long-term view of their importance for growth and well-being. And while the BRIICS are used here for illustrative purposes, other countries could similarly benefit from faster gains in education and from governance reforms. Notably Argentina, Colombia, Mexico and Turkey score relatively low on governance.

Further reading:

Guillemette, Y. and D. Turner (2018), “The Long View: Scenarios for the World Economy to 2060”, OECD Economic Policy Papers, No. 22, OECD Publishing, Paris, https://doi.org/10.1787/b4f4e03e-en.

Gönenç, R. (2017), “The middle income plateau: Trap or springboard?”, OECD Economics Department Working Papers, No. 1446, OECD Publishing, Paris, https://doi.org/10.1787/9cba114b-en.


Statistical Insights: An x-ray view of inflation

Stat-Insights-200_fw

By Pierre-Alain Pionnier, Francette Koechlin, Anne-Sophie Fraisse and Elena van Eck.

Inflation may be present in some parts of an economy but not others. Contributions to annual inflation show how much different product groups contribute to overall inflation in a given year.

The measure is a useful tool to understand where inflation is occurring in different countries, analyse trends in inflation over time, and identify volatile and stable components of inflation. It may also help explain why consumers’ perceptions of inflation sometimes differ from official figures.

This Statistical Insight uses figures for Germany, Japan and the United States (US) to illustrate the usefulness of data on contributions to inflation.

Analysing inflation by component

In addition to aggregate national Consumer Price Indices (CPIs), the OECD provides data on the contributions to annual inflation of 12 standard product groups and special aggregates.

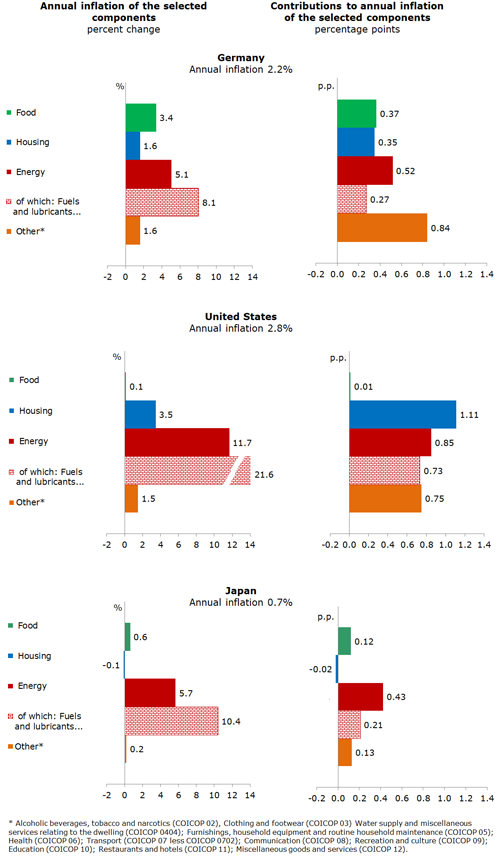
Figure 1 shows that in Germany, Japan and the US, aggregate inflation hides wide variations in price movements across product groups. In Germany, while overall prices increased by 2.2% in the year to May 2018, food and housing prices increased by 3.4% and 1.6% respectively. In the US, energy prices increased by 11.7%, and gasoline prices by 21.6%, while overall prices only increased by 2.8%.

The contribution of a given product group to overall inflation depends both on the price change of the relevant product group and on its share in consumers’ expenditures. The shares vary between countries. For example, households spend around 20% of their incomes on housing in Germany and Japan, but over 30% in the US. The high share of housing costs in US households’ budgets meant that price changes in those costs contributed most to overall US inflation in the year to May 2018, even though energy prices rose much faster than housing prices. In fact, energy prices shot up everywhere, but only in Japan was energy the largest contributor to overall inflation.

It may also be the case that consumers are more sensitive to movements in the prices of items they purchase frequently. For example, they may feel that inflation is high if the prices of food items are rising quickly, even though food products and non-alcoholic beverages represent less than 10% of households’ expenditures in the US, around 10% in Germany, and less than 20% in Japan.

Figure 1. Annual inflation rate (%) and contributions of selected components
May 2018, Germany, United States and Japan

Contribution-inflation-Fig1

Recent trends in overall and core inflation (2012-2018)

Because food and energy make volatile contributions to inflation, economists often focus on a consumption basket that excludes them in order to better understand and forecast long-term developments in inflation. The resulting numbers are called underlying, or core, inflation.

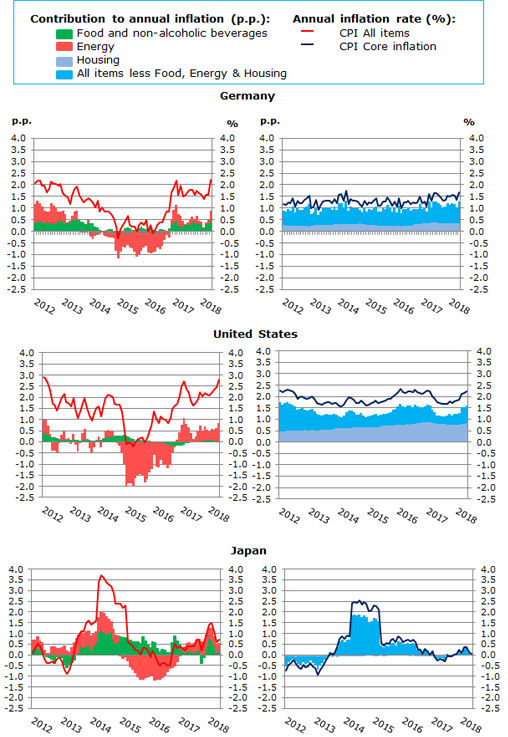
Figure 2 shows that energy contributed to the bulk of inflation fluctuations between 2012 and 2018. Changes in energy prices are dominated by movements in world crude oil prices, but exchange rate fluctuations also play a role because oil prices are usually fixed in US dollars. In 2015, for example, oil prices fell but at the same time the euro and the yen depreciated against the US dollar, so that oil prices in those currencies did not fall as much as they did in dollars. This meant that falling oil prices did not reduce inflation as much in Germany and Japan as in the US.

Even after excluding volatile food and energy prices, core inflation rates vary significantly across countries. Figure 2 shows that core inflation in Japan has long been lower than in Germany and the US, except for a blip in 2014-15 caused by a hike in value-added tax. Since 2016, core inflation in the US has also been consistently higher than in Germany. The major contributor to these differences is housing prices, which have risen faster in the US than in Germany, and faster in Germany than in Japan. Note that housing prices correspond to housing rentals (including imputed rentals for owner-occupied dwellings) and maintenance costs. This ignores the purchase prices of houses and apartments, which are considered as investments rather than consumption and are covered by separate price indices.


Figure 2. Annual inflation rates (%) and contributions of selected components (percentage points)
2012-2018, Germany, United States and Japan


Contribution-inflation-Fig2

The measure explained

Contributions to annual inflation represent the contributions to overall inflation in percentage points by different product groups. The contribution of each product group depends both on the price change in the relevant product group and its weight in households’ expenditures.

The OECD calculates contributions to inflation based on national data for all countries except Austria, Chile, Finland, Mexico, the Netherlands, Poland, Sweden, and the United Kingdom, whose National Statistics Offices provide the data directly. For further information please see OECD CPI FAQs.

Where to find the underlying data