The social exclusion of Roma in the Slovak Republic calls for immediate policy action
Category: Inequality,Slovakia,Uncategorized
written by oecdecoscope | February 5, 2019
by Gabriel Machlica, Slovak Republic Desk, OECD Economics Department
The Slovak Republic has one of the continent’s largest Roma populations. Estimates differ, but it is assumed that they account for about 8% of the population The Roma communities vary based upon geographic location and the level of integration. Nevertheless, the average level of ethnic segregation is exceptionally high and Roma face social exclusion in almost every aspect of everyday life (Table 1.1.).
The Roma can be trapped in a cycle of poverty for generations. If a child starts her or his life with limited access to education and lives in poor housing conditions, there is a high probability she will end up in poverty too. Indeed, results for Roma show exceptionally weak upward social mobility between generations. The probability that Roma born in concentrated residential area become unemployed or earn less than minimum wage in irregular work is almost 70%.
Investment in Roma integration cannot only help improve the well-being of disadvantaged groups, but also yield positive fiscal returns from improved employment prospects. The Economic Survey of the Slovak Republic shows that increasing the Roma employment rate and their productivity to the level of the general population by the end of 2060 would increase GDP by more than 12% with the economy growing faster on average by 0.3 p.p. per year.
The pension system in Hungary is under pressure from demographic changes
Category: Uncategorized
written by oecdecoscope | February 5, 2019
by Ania Thiemann, Hungary Desk, OECD Economics Department
Over the next 50 years, the old-age dependency ratio will double, and public spending on pensions and health-care is set to increase. People will also spend more time in retirement. The 2019 Economic Survey of Hungary is assessing the demands on public finances arising from this population-ageing challenge.
At present, public spending on public pensions is among the
lowest in the OECD, but it is expected to increase by some 3 percentage points
of GDP by 2070. This estimate may be on the low side. OECD work suggests that
ageing-related costs could rise by as much as 4 percentage points more of
GDP, for instance, if expected economic growth fails to materialise, or if
people live longer than projected.
An additional concern is a high risk of old-age poverty. Already today, some 20% of pensioners receive pensions below the poverty line. Looking ahead, the earnings-related pension system will secure good pensions for individuals with full careers. Improved employment prospects will therefore address a part of the poverty issues. For others, with interruptions in their careers, for instance because of unemployment, there is a risk of low pensions, or even old-age poverty. This because the impact of career breaks on pension entitlements is larger than elsewhere in the OECD.
OECD work suggests that the way forward to address these problems
includes a longer working life, improved predictability of pension outcomes,
and the introduction of a basic safety-net pension for all. Reforms in this area also have to
take into account the need for securing more actuarial neutrality and fairness
in the Hungarian pension system.
Hungary spends relatively little on its public health-care system and outcomes are below the OECD average. Mortality rates are high and Hungarians spend less time in good health in old age.
The system is not efficient, but problems are also related to life-style factors, such as smoking and high alcohol consumption. Additional concerns include uneven access to health care, particularly in rural areas. The 2019 Economic Survey of Hungary points out that addressing these problems is likely to require a significant increase in public spending. That said, there is also scope to improve the use of current resources to achieve better outcomes. This includes a larger role for the family doctor (GPs) as a gate-keeper to provide guidance for patients in the system. In addition, larger, more specialised and more independents hospitals can lead to a better use of resources and better quality treatments.
Selected References: Becker, U. (ed.) (2018), Long Term Care in Hungary, Springer, Cham., https://doi.org/10.1007/978-3-319-70081-6.
Freudenberg, C., T. Berki and A. Reiff (2016), “A Long-Term Evaluation of Recent Hungarian Pension Reforms”, MNB Working Papers 2.
Gaál, P. (2004), Health Care Systems in Transition: Hungary, WHO Regional Office for Europe on behalf of the European Observatory on Health Systems and Policies.
Statistical insights: Are international productivity gaps as large as we thought?
by Nadim Ahmad, OECD Statistics and Data Directorate
Labour productivity is a key indicator of economic wellbeing, and
raising it – producing more goods and services from the same or less work (labour
input) – is one of the main drivers of sustainable economic growth.
Historically, comparisons of productivity across countries have shown substantial
gaps, even between similar-sized economies at a similar stage of development – leaving
many analysts struggling to understand the causes. However, a new OECD study has
found that at least a part of these gaps disappears once we adjust for differences
in how countries measure labour input.
In the case of the United Kingdom for instance, the study reveals that
the gap in labour productivity levels with the United States, is around 8
percentage points smaller than was previously thought – closing from 24% to
16%. The gap with Germany shrinks from 22% to 14% and with France from 20% to
11%.
How is labour input measured?
For productivity
measures, labour input is most appropriately defined by the total number of hours actually worked by all persons
engaged in production, i.e. employees and self-employed (OECD, 2001). Hours
worked include all hours effectively used in production, whether paid or not, but
they exclude hours not used in production (e.g. annual and sickness leave),
even if some compensation is received for them. In practice, countries adopt
one of two methods to estimate average hours worked for productivity estimates:
(i) the direct method, which takes actual hours
worked reported by respondents in surveys, generally labour force surveys (LFS);
and
(ii) the component method, which starts from contractual, paid or usual hours per week from
establishment surveys, administrative sources or, indeed, the LFS, with
adjustments for absences and overtime and indeed other adjustments that are
necessary to align with concepts of output in the national accounts, for
example concerning cross-border workers.
What impact do these different approaches have on international comparisons?
Whilst the
‘direct’ approach appeals due its simplicity, it depends heavily on respondent
recall, cannot account for response bias, and, moreover, assumes a perfect
alignment of workers and measures of output. The component approach is more
complex, but it systematically attempts to address these issues. To give some
sense of the potential impact of these different approaches on the
international comparability of hours worked, the OECD has used the LFS and
complementary sources to estimate national hours worked using both a direct
approach and a (simplified) component
method.
Our results provide
strong evidence that response bias and a lack of exhaustive adjustments to
align with the underlying conceptual boundary GDP, lead to systematic upward
biases in estimates based on the direct method, which are, in turn, always higher
than those compiled using the simplified component approach.
Figure 1 presents official estimates of hours worked in countries’ national accounts, and compares them with the OECD simplified component method estimates for those countries that currently use a direct method with minimal or no adjustments in their official statistics.
The corollary
of lower hours worked of course, is higher labour productivity levels. Figure 2
shows labour productivity levels, referenced to the United States, using official
national accounts average hours worked estimates, comparing them with new
results from the OECD simplified component approach for countries using the
direct method.
Overall, the results point to a reduction in relative productivity gaps of around 10 percentage points compared with current official estimates in many countries. While the broad picture is maintained, notable international ranking changes see the United Kingdom outperforming Italy, and Austria moving ahead of France, the Netherlands, Switzerland and Germany.
The OECD revised hours worked estimates explained
The simplified
component method used in the paper takes usual weekly hours worked in a
person’s main job from the EU Labour Force Survey (EU LFS) and the Current
Population Survey of the United States (CPS), as its starting point.
Adjustments for the key components of weekly working time are made using
self-reported data on overtime, flexible hours and hours on additional jobs.
Finally, the method accounts for weeks not worked, i.e. holiday and vacation
weeks, full and part-week absences for non-holiday reasons, and absences due to
sickness and maternity.
Statutory leave entitlements are used as a proxy for actual annual leave taken in this paper. It is important to note that this implicitly assumes that workers in all countries take, on average, all the leave to which they are entitled. However, this is not necessarily the case, as among other factors, actual take-up rates are likely to reflect differences in working cultures across countries. For this and other reasons, these new estimates should be considered only as a stop-gap for those countries currently using a direct method with minimal or no adjustments. In this respect it is important to note that most countries are already beginning to work towards improving their methodologies in line with the recommendations made as part of this research exercise, and others will begin to do so.
What’s the impact on growth rates?
While the
approach recommended in the paper clearly highlights the current bias in
international comparisons of productivity
levels, it does not follow that the same holds for international
comparisons of productivity growth rates;
growth estimates would only be distorted if the impact of the adjustments
required showed significant disproportional change over time. Indeed,
implementing the simple component approach reveals no systematic bias in growth
rates.
Minor differences do occur however, and, so, to avoid introducing differences with national estimates of productivity growth (and those that can be derived from the OECD’s national accounts data), the OECD will take estimates of average hours actually worked (levels) using the simplified component method in 2016 as a benchmark, and project series forwards and backwards using official (national) productivity growth rates.
How will these results be incorporated into the OECD’s productivity database?
At this stage, based on the data available to the OECD, the implementation of the simplified component method will apply to the following countries: Austria, Estonia, Finland, Greece, Latvia, Lithuania, Poland, Portugal, Sweden and the United Kingdom. It is important to stress that the use of the simplified component method is intended to be only a stop-gap until such a time that these countries are able to align their estimation methods and estimates with the underlying national accounts concepts and that correct for self-reporting bias; indeed many countries are already moving in this direction.
Current efforts of the OECD are necessarily restricted to comparisons of labour productivity levels for the whole economy, but future work will look to explore whether and how labour input measures at the industry level can also be improved. In the meantime, for the 10 countries listed above, estimates of hours worked by sector will be constrained (pro-rata) to those at the whole economy level.
These changes will be incorporated into the OECD Productivity Statistics database and the OECD Average annual hours actually worked per worker dataset by the end of January 2019, along with corresponding metadata.
Further reading
OECD (2001), Measuring
Productivity – OECD Manual: Measurement of Aggregate and Industry-level
Productivity Growth, OECD Publishing, Paris, http://dx.doi.org/10.1787/9789264194519-en.
Ward, A., M.
Zinni and P. Marianna (2018), “International productivity
gaps: Are labour input measures comparable?”, OECD Statistics
Working Papers, No. 2018/12, OECD Publishing, Paris, https://doi.org/10.1787/5b43c728-en.
How can public finance reforms boost economic growth and enhance income equality?
Category: Public finance,Uncategorized
written by oecdecoscope | February 5, 2019
by Boris Cournede, Head of Public Finance Workstream, OECD Economics Department
Most OECD countries have very large government sectors: public expenditure amounts to 43% of economic activity, measured by GDP, on average across OECD countries. This proportion exceeds 50% in four OECD countries. The programmes on which governments spend have thus deep implications for people’swell-being and a country’s economic fortunes. Similarly, the choice and design of taxes that fund expenditure will also shape economic decisions and influence people’s choices to work, invest and consume.
New OECD empirical work has identified lessons provided by the experience of OECD countries over the past three decades. These empirical investigations shed light on the effects of public finance on economic activity as well as on the distribution of income across households.
First, large governments can be compatible with high levels of economic activity: the condition is that governments provide their services very efficiently. The Nordic countries display the levels of government effectiveness at which governments can be large without weighing on growth. Where governments are less effective, reducing their size can be expected to lead to higher growth; however, reducing the size of government typically entails arise in income inequality, because public expenditure, and especially transfers, are a powerful equaliser of incomes.
Second, leaving aside questions about government size, many public finance reforms that change the composition of spending or the mix of taxes offer the potential to boost economic activity and household incomes:
Some reforms can boost overall economic activity while reducing income gaps:
One important reform of this nature is to reduce the effective tax that low-income workers face (taking into account the withdrawal of benefits) and funding this change through proportional increases in other taxes.
Another reform that belongs in this win-win category for higher activity and less inequality is to increase inheritance taxes and use the proceeds to reduce other taxes proportionally.
A number of public finance reforms can increase activity without altering income differentials, thereby “lifting all boats”roughly equally. They include:
Higher public investment, while reducing other spending programmes by the same amount;
Higher recurrent property taxes, while lowering other taxes by as much;
Lower effective rates of corporate income tax,while increasing other taxes.
One public finance change that benefits the poor with no substantial effect on overall activity is to expand spending on family policy while reducing other spending programmes by the same amount.
Finally, a number of changes to the structure of public finance can be expected to boost economic activity but widen relative income gaps yet leave no income group worse of in absolute terms. Such reforms include:
Lowering public subsidies, while increasing other expenditure categories by as much, giving priority to the most favourable for growth such as investment and education;
Lowering net wealth taxes while raising other taxes by the same amount;
Easing the tax burden on workers earning above-average wages while increasing other taxes to make up for the revenue shortfall.
The empirical work shows that reforms of sizes that correspond to changes that have been observed in OECD countries in the past three decades can have substantial effects on economic activity (Figure). This work can help select reform priorities in the light of their expected overall economic benefits and their distributional consequences, which will determine how inclusive, and therefore acceptable in political terms, they are likely to be. Importantly, the exact choice and design of the reforms will also have to reflect country specificities in terms of institutions and preferences.
Read more:
Cournède, B., J.-M. Fournier and P. Hoeller (2018), “Public Finance Structure and Inclusive Growth, “ OECD Economic Policy Paper, No. 25. https://www.oecd-ilibrary.org/economics/public-finance-structure-and-inclusive-growth_e99683b5-en
Akgun, O., D. Bartolini and B. Cournède (2017),“The Capacity of Governments to Raise Taxes”, OECD Economics Department Working Papers, No. 1407, OECD Publishing, Paris, http://dx.doi.org/10.1787/6bee2df9-en.
Akgun, O., B. Cournède and J. Fournier (2017),“Effects of the Tax Mix on Inequality and Growth”, OECD Economics Department Working Papers, No. 1447, OECD Publishing, Paris, http://dx.doi.org/10.1787/c57eaa14-en.
Fournier, J. (2016), “The Positive Effect of Public Investment on Potential Growth”, OECD Economics Department Working Papers,No. 1347, OECD Publishing, Paris, http://dx.doi.org/10.1787/15e400d4-en.
Fournier, J. and Å. Johansson (2016), “The Effect of the Size and the Mix of Public Spending on Growth and Inequality”,OECD Economics Department Working Papers, No. 1344, OECD Publishing, Paris, http://dx.doi.org/10.1787/f99f6b36-en.
Some Australians are at a significant risk of poverty, despite the strong economy
Category: Australia,Uncategorized
written by oecdecoscope | February 5, 2019
by Urban Sila, Australia Desk, OECD Economics Department
Australia is a successful economy with high living standards. It has recorded 27 years of uninterrupted GDP growth. Incomes have grown strongly across the entire range of the income distribution and the incidence of both absolute and relative poverty have declined. Despite this improvement, quite a significant share of Australians live in relative poverty. About 13% of Australians live in households with incomes below the poverty line – less than half of the median household income.
The recent OECD Economic Survey of Australia and accompanying paper (Sila and Dugain, 2018) use OECD and Australian data (the HILDA, household panel survey) to establish which groups are vulnerable to poverty. The analysis uses the concept of relative poverty. Specifically, individuals are classified as poor if they live in households that earn below 50% of the median equivalised household income in a given year.
Certain groups are more at risk of poverty than others. People living alone and lone parents are at higher risk of poverty. Although poverty in old age has declined in the last 15 years, it nevertheless remains high. Old people in Australia have more than 30% chance of living in poverty, a high figure in international comparison. However, Australia stands out less in measures of poverty that correct for housing costs, as many older people in Australia are homeowners.
As regards the working-age population, those out of the labour force and the unemployed are at much higher risk of poverty. In addition, casual workers and part-time workers are at risk, as are people with low education and skills.
Indigenous Australians are almost twice as likely to be poor than the rest of Australians, and according to the HILDA data, the gap has not been closing over the past 15 years. Indeed, the gap has risen over last two years. Furthermore, statistical analysis shows that indigenous status remains a strong explanatory factor of poverty even after controlling for education, age, industry, skill and remoteness. This means that high poverty among indigenous people reflects a range of unobserved socio-economic issues, including poor health and discrimination.
Sila, U., and Dugain, V. (2018), Characteristics of people at risk of poverty in Australia: Evidence from the HILDA survey, OECD Economics department working paper, forthcoming.
The output cost of the global financial crisis
Category: Productivity,Uncategorized
written by oecdecoscope | February 5, 2019
By David Turner and Patrice Ollivaud, OECD Economics Department
Assessing the damage from the Global Financial Crisis (GFC) is not straightforward, even with the benefit of hindsight provided by ten years of history, because the counter-factual of what might have happened in its absence is unknowable. However, a simplistic, but commonly adopted approach, of comparing the post-crisis path of GDP with the pre-crisis trend exaggerates the cost and can lead to misleading policy conclusions. Such an approach is akin to treating the GFC as a meteorite from outer space which is completely unrelated or ‘exogenous’ to preceding macroeconomic developments. This is implausible because the pre-crisis trend in GDP involved unsustainable trends in asset prices, most obviously house prices, driven by a long period of rapid excessive credit growth across most of the advanced economies. Similarly ageing has started to progressively reduce the contribution from labour in many economies, so reducing their growth capacity. Hence, the counter-factual represented by the extrapolation of the past trends in GDP was never realistically attainable. A more plausible basis for a counter-factual is an extrapolation of pre-crisis trends of potentialoutput, where potential output is an estimate of a sustainable measure of GDP [1]. The difference between these two approaches is first illustrated by considering the OECD countries as a group and using aggregated measures of potential output that are regularly published in the OECD Economic Outlook. A simple-minded extrapolation of OECD-wide GDP per capita implies an ever-widening loss, which is currently more than 10% of GDP, whereas compared to a pre-crisis extrapolation of potential output per capita implies a smaller loss of around 2-3 percentage points of GDP (Figure 1).
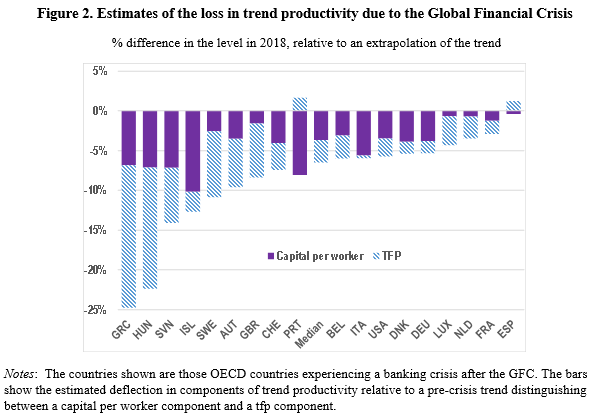
However, the estimated cost of 3% of GDP for the OECD as a whole hides large variations across countries. Among the 19 OECD countries that experienced a banking crisis, following the same approach, the median loss in output is more than double that, at around 6%.
The estimates of potential output also provide an estimate of how the loss was incurred and some clues as to some policy lessons that might be drawn. Perhaps surprisingly, in nearly all OECD countries, aggregate employment rates have recovered and are close to, or have even surpassed, the pre-crisis levels, although some groups (for example young workers) have suffered more permanent losses than these aggregate calculations suggest. A notable exception is the United States, where the aggregate employment rate is still more than 3% below the pre-crisis level, which may be partly explained by the effects of opioid addiction [2].
Instead, the main lasting macroeconomic damage from the GFC is accounted for by lost productivity. OECD estimates suggest that for a majority of OECD countries experiencing a banking crisis, most of this lost productivity is accounted for by lower growth in capital per worker, rather than lower total factor productivity (tfp) (Figure 2). The loss in capital per worker illustrates how a severe adverse demand shock can be transformed into an adverse supply shock via an accelerator effect on investment that then reduces the capital stock [3]. In addition, increasing evidence, including from firm level studies, suggests that many countries where interest rates were particularly low in the pre-crisis period, especially in Southern Europe, experienced a substantial misallocation of capital. These countries are also among those that experienced a more abrupt post-crisis adjustment in capital stock growth. The fall in capital stock growth was also exacerbated in some countries by cutbacks in public investment after the crisis.
Conversely, much of the loss in tfp can be traced back to weakening trend tfp growth that pre-dates the Global Financial Crisis. This in turn would suggest that policy may be better directed to addressing more long-standing causes, such as the increasing divergence between productivity performance of frontier and laggard firms, which may be symptomatic of rising entry barriers and reduced contestability [4].
References:
[1] The approach described here represents an update of the calculations presented in:
[2] A more in-depth analysis of post-crisis trends in employment and labour force participation in the United States, including the effect of the opioid crisis, is provided by:
[3] A more detailed analysis of the effect of the crisis on productivity in OECD countries, in terms of its effects on capital per worker and tfp, is provided by:
[4] Evidence on the difference between the productivity performance of firms at the global frontier and laggard firms, as well as possible causes and policy responses, is provided by:
By David Law, Spain desk, OECD Economics Department
Spain continues to recover from the economic crisis with strong growth and falling unemployment, as highlighted in the latest OECD Economic Survey of Spain (OECD, 2018). If the recovery is to be sustained, it is vital that the benefits of economic growth are shared as high rates of income and wealth inequality can harm economic growth and productivity, and limit productive investment opportunities.
Income inequality is relatively high in Spain (Figure 1) and it increased during the crisis, as employment fell significantly and income disparity grew. The risk of being in poverty now varies greatly across regions and the rate of child poverty is particularly high, at 22% in 2015, which is well above the OECD average of 13%. The risk of poverty is especially high for children living in migrant and single parent families. With some positive developments in the labour market since 2015, income inequality and poverty rates are likely to have improved somewhat, however, these issues are expected to remain a concern for some time.
Wealth inequality in Spain appears relatively low in international perspective, reflecting high rates of home ownership. However, as is the case in other countries, wealth inequality is higher than income inequality with the top 10% of households holding close to half of all wealth, compared to around one fifth for the bottom 60% of households. Wealth inequality seems likely to rise over time, given changes in the distribution of income and recent labour market trends. Indeed, new work undertaken by the OECD using household survey data shows that wealth inequality already increased between 2011 and 2014 in Spain, and that the income and wealth mobility of households exhibit a degree of persistence, which can exacerbate inequalities (Martinez-Toledano et al., forthcoming).
The tax and transfer system in Spain could do more to tackle inequality. Low-income households receive less cash transfers than higher-income ones, with those in the bottom 20% of the income distribution receiving only around 55% of the average payment across all families, compared to the top 20% receiving over 60% more than the average family (Figure 2). Better targeting of transfers, so more is received by those who need them the most, would reduce inequality. Additionally, the 2018 OECD Economic Survey of Spain notes the burden the tax system places on labour taxation and recommends that regressive reduced value-added tax rates be abolished and that the tax allowances granted for inheritance taxes for the most wealthy are reconsidered.
Reducing inequality in the long-run will also require sustained improvement in labour market outcomes. For instance, in 2017, unemployment among the young was 38.6%, long term unemployment as a share of the labour force was 7.7% and 27% of workers were on temporary contracts. The 2018 OECD Economic Survey of Spain makes a number of recommendations in this regard. For example, the Survey recommends increasing spending on training and job search assistance, the introduction of a profiling tool to adapt active labour market programmes to the needs of individual workers, and measures to boost the labour market participation of women, such as extending the provision of early childhood education. The Survey also discusses the role that targeted reductions in social security contributions could play in improving labour market outcomes for low wage workers and the benefits of greater use of firm-level collective agreements, and recommends continuing efforts to fight against the abuse of temporary contracts to reduce labour market duality.
Martínez-Toledano, C., D. Law, D. Haugh and M. Adalet McGowan (forthcoming), “The Business Cycle and Wealth and Income Mobility in Spain”, OECD Economics Department Working Papers, forthcoming.
Reducing regional disparities for inclusive growth
Category: Inequality,Spain,Uncategorized
written by oecdecoscope | February 5, 2019
By Müge Adalet McGowan, Spain desk, OECD Economics Department
Ensuring the benefits of growth are spread widely requires a strong focus on greater convergence of regions in terms of income and well-being. The GDP per capita in the best performing region was around double that in the worst performing region in 2016. Income inequality and poverty rates are also high, with regional differences.
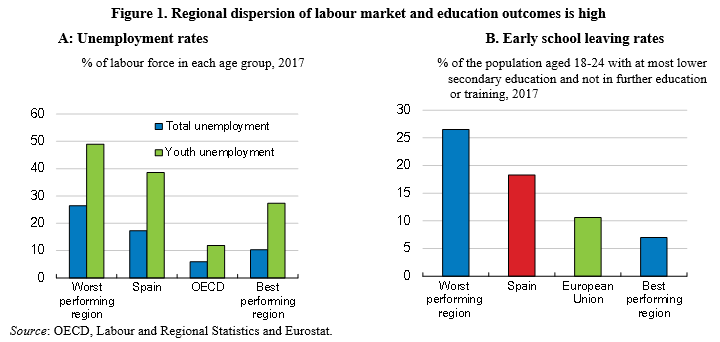
High regional dispersion in education and job outcomes, compounded by low inter-regional mobility, emerge as key drivers of regional inequalities in income and well-being (Figure 1). At the same time, productivity growth has stagnated in Spain (Figure 2). Barriers to achieving a truly single market limit productivity growth of regions, including the most advanced. Hence, the 2018 OECD Economic Survey of Spain highlights that a dual approach of enhancing both the productive and employment capacities of lagging regions is needed (OECD, 2018). Reducing regional disparities will also depend on effective coordination and sharing of best practices across regions.
Stronger coordination between employment and social services is key to providing effective transitions between social support schemes and employment, given the multiple barriers that the unemployed might face (Fernandez et al., 2018). Improving coordination to provide integrated support for jobseekers via a single point of contact for social and employment services and assistance would improve the effectiveness of such policies.
Lack of full portability of social and housing rights across regions, due to prior residency requirements, contributes to low labour mobility. The 2018 OECD Economic Survey of Spain recommends ensuring full portability of these benefits across regions, by providing temporary assistance either by the region of origin or the central government.
Increasing the quality of education would improve the employability of the labour force in lagging regions and should be complemented with policies to raise job quality in regions with low-skilled jobs. For example, providing individualised support to students at the risk of failing at an early stage has contributed to lower early school leaving rates in some regions. Increasing the adaptability of workers, via lifelong learning policies better targeting the participation of low-qualified adults, would improve the matching of skills to labour market needs.
Reducing regional regulatory differences is key to achieving a truly single market and firm growth. The 2018 OECD Economic Survey of Spain recommends strengthening the implementation of Market Unity Law through enhanced cooperation and coordination across different levels of government and the assessment of the compliance of new legislation at all levels of government with the principles of the Market Unity Law. Removing the remaining barriers in some professional services would also improve competition and boost productivity.
Fernandez, R., et al. (2018), “Faces of Joblessness in Spain: A People-centred perspective on employment barriers and policies”, OECD Social, Employment and Migration Working Papers, No. 207, OECD Publishing, Paris, https://doi.org/10.1787/6149118d-en.
Positive economic outlook for the main economies in Latin America but downward risks have intensified
Alvaro S. Pereira (Director) and Latin American desks, Economics Department, Country Studies Branch, OECD
The global economy is navigating rough seas. Global GDP growth is strong but it has peaked. In many countries unemployment is well below pre-crisis levels, labour shortages are biting and inflation remains tepid. Yet, global trade and investment have been slowing on the back of increases in bilateral tariffs while many emerging market economies are experiencing capital outflows and a weakening of their currencies. The global economy looks set for a soft landing, with global GDP growth projected to slow from 3.7% in 2018 to 3.5% in 2019-20. However, downside risks abound and policy makers will have to steer their economies carefully towards sustainable, albeit slower, GDP growth.
The economic recovery in the Latin American economies has become dissimilar. While in some countries, growth has been revised downwards, in others it has been revised upwards. This disparity is closely linked to how these economies have evolved in the face of the financial stress and increased financial volatility in recent months. The region’s economies with the best macroeconomic fundamentals, independent central banks, countercyclical monetary policies, sound fiscal policy framework and no major currency mismatches in corporate or sovereign debt, were better able to sail the adverse global financial conditions that led to capital outflows, weakening their currencies.
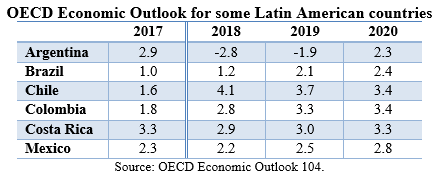
While Chile and Colombia have gained momentum, Brazil has shown lower growth and Argentina has fallen into recession. Mexico and Costa Rica have also experienced less momentum than expected. Growth in Argentina, Brazil, Chile, Colombia, Costa Rica and Mexico, countries covering about 85% of Latin America’s GDP, is expected to be around 1.4% this year and to accelerate to 2.0% in 2019 and 2.7% in 2020 (weighted average) (see Table). However, downside risks abound while the region is vulnerable to the global context. Several indicators, such as the fiscal and current account deficits have been accentuated in the last decade in most of these economies (Figure), suggesting that the region is still vulnerable. Needs to be noted that the situation is uneven and a broader list of indicators should be analysed.
An accumulation of risks could create the conditions for a harder-than-expected landing. First, further trade tensions would take a toll on trade and GDP growth, generating even more uncertainty for business plans and investment. Second, tightening financial conditions could accelerate capital outflows from the region and depress demand further. Third, a sharp slowdown in China would hit Latin America and other emerging economies, but also advanced economies if the demand shock in China triggered a significant decline in global equity prices and higher global risk premia.
Looking ahead, it will be necessary to strengthen the macroeconomic policy framework to reduce vulnerabilities where necessary. Most of the region’s economies are starting, or will start in the near future, more restrictive monetary policies, while also undertaking fiscal consolidation. Depending on each country, it will be important to find a balance between the needs for social spending and public investment, with the need to put debt on a sustainable path. In Chile, Colombia and Mexico, this consolidation can be done gradually, but Argentina, Brazil and Costa Rica need to do it more urgently. Pension or tax reforms will be necessary in this regard.
Given the limited scope for countercyclical policies, in the face of external risks and a more pronounced slowdown, the time to promote the necessary structural reforms is now to guarantee a future with a sustained increase in productivity and greater inclusion. Many countries in the region have scope to reform the tax system and make it more effective in improving investment incentives and raising more resources. Depending on the characteristics of each country, possible measures may include limiting the use of tax exemptions and reduced rates, particularly in VAT, but also in corporate taxes, extending the tax base by including more people in personal income taxes, reducing evasion or making greater use of property, inheritance or environmental taxes. Other priorities should focus on export promotion and diversification, which would help reduce current account deficits. Investing in quality and innovative human capital, closing infrastructure and logistical gaps, and curbing corruption would support exports and their diversification, strengthening growth. Encouraging women’s participation in the labour force, reducing precariousness and informality in the labour market, as well as pension reforms are also urgent in several countries of the region and necessary to increase productivity and reduce inequalities.
Argentina: A combination of massive fiscal and monetary tightening will keep the economy in recession during 2018 and 2019. Private consumption and investment will remain depressed due to lower real incomes and high interest rates, and unemployment will rise. However, a better harvest and a lower real exchange rate will support stronger exports.
Brazil: Growth will gain momentum during 2019 and 2020 as private consumption, supported by improvements in the labour market, will increase. Recovering credit and greater policy certainty as a new administration takes office will buttress the recovery. Political uncertainty around the implementation of reforms remains significant and could derail the recovery, but if uncertainty fades and reforms advance as assumed, investment will become stronger.
Chile: Growth is projected to remain strong over the next two years. With an uncertain external environment, solid domestic demand will underpin growth, aided by a stable inflation environment, public infrastructure projects and a tax reform. Inequality, though decreasing, remains high, as informality and unemployment remain high and social transfers low.
Colombia: Growth is projected to pick up as infrastructure projects, lower corporate taxes and higher oil prices will boost investment. Improving confidence and financing conditions will support consumption. As growth gains traction, unemployment will edge down. Social indicators are improving but informality and inequality remain high.
Costa Rica: Growth is projected to recover to around 3¼ per cent in 2020 and be broad-based, underpinned by both domestic and external demand. However, uncertainty, particularly surrounding the planned fiscal reforms, is weighing on growth in the near term. The projections are based on the assumption that the fiscal reforms will be implemented from 2019, with modest fiscal tightening holding back growth in 2019 and 2020.
Mexico: Growth is projected to pick up to 2¾ per cent in 2020. Low unemployment, strong remittances and the recovery of real wages will support household consumption. Investment, which has been persistently low, will strengthen on the back of announced public investment plans and increased confidence associated with the US-Mexico-Canada trade agreement. Exports will decelerate owing to less favourable global conditions, especially in the United States. Inflation has been pushed up by rising energy prices, but expectations and core inflation remain anchored and within the central bank’s target band. Informality is slowly declining but remains elevated, contributing to persistently high inequalities and low productivity.
To read more about the Economic Outlook and the main structural challenges visit the english and spanish/portuguese version (it includes OECD forecasts and a chapter on decoupling of wages and productivity and the implications for public policy).
Las perspectivas económicas son positivas en los principales países de América Latina pero los riesgos a la baja se han acentuado
Category: Argentina,Brazil,chile,Colombia,Costa Rica,Mexico,Posts in Spanish,Uncategorized
written by oecdecoscope | February 5, 2019
Alvaro S. Pereira (Director) y mesas de países latinoamericanos, Departamento de Economía, Directorado de estudios de países, OCDE
La economía mundial está navegando mares agitados. El crecimiento del PIB mundial es fuerte, pero ha alcanzado su punto máximo. En muchos países, el desempleo está por debajo de los niveles anteriores a la crisis de 2008, la escasez de mano de obra se empieza a sentir, aunque la inflación sigue siendo templada. Sin embargo, el comercio y la inversión mundiales se han desacelerado como consecuencia del incremento de aranceles bilaterales y de mayor incertidumbre política, mientras que varias economías emergentes están experimentando salidas de capitales y un debilitamiento de sus monedas. La recuperación del crecimiento global comenzará a desacelerarse, mientras que los riesgos a la baja se han acentuado. Se prevé que el crecimiento del PIB mundial disminuya del 3,7% en 2018 a 3,5% en 2019-2020. Sin embargo, abundan los riesgos de recesión y los responsables políticos tendrán que orientar cuidadosamente sus economías hacia un crecimiento sostenible, aunque más modesto, del PIB.
En las principales economías de América Latina, la recuperación económica se ha vuelto despareja. Mientras que en algunas, el crecimiento se ha revisado a la baja, en otras se ha revisado al alza. Esta disparidad está estrechamente ligada a cómo estas economías han evolucionado frente al estrés financiero e incremento de volatilidad financiera de los pasados meses. Las economías de la región con mejores fundamentos macroeconómicos, bancos centrales independientes, políticas monetarias contracíclicas, un marco de política fiscal sólido y sin grande descalce de monedas en la deuda corporativa o soberana, fueron los que sortearon mejor las condiciones financieras globales adversas que sometieron a varios países a una repentina salida de capitales y debilitamiento de sus monedas.
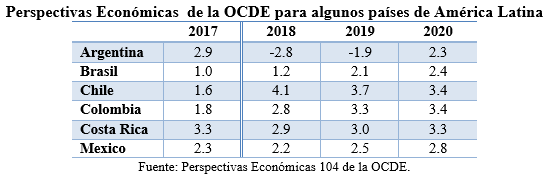
Mientras que Chile y Colombia han ganado ímpetu, Brasil ha mostrado menor crecimiento y Argentina ha caído en recesión. México y Costa Rica también han experimentado menor ímpetu al esperado. Se espera que el crecimiento en Argentina, Brasil, Chile, Colombia, Costa Rica y México, países que cubren alrededor del 85% del PIB de América Latina, se sitúe en torno al 1.4% este año y se acelere a 2.0% en 2019 y 2.7% en 2020 (promedio ponderado) (Tabla). Sin embargo, abundan los riesgos a la baja, mientras que la región se encuentra vulnerable al contexto global. Algunos indicadores, como los déficits fiscales y de cuenta corriente (Figura) se han acentuado en la mayoría de estas economías en la última década, sugiriendo que la región es aún vulnerable. Debe notarse que la situación es dispar y se debe mirarse una lista más amplia de indicadores.
Una acumulación de riesgos podría crear las condiciones para una desaceleración de crecimiento más acentuada de la esperada. En primer lugar, nuevas tensiones comerciales afectarían al comercio y al crecimiento del PIB, generando aún más incertidumbre para las empresas y la inversión. En segundo lugar, el endurecimiento de las condiciones financieras globales podría acelerar las salidas de capitales y deprimir aún más las monedas de la región. En tercer lugar, una fuerte desaceleración en China afectaría a la región y otras economías emergentes, pero también a las economías avanzadas si el shock de la demanda en China provocara un descenso significativo de los precios mundiales de las acciones y un aumento de las primas de riesgo mundiales.
De cara al futuro, será necesario reforzar el marco de las políticas macroeconómicas para reducir vulnerabilidades donde sea necesario. La mayor parte de las economías de la región están comenzando, o lo harán en el futuro próximo, políticas monetarias más restrictivas, al tiempo que también deben llevar a cabo una consolidación fiscal. Dependiendo de las holguras de cada país, será importante encontrar un ritmo que balancee las necesidades de gasto social y de inversión pública, con la necesidad de poner la deuda en una senda sustentable. En Chile, Colombia y México, esta consolidación se puede llevar a cabo de manera gradual, pero Argentina, Brasil y Costa Rica necesitan hacerlo de manera más urgente. Reformas pensionales o tributarias serán necesarias en este sentido.
Dado el escaso margen para hacer políticas contracíclicas ante la realización de riesgos externos y una deceleración más acentuada, el momento de impulsar reformas estructurales necesarias es ahora, para garantizar un futuro con incremento sostenido de la productividad y mayor inclusión. Muchos países de la región tienen margen para reformar el sistema tributario y hacerlo más eficaz para mejorar los incentivos a la inversión y recaudar más recursos. Según las características de cada país, posibles medidas pueden incluir limitar el uso de exenciones tributarias y tasas reducidas, en particular en el IVA, pero también en los corporativos, extender las bases de imposición incluyendo más personas en los impuestos a los ingresos personales, reducir la evasión o hacer mayor uso de impuestos a la propiedad, a la herencia o impuestos ambientales. Otras prioridades deberían focalizarse en fomentar las exportaciones, y diversificarlas, lo que ayudaría a reducir los déficits de cuenta corriente. Invertir en capital humano de calidad e innovación, cerrar las brechas de infraestructura y logística y frenar la corrupción apoyarían a las exportaciones y su diversificación, fortaleciendo el crecimiento. Alentar la participación de la mujer en la fuerza laboral, reducir la precariedad e informalidad del mercado laboral, así como reformas al sistema de pensiones son también urgentes en varios países de la región y necesarios para aumentar la productividad y bajar las desigualdades.
Argentina: La economía seguirá en recesión en 2018 y 2019 debido a un endurecimiento fuerte y simultáneo de políticas monetarias y fiscales. El consumo privado y la inversión seguirán siendo bajos a causa del descenso de los ingresos reales y de los elevados tipos de interés, y aumentará el desempleo. Sin embargo, una mejor cosecha y un tipo de cambio real más competitivo contribuirán al aumento de las exportaciones.
Brasil: El crecimiento cobrará impulso en 2019 y 2020 gracias al aumento del consumo privado, respaldado por mejoras en el mercado laboral. La reactivación del crédito y el descenso de la incertidumbre política una vez que el nuevo gobierno tome posesión apuntalarán la recuperación económica. La incertidumbre política sobre la implementación de reformas sigue siendo importante y podría frenar la recuperación pero, si desaparece y las reformas siguen adelante como se supone que deberían hacerlo, aumentará la inversión.
Chile: Según las proyecciones, el crecimiento seguirá aumentando en los próximos dos años. Ante una incierta coyuntura externa, el crecimiento estará respaldado por la sólida demanda interna con ayuda de un entorno de inflación estable, proyectos de infraestructuras públicas y una reforma fiscal. A pesar que las desigualdades han disminuido, permanecen altas, debido a que la informalidad y el desempleo siguen siendo elevados y las transferencias sociales escasas.
Colombia: Las proyecciones indican que el crecimiento repuntará, ya que los proyectos de infraestructuras, el descenso del impuesto de sociedades y la subida de los precios del petróleo potenciarán la inversión. La mejora de la confianza y de las condiciones de financiamiento respaldará el consumo. A medida que el crecimiento se vaya afianzando, el desempleo descenderá. Los indicadores sociales están mejorando, aunque la informalidad y la desigualdad se mantendrán en niveles elevados.
Costa Rica: Según las proyecciones, el crecimiento se recuperará hasta el 3¼ aproximadamente en 2020 y será generalizado, sostenido tanto por la demanda interna como externa. Sin embargo, la incertidumbre, particularmente respecto a las reformas fiscales planificadas está lastrando el crecimiento a corto plazo. Las proyecciones parten del supuesto de que las reformas fiscales se aplicarán a partir de 2019, con un modesto ajuste fiscal que frenará el crecimiento en 2019 y 2020.
México: Está previsto que el crecimiento repunte hasta el 2¾ por ciento hacia 2020. El bajo nivel de desempleo, fuertes remesas y la recuperación de los salarios reales reforzarán el consumo de los hogares. La inversión, que ha sido persistentemente baja, se reforzará a consecuencia de los planes de inversión públicos anunciados y del aumento de la confianza vinculado al acuerdo comercial entre Estados Unidos, México y Canadá. El crecimiento de las exportaciones se reducirá debido a unas condiciones internacionales menos favorables, en especial en Estados Unidos. La subida de los precios de la energía ha empujado la inflación al alza, pero las expectativas y la inflación subyacente siguen ancladas y dentro del rango meta del banco central. El alto nivel de informalidad contribuye a que haya una gran desigualdad y una escasa productividad.
Para leer en más detalle sobre las proyecciones macroeconómicas, así como los principales desafíos estructurales ir al reporte en la versión español/portugués o inglés (que incluye proyecciones para países de la OECD, principales desafíos y un capítulo especial sobre la desvinculación de los salarios y la productividad y las implicancias en términos de políticas públicas).


 Spain continues to recover from the economic crisis with strong growth and falling unemployment, as highlighted in the latest