Growth is taking a dangerous downward turn

by Laurence Boone, OECD Chief Economist

For over 18 months, since the outbreak of trade hostilities, growth has been weakening, slowly but surely. In May 2018 the OECD, along with other organisations, was predicting global growth of around 4% for 2019, whereas our current forecasts are for growth of below 3%. In the first half of 2018, global investment was increasing at an annualised pace of nearly 5%, and trade over 4%. This year, the annualised growth rate of investment could slide to below 1%, with trade turning negative in the second quarter. Growth prospects have plummeted in the wake of trade and investment.

An urgent response is required, failing which we run the risk of finding ourselves stuck in a long period of low growth, the brunt of which will be felt primarily by the most vulnerable.

This is because the events of the last 18 months are not just a passing trend. The proliferation of tariffs and subsidies and the increasing unpredictability of trade policies have destroyed growth in international trade, triggering a sharp slowdown in industrial output and investments. When companies do not know what tomorrow will bring, they exercise their “wait-and-see option”. Given that an investment is a long-term commitment, they are waiting for this insidious trade war to settle down in order to know where to invest. However, when temporary uncertainty is recurrent and rooted, large amounts of investments are withheld, thereby affecting not just present day demand but also tomorrow’s growth potential and employment.

The investment gap created by this situation will have a long-term and structural impact on growth, all the more so as it will take time to clarify the new trade policy environment. This is clearly exemplified in the digital sector, given how the fastest investor always has a strong edge. But it is also the case for infrastructures, which are essential for business development. And at present, in addition to the digital sector, there is a global and structural need for infrastructure investment of nearly 7 trillion dollars per year, taking into account the energy transition in addition to traditional investment requirements. Paradoxically, the investment gap is growing at a time when governments can obtain long-term financing at very low, even negative, rates.

There is a therefore a danger of growth being bogged down for a long time. It is dangerous to use the good performance of the service sector as compared to the decline in industry as a justification for policy inaction given that the two are inextricably linked. It is equally risky to draw a distinction between countries with a large industrial sector and countries that are more service-based and therefore supposedly less at risk, given that integrated supply chains exist at both the regional and global level, and between services and industries.

The top priority is to remedy the drop in demand caused by the collapse in trade, which is affecting capital investments in particular. This can be achieved using a three-pronged economic policy, with a clear low rate policy, an infrastructure investment policy, and reforms to promote innovation. Monetary policy will struggle to halt the current downward spiral on its own, but it is detrimental to say that it has reached the limits of its capacity. Monetary policy may not be able to do everything, especially after years of providing support, but it still has a lot to offer. By providing long-term protection to the financing costs of both business and States, monetary policy creates the conditions required for private and public investment.

The euro area, for example, would already be in a much better position if it had turned to its budgetary tools, i.e. public investment, and carried out reforms to promote innovation much earlier! In our September Outlook, we demonstrate how annual public investments of around 0.5 percentage points of GDP in low-debt European countries, alongside reforms in favour of innovation in all the countries, would have allowed for a less aggressive monetary policy and encouraged short-term and long-term growth, without stretching public debt and while averting half of the increase in the price of financial assets over the past five years.

The second lever is to restore the confidence of businesses in their ability to find markets. It is now evident that trade tensions are not a temporary side-show. The international framework which governed trade has been permanently impaired, and the WTO as we know it will not come back.

Public recognition that global trade is experiencing a structural shift, that trade agreements going forward will no longer be global but perhaps more regional and more targeted, and that there is a commitment between like-minded countries to push ahead, would send a clear message to businesses to resume investment.

Growth is languishing, but there is a lot that public policy can do. This includes restoring confidence in the collective ability to establish trade rules which are clearer, more transparent, and afford more protection to citizens; and taking advantage of the predictable rates provided by monetary policies to boost investment, and with it growth and the jobs of tomorrow. It can be done. It urgently needs to be done.

More info: http://www.oecd.org/economy/outlook/


Statistical Insights: The ADIMA database on Multinational Enterprises

by Graham Pilgrim, OECD Statistics and Data Directorate

Multinational Enterprises (MNEs) have been at the forefront of changes in the global economy over the last few decades, as trade and investment barriers have been removed and transportation and communication costs have declined. In a world of global value chains, understanding MNEs – where they are, how they operate, and where they pay taxes – has never been more important. However, surprisingly few official statistics are currently available on individual MNEs.
To fill this gap the OECD has begun to develop a new database – the Analytical Database on Individual Multinationals and Affiliates (ADIMA) – using a number of open “big data” sources that can provide new insights on individual MNEs and their global profiles.

What is ADIMA?

ADIMA has four components:

Physical Register: Offering a comprehensive view of each MNE and its subsidiaries.

Digital Register: Showing all websites belonging to each MNE.

Indicators: Providing harmonised data at the global level for each MNE.

Monitor: Identifying events like large company restructurings that can give early warnings of potential significant impacts on trade, GDP and FDI data.

This information already covers 100 of the world’s largest MNEs, and more will be added in future releases.

What does ADIMA tell us on taxes?

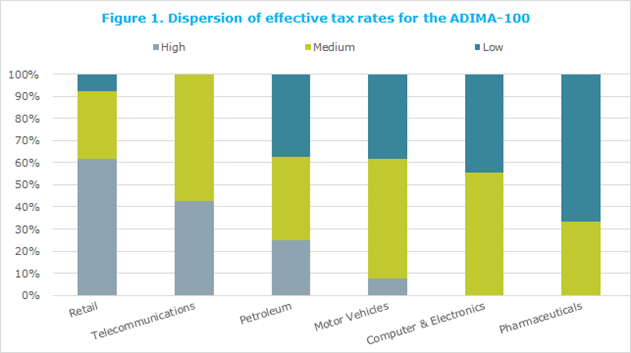
At an aggregate level, ADIMA shows that in 2016 the 100 MNEs covered in the the database (ADIMA-100) generated nearly $10 trillion in revenues (almost 20% of global GDP), earned $730 billion in profits and paid $185 billion in taxes. But you can also drill down and get more targeted information. For example, although the average Effective Tax Rate (ETR) of the ADIMA-100 was about 25%, it was significantly lower for MNEs producing computers and electronics, and pharmaceuticals, who have substantial intangible assets that they can locate in lower-tax economies (Figure 1).

Note: Low refers to ETR values less than 23%, Medium refers to ETR values between 23% and 33%, and High refers to ETR values greater than 33%. These values were chosen so that a third of the ADIMA-100 population was present in each classification.

Where are firms physically located?

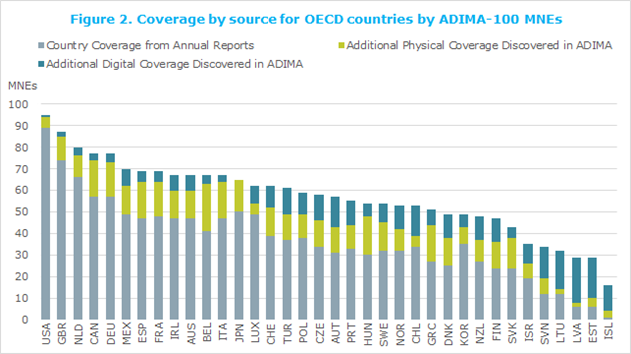
The physical register provided by ADIMA describes how MNEs structure their physical operations across countries. Here ADIMA’s innovative tools and variety of data sources go beyond the information typically available in company reports (Figure 2), enabling deeper analysis and a mechanism to help profile firms and their affiliates in national and international statistical business registers. For example, companies’ annual reports show that 74 of the ADIMA-100 have a physical presence in the United Kingdom, with an additional 11 MNEs identified using complementary sources (e.g. Legal Entity Identifier, Website Hyperlink Graphs, Server Security Certificates and WikiData), bringing the number of ADIMA-100 MNEs operating in the United Kingdom up to 85.

What about MNEs’ digital presence?

Physical presence may not reflect digital presence, that is, and in particular for firms whose only penetration into markets is through country-specific websites (i.e. no physical presence). This matters, especially for statistics on highly digitalised MNEs, as the provision of digitised services blurs the traditional line between companies with a foreign presence and those that trade across borders which may affect the comparability of international data on trade and national income.

Digital channels are comparable in scale to physical channels: the ADIMA Digital Register captures 20,000 websites while the ADIMA Physical Register captures 26,000 subsidiaries. In smaller countries the digital presence is often more important: for example, only 10 of the ADIMA-100 are physically present in Estonia but a further 19 mainly “digitalised” companies have an electronic presence (Figure 2).

Looking at another interesting example, annual Reports for Alphabet, Google’s parent company, show subsidiaries in two OECD countries but ADIMA’s physical and digital registers record subsidiaries and/or national websites in all OECD countries. For any given domain name, advertising revenue may be recorded as either a domestic or a cross-border transaction. The choice may depend on whether the country-specific site has been legally registered in that country.

Next Steps

The OECD plans to collaborate with interested official statistical agencies to improve both national statistics on MNEs and ADIMA data. The collaborations should also consolidate the tools developed in ADIMA, extend its coverage of MNEs, improve its methods and incorporate new data sources.

The measure explained

The OECD Analytical Database on Individual Multinationals and Affiliates (ADIMA) is a new data framework offering information on both the physical and digital presence of MNEs by country. It combines information from traditional sources such as companies’ Annual Reports with newly emerging sources such as the Legal Entity Identifier, Website Hyperlink Graphs, WikiData, OpenStreetMap and Server Security Certificates.

Where to find the underlying data?

Further reading


Housing-related policies matter for economic resilience

By Boris Cournède, Sahra Sakha and Volker Ziemann

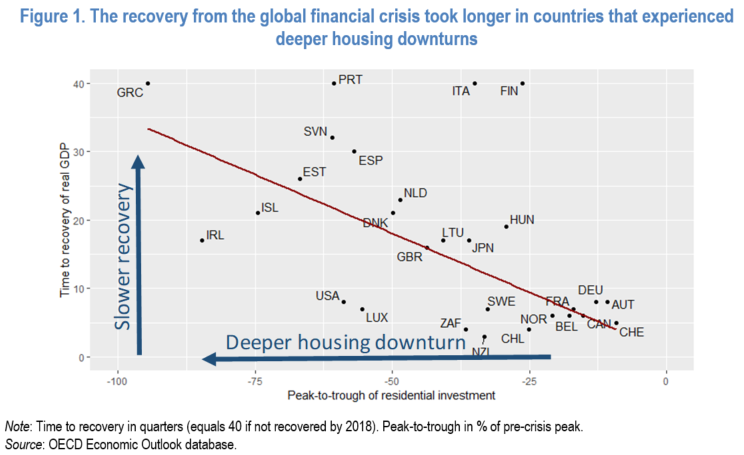
Policies that shape the housing market, such as rules concerning mortgage lending, homebuilding and rental regulation as well as taxation, can have a considerable impact on economic crisis risks and the capacity to recover from a crisis. The reason is that housing market developments strongly influence the business cycle and macroeconomic trends. Changes in house prices, rents and mortgage interest rates prompt variations in household wealth, income and expenditure that often have a sizeable impact on aggregate demand and inflation. Furthermore, house price fluctuations affect residential investment, which is a component of GDP. Countries with sharper declines in residential investment in the aftermath of the global financial crisis generally needed more time to recover from the crisis and regain the pre-crisis level of real GDP (Figure 1).

New OECD empirical studies have probed the transmission of housing-related shocks to the real economy and the role that policy plays in (a) mitigating or amplifying shocks and (b) facilitating or hampering a recovery. The aim is to identify which housing policy-related reforms can foster economic resilience. These studies used a range of econometric techniques, including quantile regressions, probit estimation and propensity-score matching.

The main findings are (Table 1):

  • Tighter loan-to-value (LTV) caps are associated with a reduced likelihood of severe downturns but also slower recoveries and lower growth. Overall, the evidence confirms earlier results that LTVs seem to entail a trade-off between growth and crisis risk.
  • More demanding capital requirements also appear to involve the same trade-off, as they are linked with a reduced incidence of downturns but lower median growth. Risk weights that penalise risky mortgages more are tentatively linked with stronger episodes of positive growth, which would be consistent with the hypothesis that they encourage a more efficient allocation of credit.
  • More stringent rental market regulations are associated with severe downturns that are more likely and more protracted, which may be related to bottlenecks in housing supply and lower labour mobility. On the other hand, tighter rental regulations, which aim to protect tenants against adverse economic shocks, appear to be associated with reduced extreme output losses (measured by GDP-at-risk).
  • Higher effective taxation of housing is associated with less severe downturns. Moreover, countries with higher taxation experience more moderate house price fluctuations and smoother residential construction cycles.

Taken together, these results mean that, in the management of macroeconomic risks from housing, policies that shape the housing market itself, such as its regulation and taxation, are at least as important as tools to manage the flow of credit. Well-functioning housing markets are therefore important not only to improve housing affordability but also to enhance macroeconomic resilience.

References:

Cournède, B., S. Sakha and V. Ziemann (2019), “Housing Markets and Economic Resilience”, OECD Economics Department Working Papers, OECD Publishing, Paris, https://doi.org/10.1787/aa029083-en.


Stronger productivity growth would put Malaysia on a path to become a high-income economy

By Hidekatsu Asada and Patrick Lenain, South-East Asia Desk, OECD Economics Department

Malaysia is enjoying remarkable economic growth. Real GDP
grew at an average rate of 6.1% per year over 1970 to 2018 period, and
short-term prospects are for growth to reach almost 5% in 2019-20, despite a
difficult international environment. Thanks to pragmatic policies, Malaysia has
transformed from an agricultural-based to an industrial- and services-based powerhouse
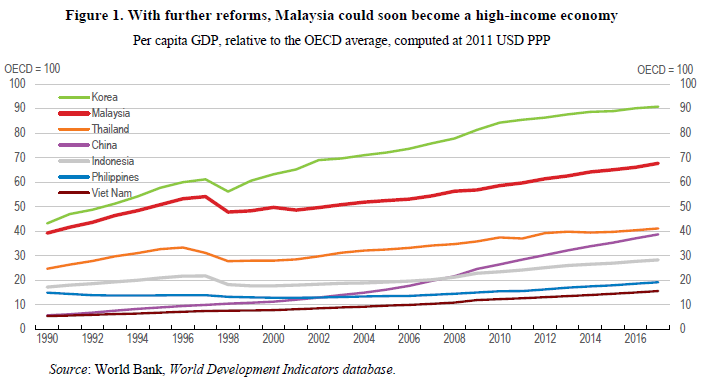
deeply integrated in global supply chains. Living standards are now close to
two-thirds of the average in OECD countries (Figure 1)
and per capita GDP exceeds levels in Mexico, Turkey and Chile.

The Mid-Term Review of the Eleventh Plan, announced in
October 2018, postponed the target year of achieving a high-income nation
status from 2020 to 2024 due to recent macroeconomic developments. To achieve
the planned target would require implementing an ambitious agenda of reforms
focused on productivity gains and skills development (OECD, 2019).

Since the
mid-1990s, Malaysia has embarked on a programme to promote innovation and transform the economy from an
input-driven to a knowledge-based one (EPU, 2015a). However, Malaysia’s
productivity levels remain weak and the economy is still highly dependent on,
and driven by factor inputs, especially non-ICT capital accumulation.

As a result,
Malaysia’s productivity level continues to lag behind most advanced countries.
For instance, based on purchasing power parity terms, Malaysia’s productivity
level in 2019 was about half that of the United States and Singapore (Figure 2). On the other hand, Malaysia’s
productivity level is ahead of its regional peers like Thailand, China,
Indonesia, India and Viet Nam. However, these countries experience higher productvity growth than Malaysia, implying a rapid catching
up of these countries. 

Human capital development is a key priority to boost Malaysia’s labour productivity. The importance of improving human capital has been highlighted in most development plans and industry-specific masterplans. Currently, Malaysia’s industries are excessively dependent on semi- and low-skilled workers and foreign low-skilled labour (MEA, 2018), as shown by the ratio of skilled workers to total employment, which is still low at 27.2% as compared to the target of 35% by 2020 set by the government (EPU, 2015b). As a result, the contribution of labour quality to economic growth remains low. On average, labour quality contributed only about 8% to real GDP growth over 2001-18, much lower than the OECD average. Skilled workers are crucial to facilitate innovation and technology adoption as well as to promote upgrading of activities to unlock potential economic growth. Therefore, efforts need to be intensified in producing high-quality talent pool to support the Malaysian government’s aspiration of becoming an advanced and inclusive country.

References

EPU. (2015a). The Eleventh Malaysia Plan Strategy Paper 1 : Unlocking the Potential of Productivity. Economic Planning Unit, Prime Minister’s Department, Purtajaya.
EPU. (2015b). The Eleventh Malaysia Plan, 2016-2020. Economic Planning Unit, Prime Minister’s Department, Putrajaya.
MEA. (2018). Mid-Term Review of the Eleventh Malaysia Plan. Ministry of Economic Affairs, Putrajaya.
OECD. (2019). 2019 OECD Economic Survey of Malaysia. Paris: OECD.

http://www.oecd.org/economy/malaysia-economic-snapshot/


Offering better labour-market opportunities to all Malaysian women: a win-win strategy

by Marieke Vandeweyer, OECD Directorate for Employment, Labour and Social Affairs

The Malaysian labour market is facing substantial skills
imbalances, including shortages in a range of occupations and skills. To tackle
these imbalances, the 2019 OECD Economic Survey of Malaysia features a special
focus on skills development and on how better labour-market opportunities could
be offered to all Malaysian women.

Malaysian women participate much less in the labour market
than men, in spite of similar levels of educational attainment. Only 55.2% of
working age women are active in the labour market, compared with 80.4% of men.
This gap is larger than in OECD countries, where the difference only equals 16
percentage points. In most OECD countries, the gap in participation rates
between men and women reaches its peak in the age group of 30 to 39 year olds,
after which it decreases for older age groups. In Malaysia, by contrast, the
gap significantly increases at the age of 30 to 34, and continues to grow for
older age groups. These numbers suggest that many women leave the labour market
in their early thirties, probably because of childcare responsibilities, and do
not return to work after that.

The Malaysian government has set the goal to increase female labour market participation to 56.5% by 2020. Initially, this target was set at 59%, but because of slow progress the target has been revised downward.

Barriers to labour market participation can be reduced by
promoting family-friendly policies, including:

  • employment-protected paid leave around
    childbirth and when children are young
  • subsidised childcare
  • and a statutory right to request flexible work.

The current right to maternity leave in the private sector
in Malaysia is below the 14 weeks minimum that is stipulated in the ILO
Maternity Protection Convention. Moreover, the full cost of the maternity
allowance in Malaysia is covered by employers, which could create a strong
disincentive for employers to hire women of childbearing age. Access to
reliable and affordable childcare facilities in Malaysia is limited, although
several financial incentives exist for parents and for employers to provide
on-site childcare facilities. Finally, access to flexible work arrangements is
limited, making it difficult for parents in Malaysia to combine work and family
responsibilities.

To help women return to work after a career break, they would benefit from targeted career guidance and training opportunities. The Malaysian Career Comeback Programme provides tax incentives and training to women returning to work, but also offers grants to employers for implementing or enhancing programmes or campaigns to recruit women returnees and for hiring and retaining women returnees. More efforts like these are needed to help women (re-) enter the labour market and ensure that their skills are put to good use.

http://www.oecd.org/economy/malaysia-economic-snapshot/


Are there ways to protect economies against potential future housing busts?

by Boris Cournède, Maria Chiara Cavalleri, Volker Ziemann, OECD

Housing, a large and volatile sector, is often at the centre of economic crises, as a trigger or amplifier. The current situation, which is characterised by house prices approaching or exceeding pre-crisis levels in many countries, raises questions as to whether these price levels may be indicative of a possible impending correction and what can be done to reduce housing-related macroeconomic risks.

Figure 1. House price developments since the global financial crisis

The OECD has been developing models that allow assessing to which extent economic trends associated with housing booms, such as steep house price increases or strong debt expansion, can fuel the risk of a severe economic downturn (Turner, Chalaux and Morgavi, 2018). About half of the countries covered by the models are estimated to face real yet limited risks (above 20% but below 30%) of experiencing a severe downturn over the medium term, with housing trends playing a significant role.” Model results suggest that housing booms can fuel crisis risk domestically but also across borders as a consequence of international financial links (Cavalleri, Cournède and Ziemann, 2019).

Countries can reduce housing-related risks in particular by:

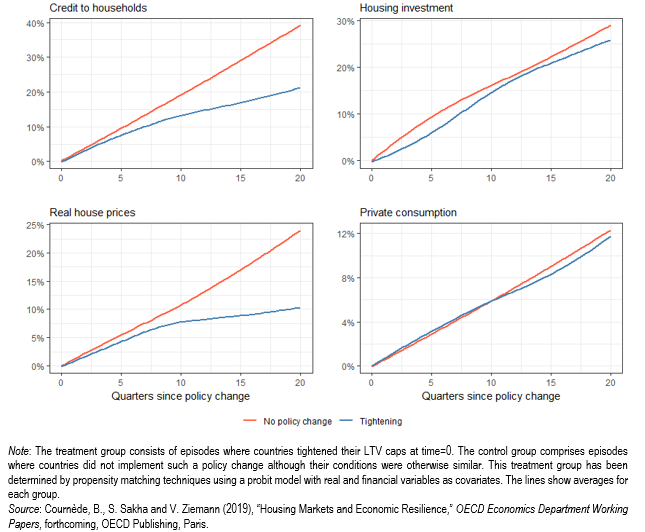
  • Capping the size of loans relative to house prices. New evidence suggests that such caps are capable of containing house prices and mortgage lending incurring limited economic cost (Figure 2): housing investment is only marginally reduced and there is very little effect on consumption. Tighter loan-to-value ratios are also linked with a lower risk of severe downturns.
  • Limiting the size of loans relative to income. This measure holds promising potential but has been seldom used so far, which means there is little scope yet to evaluate it ex post.
  • Tightening bank capital requirements for riskier housing loans. Measures of this nature are linked to more moderate output fluctuations and stronger recoveries after downturns.
  • Reducing the tax advantages given to housing assets. Higher effective taxation of housing assets (which can come from higher property taxes or lower income tax breaks for housing) favours smoother housing cycles.

Figure 2. Effect of tightening LTV caps

References:

Cavalleri, M. C., B. Cournède and V. Ziemann (2019), “Housing Markets and Macroeconomic Risks“, OECD Economics Department Working Papers, No. 1555, OECD Publishing, Paris.
Turner, D., T. Chalaux and H. Morgavi (2018), “Fan Charts around GDP Projections Based on Probit Models of Downturn Risk”, OECD Economics Department Working Papers, No. 1521, OECD Publishing, Paris.


The time for reform is now to respond to global challenges

by Laurence Boone, OECD Chief Economist

Globalisation, digitalisation, ageing and environmental degradation are the megatrends shaping tomorrow’s living standards and well-being. The prospects look weak in the absence of renewed reform dynamism. The global economy is facing further headwinds, with growth weakening in the wake of high trade uncertainty. At the same time, gains in living standards, as measured by GDP per capita, have been much slower since the Great Financial Crisis. All this should prompt policy makers to implement necessary reforms to deliver on stronger, more inclusive and environmentally-sustainable growth and help people make the most out of opportunities created in this new world.

This 2019 Going for Growth edition offers policy makers a set of country-specific reform priorities to prepare for the future and turn mega-trend challenges into opportunities, for all.

Governments are
increasingly addressing social challenges and reforms are paying off

Looking back at reform achievements over the past two years gives a contrasted picture. Although the overall pace of reforms has returned to the modest pre-crisis pace, a number of countries have managed to implement major reforms – reforms that respond directly to past Going for Growth priorities.

Significant examples include reforms to lift employment and make the labour market more inclusive. France improved collective wage bargaining and legal certainty for dismissals, reformed the rules for unemployment insurance and increased in-work benefits. Japan took steps to improve childcare provision and new laws on overtime work to improve work-life balance.

Regulatory simplification and tax policy have also been used to support firms’ investment and growth, but also provide governments with necessary resources for redistribution. The United States has cut corporate income tax rates and reformed business taxation – a long-standing Going for Growth priority. India implemented a landmark tax reform with the introduction of its Goods and Services Tax. Other countries, such as Greece, Poland and Spain took significant measures to improve tax collection. Several countries took measures to facilitate firm entry and level the playing field for businesses by reducing red tape, deregulating professional services and network sectors as well as by reinforcing competition authorities.

Governments have also intensified reform efforts to tackle social challenges. Greece and Italy rolled-out nationwide anti-poverty schemes. India finalised the connection of all its villages to electricity and launched a national health protection scheme targeting 100 million poor families. China made progress on bridging the rural-urban divide in its health care system by increasing the portability of health insurance.

These reforms are already improving the lives of millions. Yet,
there is more to do, and Going for Growth
reflects OECD’s expert judgement on where policy makers need to focus reform
actions to deliver sustainable and inclusive growth for future generations.

More needs to be done, especially on reforms that ensure stronger and fairer outcomes

The reform priorities to boost inclusive growth differ across countries. Education is the most common reform priority and is crucial to make sure current and future generations find employment, which would both boost productivity and give everyone the best chance for a fulfilling life. A significant number of recommendations in the area of education focus on improving the targeting of resources to disadvantaged students and schools, for example in many European and Latin American countries, as well as the United States. Upgrading school infrastructure is a recommendation in emerging-market economies such as India and South Africa.

Both growth and equal opportunities will also benefit from addressing labour market segmentation and improving the labour market inclusion of women, migrants, minorities and older workers – another set of top Going for Growth priorities, in particular in Europe, but also in the United States, Japan and several emerging-market economies..

Tax reform, with increasing reliance on property taxation, is a
pro-growth priority in many, particularly advanced economies. Better public
sector efficiency, rule of law and adequate, accessible infrastructure
provision are equally important to save resources, access markets and create
conditions for businesses to invest in innovation, in particular, but not only
in emerging-market economies.

Where countries have tended to lag behind is product market
reforms. Reforms are often difficult and granular in implementation, but opening
up markets to entry, competition and foreign trade and investment are essential
for innovation, the diffusion of digital technologies and ultimately
productivity growth and social inclusion.
Such reforms remain among the most frequent Going
for Growth
priorities.

Going for Growth guides policy makers where to focus their reform efforts for the well-being of their citizens and to achieve strong, sustainable, balanced and inclusive growth. However, some priorities require a co-ordinated effort by all countries. Examples include trade openness, intellectual property rights, taxation of multinational enterprises, migration, climate change, oceans and waste. As such, they are a useful reminder of the benefits of multilateral co-operation.

Growth has to be
environmentally sustainable

Responding to the urgency of climate change and to the Paris agreement, this edition of Going for Growth includes an environment sustainability angle for the first time. Around the world, environmental pressures are mounting, posing a threat to the sustainability of gains in growth and well-being. Tackling air pollution, climate change and other key environmental problems have to be part of a sustainable growth strategy. As a result, most countries, including key global polluters, have reform priorities and recommendations that address both growth and environmental bottlenecks.

The time for reform is now, for better lives today and for future generations!


>


Fortalecer las instituciones para mejorar la prosperidad de los mexicanos

Por Sonia Araujo y Lisa Meehan, sección para México, Departamiento de Economía de la OCDE

¿Por
qué algunos países son más ricos que otros? Es cada vez más reconocida la importancia
de las instituciones fuertes y eficaces para el éxito económico de las naciones
(ver, por ejemplo, Acemoglu y Robinson, 2012). Las instituciones proporcionan
un marco que da forma a los incentivos económicos, lo que influye en las
decisiones en una multitud de áreas, tales como educarse, iniciar un negocio,
invertir, etc. El éxito de las reformas políticas en todas las áreas depende,
por lo tanto, de la capacidad de las instituciones para crear los incentivos
adecuados. Las instituciones de calidad también crean certidumbre y un campo de
juego nivelado en el que las personas pueden construir, brindando así más
equidad y mayor acceso a las oportunidades. En general, las instituciones de
calidad son de importancia fundamental para los resultados económicos.

Por lo tanto, es preocupante que numerosos indicadores sugieran que la calidad institucional es baja y está disminuyendo en México (Figura 1). Por ejemplo, sintomático de instituciones débiles, la corrupción percibida es la más alta en la OCDE y no ha mejorado con el tiempo. También son preocupantes los niveles ya altos de crimen y violencia y que han todavía aumentado. México tiene la tasa de homicidios más alta en la OCDE, y el número de asesinatos ha aumentado considerablemente en la última década (OCDE, 2019; Figura 2). La impunidad también es alta, con más del 90% de los delitos no denunciados y solo una pequeña fracción de los casos denunciados llegan al sistema judicial (Le Clercq y Rodríguez Sánchez Lara, 2016).

La
corrupción es un serio obstáculo para la prosperidad de todos los mexicanos y
su abordaje ocupa un lugar destacado en la agenda del nuevo gobierno. La
corrupción es una fuga de los recursos fiscales, socava la capacidad de prestar
servicios públicos y también tiene un efecto adverso en la estabilidad
política, el entorno empresarial, la inversión privada y el crecimiento
inclusivo. El Estudio Económico de México 2019 de la OCDE destaca que mejorar
la calidad institucional tendría los mayores beneficios en términos de
crecimiento económico entre todas las reformas estructurales y también
facilitaría la implementación efectiva de todas las demás reformas de
políticas. Para combatir la corrupción y mejorar la transparencia, en 2016 se
promulgó el ambicioso Sistema Nacional Anticorrupción (SNA) de México (OCDE,
2019). Además de establecer un sistema federal anticorrupción, requiere que los
estados creen sistemas locales anticorrupción. Sin embargo, la implementación
está retrasada. Por ejemplo, se suponía que los sistemas locales anticorrupción
debían estar implementados a mediados de 2017, y aunque se han logrado
importantes avances, no todos los estados han completado este proceso. La
administración actual se compromete a acelerar la implementación del (SNA) y ha
tomado medidas inmediatas. Por ejemplo, ahora se están llenando puestos clave,
en particular, el primer Fiscal Especial Anticorrupción fue nombrado
recientemente.

Las
experiencias de otros países resaltan que es un gran desafío abordar con éxito
la corrupción de una maniera sistemática e integral. Hacia adelante, será
importante monitorear y evaluar los resultados de SNA, y abordar las
debilidades identificadas, especialmente a nivel regional, para evitar
exacerbar las disparidades geográficas ya marcadas, y tomar medidas adicionales
si es necesario.

México
también ha emprendido otras reformas en los últimos años para llevar la calidad
de las instituciones y la supervisión económica hacia las mejores prácticas
internacionales. Esto incluyó la creación de nuevos reguladores sectoriales
independientes que se crearon como parte de las reformas energéticas de 2013 y
dos nuevas autoridades de competencia autónomas y tribunales de competencia
especializados establecidos en 2014. Asegurar la independencia y los recursos
adecuados de estas entidades autónomas serán cruciales para el fortalecimiento
continuo de la competencia en México.

Referencias:

Acemoglu, D. and J.A.
Robinson. (2012). Why nations fail: The origins of power, prosperity,
and poverty
. New York: Crown Publishers.

Le Clercq, J. and G. Rodríguez Sánchez Lara (2016), Global
Impunity Index Mexico IGI-MEX 2016, Center of Studies on Impunity and Justice
(CESIJ), http://www.udlap.mx/cesij.

OECD (2019), OECD Economic Surveys: Mexico 2019, OECD Publishing, Paris. https://doi.org/10.1787/a536d00e-en


Strengthening institutions to improve the prosperity of all Mexicans

By Sonia Araujo and
Lisa Meehan, Mexico Desk, OECD Economics Department

Why are some countries wealthier than others? There is
increasing recognition that the economic success of nations depends on well-functioning
institutions (see, for example, Acemoglu and Robinson, 2012). Institutions
provide a framework that shape economic incentives, thus influencing decisions
in a multitude of areas, such as whether to become educated, start a business,
invest and so forth. The success of policy reforms in all areas therefore
hinges on the ability of institutions to create the right incentives. Quality
institutions also create certainty and a level playing field on which people
can build, thus bringing more fairness and greater access to opportunities. Overall,
quality institutions are of fundamental importance to economic outcomes.

It is therefore concerning that numerous indicators suggest that institutional quality is low and declining in Mexico (Figure). For example, symptomatic of weak institutions, perceived corruption is the highest in the OECD and has not improved over time. Also worringly, the already high levels of crime and violence have been increasing. Mexico has the highest homicide rate in the OECD, and the number of murders has risen sharply in the past decade (OECD, 2019; Figure). Impunity is also high, with over 90% of crimes going unreported, and just a small fraction of reported cases making it to the court system (Le Clercq and Rodríguez Sánchez Lara, 2016).

Corruption is a serious drag on the prosperity of all Mexicans and tackling it features high in the new government’s agenda. Corruption is a drain on fiscal resources, undermines the ability to deliver public services and also has an adverse effect on political stability, the business environment, private investment and inclusive growth . The OECD Economic Survey of Mexico 2019 highlights that improving institutional quality would have the largest growth benefits among all structural reforms and would also facilitate the effective implement of all other policy reforms

To fight corruption and improve transparency, Mexico’s
ambitious National Anticorruption System (NACS) was enacted in 2016 (OECD,
2019).  As well as establishing a federal
anticorruption system, it requires states to create local anticorruption
systems. However, implementation is behind schedule. For example, local
anticorruption systems were supposed to be in place by mid-2017, and while
important progress has been made, not all states have fully completed this
process. The current administration is committed to accelerating the
implementation of the NACS and has taken immediate actions. For example, key
positions are now being filled – in particular, the first Special
Anticorruption Prosecutor was recently appointed.

The experiences of other countries highlight that it is very
challenging to successfully tackle corruption in a wholesale manner. Going
forward, it will be important to monitor and evaluate the outcomes of NACS, and
address identified weaknesses, especially at a regional level, in order to
avoid exacerbating already stark geographic disparities, and take further
action if necessary.

Mexico has also undertaken other reforms in recent years to move the quality of institutions and economic oversight towards international best practice. This included the creation new independent sector regulators were created as part of the 2013 energy reforms and two new autonomous competition authorities and specialist competition courts were established in 2014. Ensuring the independence and adequate resourcing of these autonomous entities will be crucial to the continued strengthening of competition in Mexico.

References:

Acemoglu, D. and J.A.
Robinson. (2012). Why nations fail: The origins of power, prosperity,
and poverty
. New York: Crown Publishers.

Le Clercq, J. and G. Rodríguez Sánchez Lara (2016), Global
Impunity Index Mexico IGI-MEX 2016, Center of Studies on Impunity and Justice
(CESIJ), http://www.udlap.mx/cesij.

OECD (2019), OECD Economic
Surveys: Mexico 2019
, OECD Publishing, Paris. https://doi.org/10.1787/a536d00e-en


Le temps de travail en France : comment expliquer sa faiblesse relative ?

par Antoine Goujard, Bureau France, Département économique de l’OCDE

Le temps de travail en France : comment expliquer sa faiblesse relative ?

Les débats sur le temps de travail font rage et
les statistiques diffèrent d’une étude à l’autre.
Ce blog clarifie les statistiques sur le temps de
travail sous trois angles : le nombre d’heures travaillées, bien sûr, mais
également l’emploi, et la durée du travail sur la vie active, ou dit autrement
combien de temps passent les Français au travail et à la retraite. Le résultat
est frappant : les Français qui travaillent le font autant que dans les
autres pays de l’OCDE, mais les Français sont moins souvent employés et
travaillent aussi moins longtemps sur la durée de leur vie, ce qui nuit à la
fois à leur pouvoir d’achat et à leur retraites. On peut argumenter qu’il
s’agit d’un choix de société, mais étant donné les coûts de ce choix, notamment
en finançant les retraites plus longues plutôt que d’autres priorités
collectives, il est essentiel de clarifier ces données, les coûts et les
implications de ces choix.

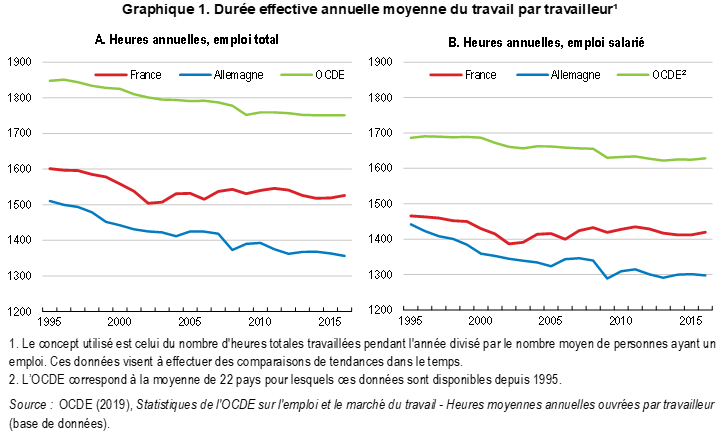
Les Français, qu’ils soient salariés ou non salariés, travaillent en moyenne moins chaque année que dans la moyenne des pays de l’OCDE, avec 1526 heures travaillées pour 1751 dans la moyenne des pays de l’OCDE en 2016. Cet écart a été relativement stable sur les 20 dernières années (Figure 1). Issues de la comptabilité nationale, ces données sur les heures travaillées représentent le nombre total d’heures effectivement travaillées par an divisées par le nombre de personnes en emploi (salariés et/ou travailleurs indépendants) par an. Les heures effectives comprennent les heures de travail à plein temps, temps partiel et pour les personnes ayant un travail irrégulier, les heures supplémentaires payées ou non, les heures dues à un travail additionnel, et excluent le temps effectivement non travaillé pour jours fériés, et les congés pour raisons diverses et heures chômées pour des raisons techniques ou économiques, grèves et autres mouvements sociaux, compensation chômage ou autres raisons.

Ce sont surtout ces jours non-travaillés qui expliquent la différence en heures annuelles de la France par rapport aux autres pays de l’OCDE. Les heures travaillées dans une semaine habituelle sont en France en ligne avec la moyenne de l’OCDE. Les travailleurs français, salariés ou indépendants, effectuent 37,2 heures par semaine habituelle (i.e. excluant les congés et autres absences) pour 37,3 en moyenne dans l’OCDE (Figure 2, Panneau A). Certes, les salariés à temps plein travaillent moins en France que dans la moyenne des pays de l’OCDE lors d’une semaine habituelle, à 38,9 heures hebdomadaires pour 40,1 dans l’OCDE (Panneau B). Cependant, le nombre de travailleurs à temps partiel ou irréguliers est inférieur à la moyenne des pays de l’OCDE (Panneau C) et le temps de travail sur une semaine habituelle des salariés à temps partiel est plus important en France que dans la moyenne des pays de l’OCDE (Panneau D).

Outre, le temps de travail des actifs occupés, il est
essentiel de considérer les périodes de chômage et d’inactivité.
L’emploi est nettement plus faible en
France que dans les autres pays de l’OCDE : le taux d’emploi total (le
ratio du nombre de personnes employées par la population de 15 à 64 ans) s’élèvait à 65,6% au quatrième trimestre 2018, inférieur de trois points à
la moyenne OCDE. L’emploi est tiré à la baisse par le faible emploi des jeunes
et des personnes agées de plus de 55 ans (Figure 3, panneau A). Alors que 80,8%
des personnes entre 25 et 54 ans travaillent en France pour 78,6% dans
l’ensemble de l’OCDE, seuls 30,5% des 15-24 ans sont en emploi pour 42% dans
l’OCDE. Pour les 55-64 ans c’est seulement 52,6% des Français qui sont en
emploi, pour 61,7% en moyenne dans le reste de l’OCDE. Les statistiques sont
similaires pour le taux de participation au marché du travail, ce qui suggère
un problème d’employabilité plutôt que de découragement, en lien avec les
compétences relativement faibles d’une part importante de la population (OCDE,
2019).

La France a du mal à intégrer les jeunes dans l’emploi, notamment les moins qualifiés, et presqu’autant à maintenir dans l’emploi les plus de 54 ans. Pour les plus jeunes, la faiblesse des taux d’emploi s’explique principalement par des difficultés ciblées d’intégration au marché du travail. Le taux de scolarisation des 20-29 ans (20,4 %) est inférieur à la moyenne de l’OCDE (28,6 %) et les taux d’emploi en sortie d’étude sont beaucoup plus faibles que dans la moyenne des pays Européens pour les moins qualifiés (Boone et Goujard, 2019). Pour les plus de 54 ans, la durée du travail est faible alors que l’espérance de vie, notamment en bonne santé, est élevée, d’où la question du financement des retraites. On travaille moins longtemps sur le cycle de vie en France qu’ailleurs dans l’OCDE : l’âge effectif de sortie du marché du travail est le second plus bas de tous les pays de l’OCDE pour les hommes et le septième plus bas pour les femmes (Figure 3, panneau B). L’âge effectif de sortie du marché du travail prend en compte tous ceux qui sortent de la population active au-delà de 40 ans, y compris pour des raisons d’inactivité ou d’invalidité.

En raison des faiblesses du marché du travail, un taux
d’emploi moins élevé chez les jeunes et les plus de 54 ans, des difficultés d’intégration
au marché du travail des moins qualifiés, et de cet âge de retrait du marché du
travail faible, la durée de cotisation
au système de retraite est actuellement plus faible qu’ailleurs en Europe

(la durée de cotisation nécessaire pour recevoir une retraite à taux plein est cependant
appelée à augmenter progressivement de 41 ans et 2 trimestres en 2019 pour
atteindre 43 ans en 2035 pour les générations nées en ou après 1973). En 2017,
les Français partant en retraites ont en moyenne travaillé 34,5 années avant la
retraite contre 35,6 dans l’Union Européenne (à 27) (Commission Européenne,
2018), alors même que l’espérance de vie et l’espérance de vie en bonne santé
sont élevées. La durée de de vie passée
à la retraite est ainsi parmi les plus élevées de l’OCDE, à 25 ans soit 5 ans
de plus que la moyenne de l’OCDE
.

En
conclusion, la faiblesse relative du temps de travail  en France provient
à la fois de choix de société et d’un mauvais fonctionnement du marché du
travail.
Les congés élevés, l’âge d’ouverture des droits et les
autres paramètres du système de retraite rentrent dans la première catégorie.
La question est de savoir si ces choix sont finançables et s’ils ne se font pas
au détriment d’autres objectifs. Il s’agit donc avant tout de choix politiques.
L’autre source de la faiblesse relative du temps de travail tient aux
insuffisances du marché du travail, comme les difficultés d’insertion des
jeunes et moins jeunes et les discriminations à l’emploi, le temps partiel
subi, sans compter la persistance d’un chômage élevé.

Augmenter le temps de travail en France nécessite donc une stratégie globale. En premier lieu, il est urgent d’agir pour l’emploi des jeunes, seniors et moins qualifiés , c’est-à-dire faciliter l’accès à la formation professionnelle et améliorer la qualité de celle-ci, ainsi que développer davantage l’apprentissage et l’accompagnement, en lien avec les réformes en cours. Réduire les recours excessifs aux contrats courts permettrait aussi de favoriser le développement des CDI et de limiter la récurrence de certains épisodes de chômage. En second lieu, même si l’âge de départ à la retraite est un choix de société, les coûts d’un départ précoce tant pour les individus (retraites plus basses) que pour la société (renoncement à d’autres projets collectifs) peuvent être très élevés. Revoir les pénalités et primes de retraite en fonction de l’âge de départ permettrait que ces coûts soient mieux intégrés dans les choix individuels. Aligner les paramètres des différents systèmes de retraites améliorerait aussi significativement la lisibilité du système et la mobilité de la main-d’œuvre, en ligne avec la réforme engagée.

Bibliographie

Boone, L. and A.
Goujard (2019), La France, les inégalités et l’ascenseur social. https://oecdecoscope.blog/2019/02/25/la-france-les-inegalites-et-lascenseur-social/.

Commission Européenne (2018), “The 2018 Ageing Report –
Economic & Budgetary Projections for the 28 EU Member States (2016-2070)”, Institutional Paper, No 79, https://ec.europa.eu/info/sites/info/files/economy-finance/ip079_en.pdf

OCDE (2014),
Vieillissement et politiques de l’emploi : France 2014 – Mieux travailler avec
l’âge, Éditions OCDE, Paris. https://doi.org/10.1787/9789264206847-fr.

OCDE (2019), Études économiques de l’OCDE : France 2019, Éditions OCDE, Paris. https://doi.org/10.1787/10f0135f-fr