Lithuania: Ensuring the rising tide lifts all boats

by Vassiliki Koutsogeorgopoulou, Lithuania Desk, OECD Economics Department

As a result of Lithuania’s strong economic growth performance since the mid-1990s, incomes are catching up fast towards the average of OECD countries. But relative poverty is high, especially among the unemployed, less educated, single parents, people with disabilities and the elderly. High poverty not only fuels social exclusion but it also dents the productive potential of those affected. The Covid-19 crisis adds to these challenges, not least through a sharp increase in unemployment since the onset of the pandemic. Tackling poverty calls for a comprehensive strategy that provides sufficient social support and better labour market opportunities for the vulnerable.
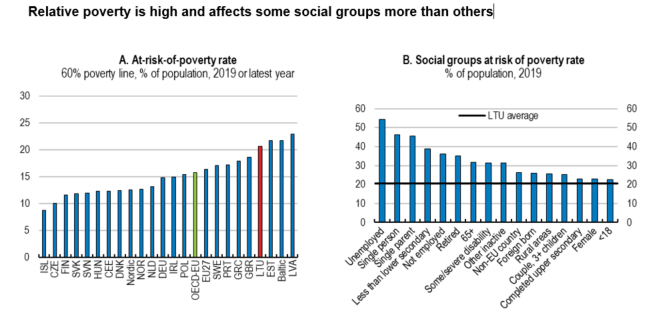
The at-risk-of-poverty rate is the share of persons with an equivalised disposable income below the at-risk-of-poverty threshold, set at 60% of the national median equivalised disposable income (after social transfers) (Eurostat definition). Averages are calculated for the most recent value of all countries with available data (unweighted). Average groups are as follows: EU27: European Union members; OECD-EU: EU countries who are OECD members; Baltic: Estonia, Latvia, and Lithuania; Nordic: Denmark, Finland, Iceland, Norway, and Sweden; CEE (Central European Economies): Czech Republic, Hungary, Poland, Slovak Republic, and Slovenia.
Source: OECD Income Distribution database; Statistics Lithuania; and EU-SILC.

The tax-transfer system could do more to reduce poverty. Social benefits remain low, despite recent increases, and the provision of support is not yet individual-based. Increasing social support that is well-tailored to the needs of the most vulnerable, while keeping work incentives, is essential. The pension system also needs to safeguard more against old-age poverty by ensuring adequate pension levels. More than a third of seniors have incomes below 60% of the national median. The additional spending can be financed through efforts to utilise under-exploited tax bases, including by tackling tax evasion.

Social services also need to improve. Not all children have access to early childhood education and care, despite its critical role in reducing the impact of social disadvantage. A case can therefore be made to maintain efforts to expand early education services, with a special focus on children from disadvantaged backgrounds and those living in rural areas. Another challenge is to meet the housing needs of the poorer segments of the population. Around 10 000 low-income households are still awaiting social housing, calling for increased investment in this area. Lithuania also needs an integrated approach to homelessness, guided by international best practices.

Fighting poverty in a decisive manner ultimately requires more and better quality jobs. There is scope, in this context, to improve the job opportunities for less-skilled workers through a further reduction in the labour tax wedge, which remains above the OECD average. Equally important are measures to boost the productivity of less-skilled workers, including through well-designed incentives to enhance participation in adult learning programmes, helping re-skilling and upskilling. At the same time, informality needs to be reduce to ensure high-quality jobs. The New Labour Code makes strides in this regard.

Increased spending on activation programmes, upon a close monitoring of outcomes, is essential to better integrate displaced workers in the labour market and to reduce poverty. Ensuring successful labour market and social integration of the vulnerable groups requires close collaboration of all stakeholders, with some encouraging initiatives already underway.

As the economy recovers from the Covid-19 crisis, the Lithuanian authorities will have the opportunity to make headways in all these areas through continued reforms so that all boats can be lifted as the tide rises anew.

References:

OECD (2020), OECD Economic Surveys: Lithuania 2020, OECD Publishing, Paris.
https://doi.org/10.1787/62663b1d-en.


Explaining cross-country differences in growth performance in the second quarter of 2020

By Nigel Pain and Łukasz Rawdanowicz, OECD Economics Department

In the second quarter of 2020, as the pandemic spread and many countries implemented strict containment measures, output and consumer spending declined sharply in most economies. However, the extent of the contraction differed significantly across countries, with GDP and private consumption falling by over 15% in some countries, and by 5% or less in others. This blog, based on the latest OECD Economic Outlook, highlights the strong cross-country association between activity, the strictness of containment measures and changes in mobility, complementing the detailed analysis of the relationship between mobility and containment policy measures in OECD (2020).

Containment measures are captured using the aggregate stringency index produced by the Oxford Blavatnik School of Government (Hale et al., 2020), and mobility by the Google location-based indicator of retail and recreational mobility, a measure of visits to places such as shopping centres, restaurants, theme parks, museums and cinemas. Changes in containment measures are associated with changes in mobility, but mobility measures may also pick up other factors, such as voluntary physical distancing, or a reluctance to leave the home when concerns about the pandemic are high. Both mobility and the stringency of containment measures are strongly correlated across countries with GDP growth and private consumption growth in the second quarter of 2020 (see figure).

Note: The panels show OECD countries and selected non-OECD advanced and emerging-market economies from Asia, Latin America and Africa for which data are available (China is excluded, as mobility data are not available). The country coverage differs between the two panels. The vertical axes show changes in the quarterly averages of the Oxford stringency index and the Google mobility index for the retail and recreation sector.
Source: OECD Economic Outlook 108 database; Google LLC, Google COVID-19 Community Mobility Reports, https://www.google.com/covid19/mobility; Oxford Coronavirus government response tracker; and OECD calculations.

Empirical investigation

The relative importance of mobility and the stringency of containment measures can also be assessed by estimating cross‑country equations for quarterly changes in real GDP and private consumption in the second quarter of 2020. Two separate equations are estimated, one for GDP growth and the other for private consumption growth, to assess whether there are differences in the extent to which mobility and stringency affect different activity indicators. For instance, cross-country variation in GDP growth stems in part from factors that may be less directly affected by domestic containment measures, such as government consumption and exports. Both explanatory variables are expressed as the change in quarterly average values.

The equations are estimated for a group of advanced and emerging-market economies for which data are available, and exclude large outliers, leaving a sample of 43 economies for private consumption and 49 for GDP. Excluding the outliers sharpens the results without changing the estimated coefficients substantially. The sample for private consumption is smaller given fewer emerging-market economies with quarterly data for private consumption. In both equations, the two indicators are strongly statistically significant. This finding is robust to exclusion of the country outliers.

  • Both mobility and stringency are found to have been significantly associated with cross-country differences in growth outcomes in the second quarter of 2020.
  • An increase (tightening) of the Oxford stringency index by 10 points is estimated to be associated with a reduction of around 1 percentage point in quarterly GDP growth, for a given level of mobility. A decline of 10 points in the Google community mobility indicator is estimated to be associated with a reduction of around 1.7 percentage points in quarterly GDP growth, for a given level of stringency. For real private consumption growth, the respective numbers are 0.6 and 2.8 percentage points. The larger impact of the mobility indicator on consumption growth than on GDP growth may reflect the fact that retail and recreational mobility is more relevant for household consumption than for other economic activities.
  • The estimated equations account for roughly 60% of the cross-country variation in GDP growth and around 75% of the cross-country variation in private consumption growth.
  • For both GDP and private consumption equations, the residuals tend to be on average positive in Asia, where containment measures have been relatively mild in some countries, but negative in Europe, where more-restrictive measures were applied. This may point to some potential non-linearities in the aggregate relationships between growth, mobility and containment measures, or it may indicate that some particular types of containment measures, such as full shutdowns, have stronger effects than others.

It is too early to know whether the cross-sectional relationships found for the second quarter of 2020 can be used to help track output growth throughout the pandemic. However, initial estimates for GDP growth in the third quarter of 2020 are correlated with quarter-on-quarter changes in mobility across countries. The estimated relationships for the second quarter of 2020 also provide a guide for potential developments in the fourth quarter of 2020, suggesting that growth may again turn negative in countries that are tightening confinement measures substantially and experiencing marked declines in mobility indicators. However, the relation may be slightly weaker as some potentially hard-hit sectors have not reopened, or their activity remains subdued after the first round of containment measures. There may also have been a growing shift to on-line sales of goods and services, which might reduce the strength of the association between mobility and private consumption growth.

References

OECD (2020), “Walking the tightrope: avoiding a lockdown while containing the virus”, OECD Policy Responses to Coronavirus (COVID-19), OECD Publishing, Paris.

Hale, T., et al. (2020), “Oxford COVID-19 Government Response Tracker”, Blavatnik School of Government, Oxford University.


Difficult decisions in difficult times – Improving public spending in Brazil

By Jens Arnold and Robert Grundke, OECD Economics Department

Portuguese version: Escolhas difíceis em tempos difíceis – Melhorando os gastos públicos no Brasil

Brazil’s government designed one of the strongest COVID-19 fiscal support packages in Latin America. Poor households who were already part of the government’s transfer programmes received extra cash. Formal workers could benefit from short-time work schemes in which the government paid part of their salaries so that their employers would keep their jobs alive. In addition, an entirely new emergency benefit was created for informal workers, which account for 40% of the workforce. On the whole, government policies supported the incomes of more than 67 million people, spending more than 8% of GDP. 

Now Brazil’s economy has started to recover and is expected to grow by 2.6% next year, provided that recent increases in infections do not require new containment measures. But the bill that the state has to foot as a legacy of COVID-19 will make public finances even more complicated than they were before the crisis. Public debt has increased from 76% to 91% of GDP and is projected to exceed 100% of GDP in a few years time. This will make it difficult to continue all the emergency benefits beyond the end of December, when they are currently meant to end. At the same time, there are still 9% of workers who lost their employment with the pandemic and have not been able to find a job since. Many people are still in need, more than 9 months after COVID-19 hit Brazil.

So how can the fiscal dilemma be solved? Brazil’s tax burden is already as high as in advanced economies. Moreover, Brazil’s tax system is itself in need of reform, as it does little to reduce inequality and its complicated rules weigh on productivity. But a closer look at Brazil’s public expenditure reveals a number of ideas about where to start. Current subsidies, tax exemptions, special tax regimes and other tax expenditures cost almost 5% of GDP in lost revenues (Figure 1). This is a similar amount to what Brazil spends on education. Not all of that lacks a purpose, but many of these tax expenditures make tax treatment less equal and benefit special interests, not those most in need. Although some reductions have been achieved in recent years, touching these expenditures is often politically challenging, but all the more important now in the wake of COVID-19. The legislative branch will have to collaborate in efforts to make public spending more effective, as more than 95% of the budget is outside the control of the government, bound by automatic spending rules that require congressional approval to modify.

The 2020 OECD Economic Survey of Brazil discusses these issues in more detail, analysing how changes to current policies could improve the situation of those most in need through better social protection, improve education and vocational training so that more Brazilians can reap new opportunities, and strengthen competition to raise productivity and incomes. Tackling these issues now is more important than ever.

Further reading:
OECD (2020), OECD Economic Surveys: Brazil 2020, OECD Publishing, Paris,
https://doi.org/10.1787/250240ad-en.


Escolhas difíceis em tempos difíceis – Melhorando os gastos públicos no Brasil

Por Jens Arnold e Robert Grundke, Departamento de Economia da OCDE

English version: Difficult decisions in difficult times – Improving public spending in Brazil

O governo brasileiro elaborou um dos pacotes de apoio fiscal mais fortes da América Latina. As famílias pobres que já faziam parte dos programas de transferência do governo receberam dinheiro extra. Os trabalhadores formais puderam se beneficiar de regimes de um regime de trabalho em horário reduzido em que o governo pagava parte de seus salários para que seus empregadores mantivessem seus empregos vivos. Além disso, um benefício de emergência inteiramente novo foi criado para os trabalhadores informais, que representam cerca de 40% dos trabalhadores no Brasil. No total, as políticas governamentais sustentaram a renda de mais de 67 milhões de pessoas, gastando mais de 8% do PIB. 

Agora a economia do Brasil começou a se recuperar e deve crescer 2,6% no próximo ano, desde que os aumentos recentes nas infecções não exijam novas medidas de contenção. Mas a conta que o estado terá de pagar como legado da COVID-19 complicará ainda mais as finanças públicas do que antes da crise. A dívida pública aumentou de 76% para 91% do PIB e prevê-se que ultrapasse 100% do PIB dentro de alguns anos. A luz disso, dar continuidade a todos os benefícios de emergência após o final de dezembro, quando eles deveriam terminar, será difícil. Ao mesmo tempo, ainda há 9% dos trabalhadores que perderam seu emprego com a pandemia e não conseguiram encontrar emprego desde então. Muitas pessoas ainda precisam de ajuda, mais de 9 meses após o COVID-19 chegar ao Brasil.

Então, como o dilema fiscal pode ser resolvido? A carga tributária já é tão alta quanto nas economias avançadas. Além disso, o próprio sistema tributário do Brasil precisa de reforma, pois faz pouco para reduzir a desigualdade e suas regras complicadas pesam sobre a produtividade. Mas um olhar mais atento sobre os gastos públicos do Brasil revela uma série de ideias sobre por onde começar. Os atuais subsídios, desonerações fiscais, regimes fiscais especiais e outras despesas fiscais custam quase 5% do PIB em receitas perdidas (Figura 1). Esse é um valor semelhante ao que o Brasil gasta com educação. Nem tudo isso carece de um propósito, mas muitas dessas despesas fiscais reduzem a igualdade de tratamento e beneficiam interesses especiais, não aquelas pessoas que mais precisam de ajuda. Embora algumas reduções tenham sido alcançadas nos últimos anos, tocar nessas despesas é muitas vezes politicamente desafiador, mas ainda mais importante agora na esteira do COVID-19. O Legislativo terá de colaborar nos esforços para tornar o gasto público mais eficaz, já que mais de 95% do orçamento está fora do controle do governo, vinculado a regras automáticas de gastos que requerem aprovação do Congresso para serem modificadas.

O Relatório Econômico do Brasil da OCDE 2020 examina essas questões com mais detalhe, analisando como mudanças nas políticas atuais poderiam melhorar a situação dos mais necessitados por meio de melhor proteção social, reforzar a educação e a formação profissional para que mais brasileiros possam colher novas oportunidades e fortalecer a concorrência para aumentar a produtividade e a renda. Lidar com essas questões agora é mais importante do que nunca.


The impact of the COVID-19 pandemic on sectoral output

by Nigel Pain, OECD Economics Department

The economic impact of the pandemic has varied significantly across different industries. Monthly economy-wide output data and the special business surveys being undertaken in some countries provide a timely indication of the different impact of the pandemic across types of activity, both in the early stages of the crisis and subsequently. As shown in the December OECD Economic Outlook, the containment measures used in response to the pandemic and underlying changes in consumer behaviour have both had a significant impact on activity, particularly in many service sectors.

In the first wave of the pandemic, output fell especially sharply in countries such as the United Kingdom and France, where full economy-wide confinement was required for an extended period (see first figure). By April, retail and wholesale trade volumes in these countries were over one-third lower than in February, prior to the pandemic. Retail output also declined by over one-quarter in Canada. In contrast, many other countries, particularly in Asia and Northern Europe, made greater use of targeted measures on regions and sectors and relied more extensively on effective test, trace and isolate systems to control the virus.

Service sectors requiring close proximity between consumers and producers or between large groups of consumers, including hospitality services, leisure activities and cross-border travel, were hard hit across all economies, with output declining by 60-80% in several countries by April. Output in many other parts of the economy, including manufacturing and most other market-based services also tumbled, although the extent of the decline was more varied, reflecting the mix of containment measures being imposed and differences in specialisation. Declines in these sectors were also typically larger in Canada, France and the United Kingdom than in Japan or Norway.

In the subsequent recovery output gradually picked up in all sectors, with many containment measures relaxed until recently, although economy-wide activity and manfacturing output still remained below pre-pandemic levels as of September (see first figure). The rebound was particularly marked in wholesale and retail trade, where output returned quickly to the immediate pre‑pandemic level, helped by a rebound in consumer spending.

A weaker recovery occurred in the service sectors most affected initially, pointing to the risk of persistent costs from the pandemic in these sectors. Activity in hospitality, leisure, and transportation, particularly air travel services, continues to be impacted by physical distancing requirements and border closures, with output in September remaining 20-25% below that in February in some countries. The recovery has also been slow in administrative and support services, a category of output that includes travel agencies, where demand is extremely weak.

The special business surveys being undertaken by some national statistics offices and central banks provide additional insight into the effects of the pandemic across sectors, including on workforce arrangements, the extent to which government support schemes are being used, investment plans, and corporate finances. Even prior to the tighter containment measures implemented in the past two months in most European economies, survey information was already highlighting the pressures that firms in the hardest hit sectors were facing.

In Belgium, around one-fifth of responding firms indicated that they could not meet their financial liabilities for more than three months without receiving additional equity or credit (see second figure, Panel A). An additional sizeable share of firms indicated that financial liabilities could only be met for between three and six months. Such financial pressures were most evident in the arts and recreation (leisure) sector, and the accommodation and food services (hospitality) sector, with around 40% and 30% of firms respectively indicating that financial liabilities could not be met for more than three months.

In the United Kingdom, around one-fifth of responding firms reported that their operating costs were currently exceeding turnover, with the excess being over 50% in half of these cases (see second figure, Panel B). A further one-fifth indicated that operating costs were equal to turnover. Financial fragilities again appeared to be strongest in the hardest hit service sectors.

These findings highlight the message in the December OECD Economic Outlook that flexible and state-contingent government support remains necessary to help sustain viable firms and lower the risks of significant long-lasting costs from the pandemic.

Further reading:

OECD (2020), OECD Economic Outlook, Volume 2020 Issue 2: Preliminary version, OECD Publishing, Paris, https://doi.org/10.1787/39a88ab1-en.


Finland: Recovering from the COVID-19 crisis

By David Carey, Economics Department.

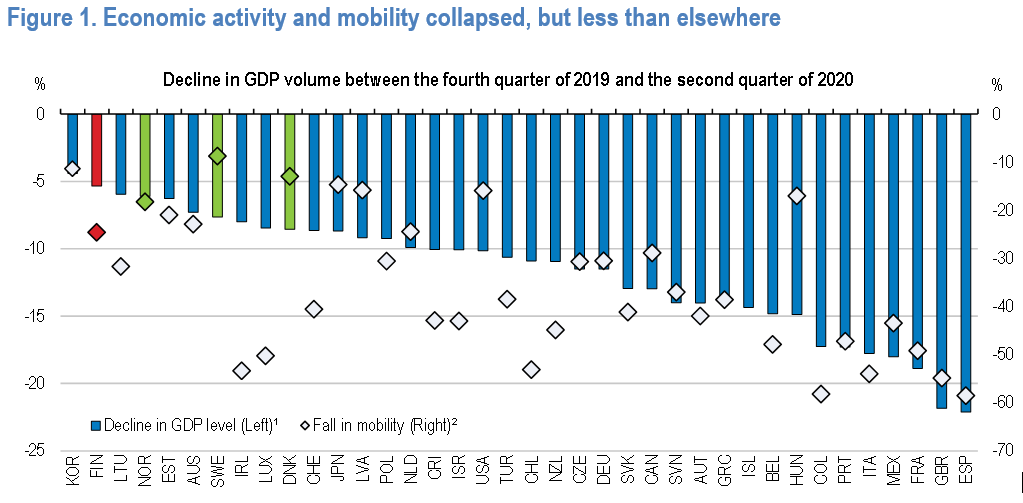
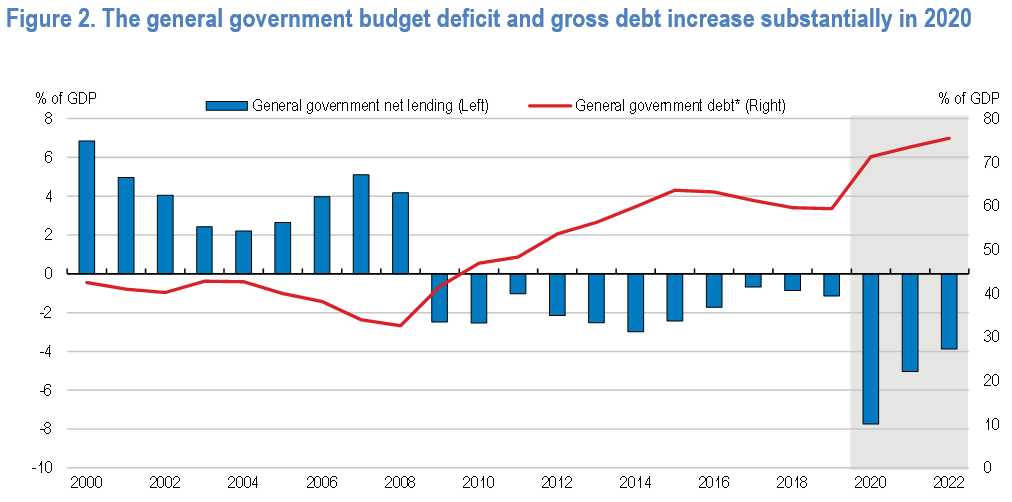
The COVID-19 pandemic has plunged Finland into a deep recession, albeit milder than in most other countries partly thanks to more targeted confinement measures and a relatively small loss of mobility (Figure 1). The economy is projected to shrink by 3.3% in 2020 and recover gradually with growth of 2.1% in 2021 and 1.8% in 2022, led by private consumption and exports. The government provided substantial financial support to protect jobs and help households and businesses get through the crisis. Public finances deteriorated as a result (Figure 2).Once the recovery is underway, fiscal consolidation will be needed to achieve the government’s aim to stabilise the debt-to-GDP ratio by the end of the decade. To this end, the government has set an objective of increasing employment by 80 000 at that horizon. Increasing the employment rate toward the average level of the Scandinavian Nordic countries could make a substantial contribution to the necessary fiscal consolidation and, together with stronger productivity growth, help to reverse the long-term erosion in relative living standards. The 2020 OECD Economic Survey of Finland provides an in-depth analysis of these challenges and offers policy recommendations for meeting them.

Note: 1. % difference between 2019Q4 and 2020Q2 GDP levels.  2. Fall in mobility from the baseline between 1st of March and 27th of June.
Source: OECD, National Accounts database; Google LLC, Google COVID-19 Community Mobility Reports, https://www.google.com/covid19/mobility/.

The greatest potential for increasing employment lies in extending working lives. The employment rate for older workers (aged 55-64 years) is 13 percentage points lower than the average for other Nordic countries, where access to early retirement arrangements is much more limited. The extension of the unemployment benefit from age 61 until 65, combined with a longer entitlement to the unemployment benefit for persons aged 58 or more, results in a spike in layoffs from the late-50s. To increase the employment rate of older workers, extended unemployment benefit should be phased out and non-medical criteria for awarding disability benefits to applicants aged 60 or more no longer taken into account.  

Labour productivity growth weakened substantially in the past decade. A factor that undermines productivity growth in Finland is skills shortages, largely resulting from relatively low tertiary education attainment. This makes it difficult for more productive firms to hire the qualified workers needed to innovate and expand market shares. To boost the supply of tertiary educated workers, the government plans to streamline the resident permit process to attract more high-skilled immigrants. It also aims to increase the tertiary attainment of 25-34 year olds from 42% to 50%. To this end, the number of study places in the highly selective tertiary education admission system is being raised but further increases will be needed.

Reducing relatively high regulatory barriers to competition in upstream service sectors, such as transport, energy and retail, which hold back incumbents’ efforts to reallocate resources more efficiently, would also boost productivity growth. Similarly, repealing the legal restriction that prevents some employers from using the enterprise-bargaining flexibility clauses in their sector collective agreement, as planned, would give these employers greater scope to reorganise their businesses to make them more productive.

Finland is on track to meet its 2020 EU-burden-sharing objective for reducing GHG emissions but will need to implement further cost-effective measures, including making full use of available flexibility mechanisms, to realise its 2030 and 2035 objectives. To reduce transport emissions, which is vital for achieving abatement targets, the government should support the rollout of electric vehicle (EV) charging facilities to lift EV diffusion substantially. There will also need to be an expansion in wind power generation both to meet increased demand for charging EVs and to enable the substitution of electricity for fossil fuels in residential and commercial heating and in industry. 

Note: General government debt refers to Maastricht definition.
Source: Statistics Finland; Ministry of Finance.

Further reading:

OECD (2020), OECD Economic Surveys: Finland 2020, OECD Publishing, Paris, https://doi.org/10.1787/673aeb7f-en.


The increase in bank deposits during the COVID-19 crisis: Possible drivers and implications

By Ane Kathrine Christensen, Alessandro Maravalle and Łukasz Rawdanowicz, OECD Economics Department

Since the end of 2019, bank deposits of non-financial corporations (NFCs) have increased rapidly in Japan, the United States and many European countries, far above the average growth rates over the same period in the past five years (figure below, Panel A). In contrast, in the global financial crisis, corporate deposits declined amid the credit crunch and, in some cases, a delayed policy response. Deposits of households have also increased but to a smaller extent; though still, in many countries, at a faster rate than in the previous years or at the beginning of the global financial crisis (figure below, Panel B). This blog, based on the recently released OECD Economic Outlook, reviews possible reasons for, and the implications of, the increase in bank deposits.

Possible explanations behind the unprecedented increase in bank deposits

Several factors could explain the observed surge in deposits:

  • Containment measures made some household purchases impossible (Boxes 1.1 and 1.2 in OECD, 2020) at a time when incomes were maintained by government support, thus increasing saving and bank deposits. This effect should be temporary and dissipate as containment measures are lifted gradually and pent-up demand is satisfied. Indeed, so far, growth in deposits was concentrated in the March May period, when strict lockdown was in force in many countries. In the following months, until the recent reintroduction of containment measures, the rate of growth in deposits of both households and NFCs slowed in most countries, though it remained above the average rate over the same period in the past five years.
  • Containment measures are likely to have particularly affected consumption of some high ticket services by high-income households, stimulating aggregate saving. High-income households tend to spend a higher share of their income on services that are heavily affected by containment measures, such as international travel, restaurants and cultural events. As the restrictions are likely to persist for some time, so does this motive for saving.
  • High uncertainty about the pandemic and future economic prospects has strengthened motives for precautionary saving, discouraging investment and purchases of durable goods. For example, Mody et al. (2012) show that the change in the unemployment rate – a proxy for variation in economic uncertainty – boosts precautionary savings. These effects are likely to be more persistent.
  • Amid disruptions to revenues, NFCs’ preferences for holding cash have increased with the aim of raising their buffers and avoiding liquidity shortfalls. Cash hoarding has been facilitated by drawing on loan facilities (e.g. revolving credit lines), issuance of corporate bonds by large firms (Goel and Serena, 2020), and by government sponsored loan programmes. In November, the size of the resources made available to businesses through government-sponsored loan programmes (loans and guarantees) was above 10% of 2019 GDP in Canada, France, Germany, Italy, Japan, Spain and the United Kingdom. NFCs could have also reduced riskier financial investments (e.g. in money market funds).
  • Crisis-related tax deferral measures have helped households and NFCs to increase liquidity but may also have encouraged them to set aside money to meet postponed tax obligations. Tax deferrals are officially estimated to be high in some countries, exceeding, for example, 13% of GDP in Italy (including the effect of the moratorium on payments to private companies) and close to 5% of GDP in Japan.

Possible implications

A reversal in any of the above factors may result in additional investment and consumption, boosting aggregate demand and accelerating the economic recovery. Back of the envelope calculations show that “excess” deposits are large relative to pre-crisis business investment, potentially indicating a sizeable future impact on investment (figure below, Panel C). For households, “excess” deposits are relatively small relative to private consumption (figure below, Panel C), but both household deposits and consumption are much larger relative to GDP (figure below, Panels E and F), potentially implying a bigger aggregate impact.

However, there are several reasons why these excess savings may not boost aggregate private demand beyond negative confidence effects. For example, the distribution of deposits may be skewed. If the increase in NFCs’ deposits has been driven by a few large firms that benefitted from the crisis, particularly in the technology sector, excess deposits are unlikely to stimulate future economy-wide investment. Similarly, if the increase in household deposits has been mostly driven by high income households with a relative low marginal propensity to consume, then a reduction in uncertainty and containment measures would not necessarily lead to a broad-based strengthening of consumption. Moreover, firms could use excess deposits to settle payments due to other companies, creditors or tax authorities.

References

Goel, T. and J.M. Serena (2020), “Bonds and syndicated loans during the Covid-19 crisis: Decoupled again?”, BIS Bulletin, No. 29. https://www.bis.org/publ/bisbull29.pdf
Mody, A., F. Ohnsorge and D. Sandri (2012), “Precautionary Savings in the Great Recession”, IMF Working Papers, No. 42, International Monetary Fund. https://www.imf.org/external/pubs/ft/wp/2012/wp1242.pdf
OECD (2020), “General Assessment of the Macroeconomic Situation”, Chapter 1 of OECD Economic Outlook, Volume 2020, Issue 2, OECD Publishing, Paris.


Unblocking the bottlenecks: infrastructure investment to foster the recovery in Germany

By Ze’ev Krill and Andrew Barker, Germany Desk, OECD Economics Department

The German economy faces a difficult winter as the second wave of the COVID-19 pandemic restricts activity. With vaccines offering a glimmer of hope on the horizon, policy decisions now will be important for the pace and sustainability of the recovery.

Germany managed the initial stages of the COVID-19 crisis well, as high health sector capacity and early testing, tracing and isolation of cases helped bring the initial virus outbreak under control with less stringent containment measures than in many neighbouring countries. A strong government response protected jobs and firms, using fiscal space from prudent budgeting before the crisis. Nevertheless, the German economy is experiencing a severe contraction. In 2020, GDP will decline by 5½ per cent. A rapid recovery during the summer shows the potential of the economy to rebound, but the rebound has come to a halt with the second wave of the virus.

The newly launched 2020 OECD Economic Survey of Germany argues that to aid recovery, fiscal support should be withdrawn only gradually, labour market inclusion promoted and barriers to infrastructure investment reduced while improving infrastructure governance. Greater investment would accelerate the transition to greener energy and transport, the expansion of early childhood education and all-day schooling, as well as the improvement of communication networks needed to accelerate digital transformation.

Weak public investment is not a new challenge. Public investment as a share of GDP in Germany has been among the weakest in OECD countries (Figure 1) since the mid-1990s. While public investment has picked up since 2014, municipal investment remains insufficient to cover depreciation. Net municipal capital stock has declined by some EUR 80 billion since 2003 (Figure 2), contributing to a backlog estimated at EUR 147 billion, concentrated in transport and schools.

Nevertheless, the next couple of years may look different. The recent pickup in public investment is set to continue, owing to the recovery package and the increase in funding for public transport infrastructure. The main challenge is to make sure the new fiscal capacity is dedicated to well-directed public investment, including increased transfers to municipalities, while resolving local planning and construction industry capacity constraints. The COVID-19 crisis may create spare capacity in some parts of the economy, but a reduction in migrant flows could exacerbate shortages of construction workers. Germany should investigate opportunities to increase flexibility through reducing the stringency of occupational licensing and facilitating use of foreign labour in key construction occupations. Capacity constraints also exist in local planning agencies. Resolution requires active support from central government, clear allocation of responsibility for technical assistance and long-term commitment of all levels of government. Among EU municipalities reporting under-provision of infrastructure, Germany has the highest proportion citing technical capacity as a major obstacle. Cooperation between local governments, as is the case in New Zealand and Switzerland, would help pool capacity, develop specialisation, increase consistency and efficiency, and share learning.

Further reading:

OECD (2020), OECD Economic Surveys: Germany 2020, OECD Publishing, Paris,
https://www.oecd-ilibrary.org/economics/oecd-economic-surveys-germany-2020_91973c69-en


América Latina: impulsando una recuperación inclusiva

Por Jens Arnold, Paula Garda, Alberto González Pandiella, Alvaro S. Pereira, Departamento de Economía, OCDE

Por primera vez desde que comenzó la pandemia, comienza a haber esperanza de que una cura a la COVID-19 esté a la vista. Tras un fuerte descenso del 4% este año, se prevé que el PIB mundial aumente algo más del 4% en 2021, y otro 3¾% en 2022. Pero la recuperación será desigual entre países, con aquellos que cuenten con sistemas eficaces de testeo, rastreo y aislamiento mostrando mejor desempeño, aunque se verán frenados por la debilidad general de la demanda mundial.  Mucho dependerá de la distribución masiva de una vacuna o tratamiento eficaz, cuyo calendario aún no se conoce. 

América Latina está siendo una de las regiones más golpeadas por la pandemia Covid-19. No sólo por los números de contagios y muertes, que contabilizan un tercio de las muertes en el mundo, sino también porque los números rojos que arrojan las economías son de los más preocupantes, con las consecuencias negativas en los ámbitos sociales que acarrean. En medio de altas tasas de contagio y muertes, los frágiles sistemas de salud, la alta informalidad, los complejos escenarios fiscales, la disminución de los precios de las materias primas, la fuerte caída en los ingresos del turismo, y el débil crecimiento de la productividad pre-pandemia, se suman a los desafíos económicos que experimentan otros países de la OCDE.

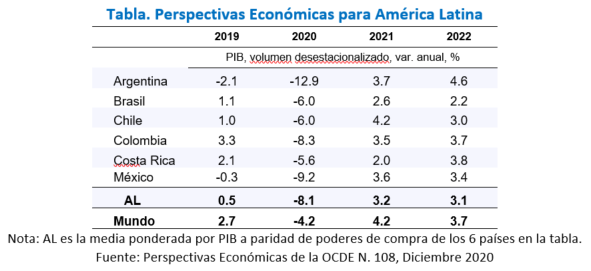
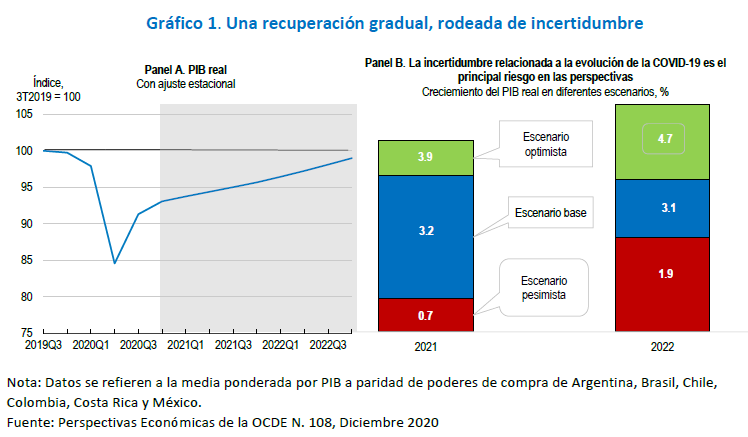
Una recuperación gradual está en marcha, luego de una recesión sin precedentes: se prevé que el crecimiento de seis grandes economías de la región, que abarcan alrededor del 85% del PIB de América Latina, se reduzca 8.1% en 2020 (Tabla). La actividad económica ha comenzado a recuperarse mientras que las medidas de contención en la mayoría de los países se han levantado, pero la recuperación en los próximos años será gradual, casi recuperando los niveles pre-pandemia a finales de 2022 (Gráfico 1, panel A).

Sigue habiendo una inusual incertidumbre en torno a las perspectivas que dependen de la evolución de la pandemia (Gráfico 1, Panel B). En el escenario positivo, la confianza de los consumidores y de las empresas podría mejorar más rápido que en el escenario base si hubiera indicios de que un tratamiento o una vacuna eficaces pudieran desplegarse ampliamente más rápido. En el escenario negativo, la incertidumbre podría agudizarse si se intensificaran los brotes de COVID-19, o si se requirieran medidas de contención más estrictas para controlar su propagación. La confianza podría verse negativamente afectada si la distribución de la vacuna o los efectos secundarios fueran decepcionantes. La prioridad inmediata en la región debe ser evitar posibles brotes de la COVID-19, fortaleciendo los sistemas de salud, y los sistemas de testeo, rastreo y aislamiento, así como asegurar un despliegue rápido de la vacuna cuando esté disponible.

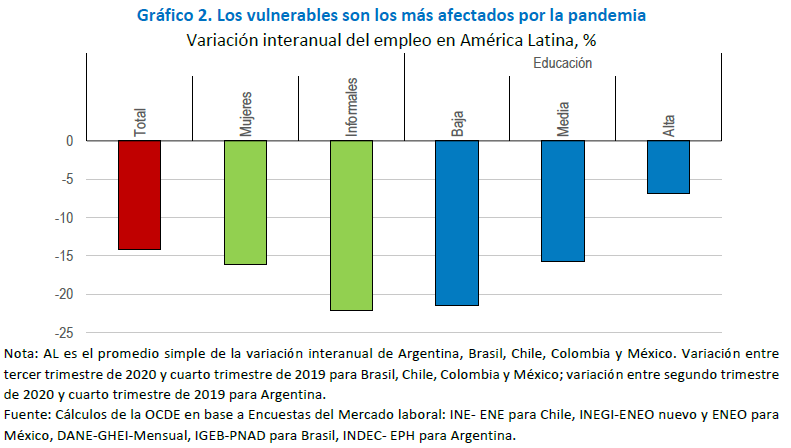
Pero para tener una recuperación vigorosa e inclusiva, América Latina tiene que evitar que esta pandemia deje cicatrices de largo plazo en el mercado de trabajo, y en consecuencia en la pobreza y las desigualdades. Las pérdidas de empleo han alcanzado niveles históricos, afectando sobre todo a los más vulnerables: las mujeres, los trabajadores informales y los de menor calificación (Gráfica 2). Y aunque una incipiente recuperación está en marcha, el empleo de estos grupos vulnerables sigue rezagado. En parte, esto se debe a que los trabajadores menos calificados e informales estaban ocupados en los sectores más afectados por las medidas de contención, y donde la incipiente recuperación es aún débil e incierta. Y el empleo femenino está contenido al menos en parte debido al cierre de las escuelas, que aún no se han completamente abierto en la región.  

Las ayudas que varios gobiernos de la región han implementado a través de programas de trasferencias monetarias, mayor acceso a las cesantías y/o subsidios al empleo son fundamentales para mitigar la crisis. Y aunque es necesario mantenerlos hasta que la recuperación esté afianzada, es hora de repensar y fortalecer los mecanismos de protección social de forma permanente (como lo hemos hablado aquí). Pero si no se logra reactivar el mercado laboral formal, particularmente en sectores intensivos en mano de obra de baja calificación, las ayudas , que son en principio de carácter temporal, van a tener que mantenerse por periodos prolongados. La situación fiscal está ya muy comprometida en la región (como ya lo discutimos aquí) y está situación se agravará por los efectos de la crisis y el consecuente aumento del endeudamiento público, una de las principales vulnerabilidades en la región.  

Se ha vuelto urgente la necesidad de emprender reformas estructurales que permitan una rápida recuperación del mercado laboral, evitando el incremento de la informalidad, la pobreza y las desigualdades. Las políticas de reactivación del mercado laboral, como son los subsidios a la contratación, que han puesto en marcha Chile o Colombia, son un buen primer paso, y necesitan tener un claro foco en los más vulnerables. Dar mayor foco a la protección a los trabajadores, en lugar de a la protección de los trabajos, ayudaría a crear mercados de trabajo más inclusivos y menos segmentados. Adicionalmente, se deben eliminar barreras a la formalización empresarial, sobre todo en las pequeñas y medianas empresas, por ejemplo, a través de la racionalización de los procesos regulatorios, y la creación de mecanismos de ventanilla única. Líneas de crédito específicas para empresas pequeñas, como las que varios países han puesto en marcha desde marzo, también podrían apoyar a empresas que quieran formalizarse, mejorando así los incentivos. Revisar los elevados costos laborales y no laborales, y los sistemas tributarios complejos también incentivarían la formalización. Y no menos importantes son las políticas activas de empleo y sistemas de capacitación de calidad en competencias relevantes que den a todos los trabajadores, en especial a los más vulnerables, la oportunidad de encontrar trabajos de calidad que pueden emerger en el mundo post-COVID.  

Los países deben comenzar el proceso de discusión e identificación de las reformas y planificar la implementación. Algunas de estas reformas deberán esperar a que la recuperación esté afianzada y la pandemia se desvanezca. Pero en todos los casos, el mejor momento para avanzar es ahora. Una agenda de reformas que revitalice el crecimiento contribuiría también de manera clave a la sostenibilidad fiscal.

Para leer en más detalle sobre las proyecciones macroeconómicas, así como los principales desafíos estructurales ir al reporte en la o la versión español y portugués o versión inglés (que incluye proyecciones para todos los países de la OECD y principales desafíos).

Información detallada para estos 6 países con sus notas país correspondientes:

http://www.oecd.org/economy/panorama-economico-argentina/

http://www.oecd.org/economy/panorama-economico-chile/

http://www.oecd.org/economy/panorama-economico-colombia/

http://www.oecd.org/economy/panorama-economico-costa-rica/

http://www.oecd.org/economy/panorama-economico-mexico/

http://www.oecd.org/economy/panorama-economico-espana/


Asia & Pacific economies are projected to rebound from COVID-19

by Patrick Lenain and Kosuke Suzuki, OECD Economics Department

While the world is struggling to exit from the coronavirus crisis, the region Asia & Pacific is a notorious exception: many countries in the region have stopped the COVID-19 pandemic after the first wave, and they quickly returned on a path of growth in the second half of 2020 – a rare accomplishment. The OECD projects that the region’s recovery will continue in 2021 and 2022 (Table 1).

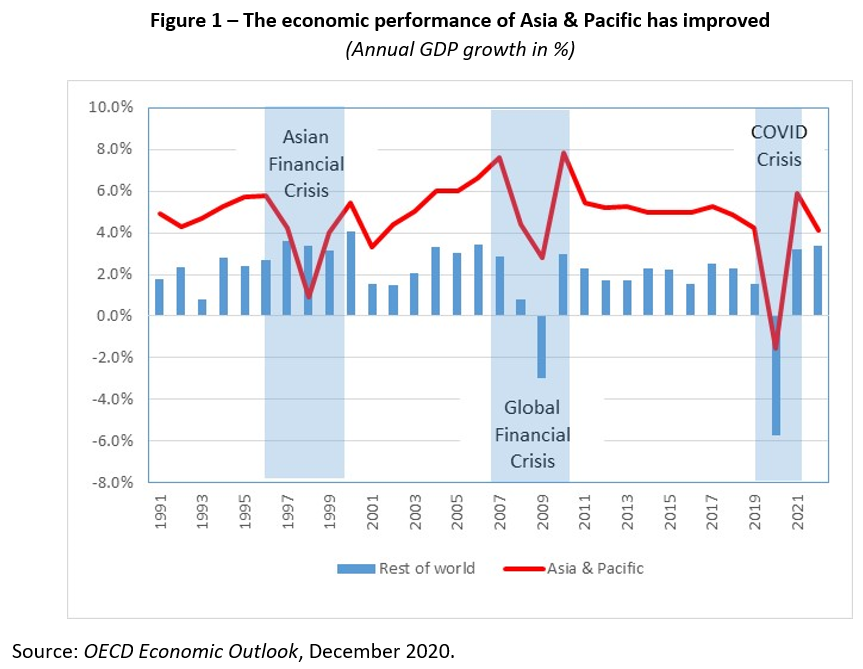
The region’s current resilience is in sharp contrast with the late 1990s, when the Asian Financial Crisis hit it very hard (Figure 1). Governments in the region drew lessons from this experience and were better prepared when the Global Financial Crisis arrived. They were also ready when the coronavirus struck: fiscal space was available, monetary policies were sound, exchange rates were flexible, foreign exchange reserves abundant, bank well capitalised, external indebtedness was low – and health systems had been re-organised.

Strong resilience in the face of crises contributes to long-term growth, especially in poor and emerging countries, as shown by a literature launched by Easterly et al. (1993). Thanks in large part to their growing resilience, the 15 countries and territories of Asia & Pacific doubled their share in world GDP from 19% in the early 1990s to 34% currently. The region has become an economic powerhouse and most likely will gain further ground. The Regional Comprehensive Economic Partnership (RCEP) recently signed will provide another boost to long-term growth, as discussed in the recent OECD Economic Survey of Thailand.

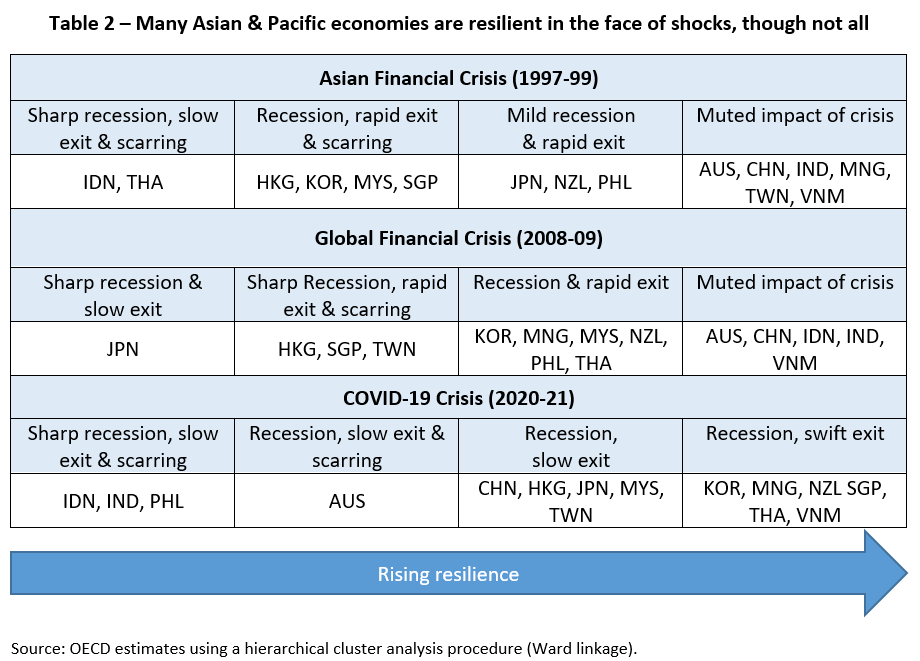
Of course, not all countries of the region have the same resilience. To throw light on this disparity, we use a hierarchical cluster analysis (Ward linkage), a statistical procedure that identifies homogenous groups of observations without making a difference between dependant and independent variables. We identify four groups of countries with common factors for each of the three crises. To group the region’s economies, we use the following indicators: 1) the depth of recession, 2) the speed of recovery, and 3) the post-recession scarring of growth. The first two indicators provide a contemporary measure of resilience when faced with a shock, while the third indicator is an ex-post measure of resilience. For the current crisis, we use the number of COVID-19 deaths as a proxy of ex-post resilience, in line with empirical findings that the spread of the coronavirus has damaged economic activity due a combination of government-imposed lockdowns and self-imposed lockdowns (Golsbee and Syverson, 2020).

Our cluster analysis reveals some diversity within the region. The resilience of individual economies has changed rapidly – in both directions (Table 2). Some key findings are:

  • Australia has shown great resilience during the first two crises, but fell into a recession with the coronavirus.
  • While China and India were resilient in the face of the first two crises, they have lost some ground with the COVID-19 pandemic, especially India.
  • Korea and Thailand have seen their resilience improve after each crisis.
  • Vietnam has consistently been the most resilient economy in the region.

Despite this diversity, the region displays overall a strong resilience and is placed to recover rapidly from the COVID-19 crisis, assuming that the pandemic is brought under control and that the large population can be vaccinated soon. If this happens, Asia & Pacific will confirm its new position as a global powerhouse. The return to economic growth should be an opportunity to address socioeconomic problems inherent in several countries, notably high informality and inequality, and make headways on a path of decarbonisation.

References:

Easterly, W., M. Kremer, L. Pritchett, and L. H. Summers (1993), “Good Policy or Good Luck? Country Growth Performance and Temporary Shocks,” Journal of Monetary Economics, 32, pp. 459–483.

Goolsbee A. and C. Syverson (2020), “Fear, Lockdown, and Diversion: Comparing Drivers of Pandemic Economic Decline 2020”, NBER Working Paper No. 27432, June.

OECD (2020), OECD Economic Surveys: Thailand 2020: Economic Assessment, OECD Publishing, Paris, https://doi.org/10.1787/ad2e50fa-en.

OECD (2020), OECD Economic Outlook, Volume 2020 Issue 2: Preliminary version, OECD Publishing, Paris, https://doi.org/10.1787/39a88ab1-en.