Creando espacio fiscal y fomentando el crecimiento en América Latina

Jens Arnold, Aida Caldera, Paula Garda, Alberto González Pandiella, Michael Koelle, Alessandro Maravalle, Claudia Ramirez Bulos, Adolfo Rodriguez-Vargas and Elena Vidal, Departamento de Economía, OCDE

El crecimiento económico en América Latina está desacelerándose a medida que las políticas monetarias más restrictivas para combatir la inflación surten efecto y las condiciones externas se tornan menos favorables, de acuerdo con las Perspectivas Económicas de la OCDE recientemente lanzadas. El crecimiento del PIB en 2023 presenta divergencias significativas entre las principales economías. El crecimiento se ha mantenido sólido en Brasil y México, que ha mostrado ser resiliente a la inflación y a tasas de interés elevadas impulsado respectivamente por una cosecha abundante y la fortaleza del consumo privado. Sin embargo, el crecimiento ha sido débil en Argentina, Chile, Colombia y Perú debido a eventos climáticos extremos, a una elevada incertidumbre política y la debilidad de la economía mundial. La inflación sigue en descenso en todos los países, salvo en Argentina, gracias a las rápidas subidas de tipos de interés. La caída de la inflación ha sido más rápida que en otras regiones. De hecho, Brasil, Chile, Costa Rica y Perú ya han comenzado a disminuir sus tasas de política monetaria. En México y Colombia, con inflaciones contenidas, pero aún elevadas, se espera que comiencen a reducir tasas en 2024.

Para 2024 y 2025 persistirá el bajo dinamismo económico en la región, situándose por debajo del crecimiento global (Cuadro 1) y de otras economías emergentes (3.9% y 4.1%). La inflación seguirá cediendo y se proyecta que alcance los objetivos establecidos por los bancos centrales en 2024, antes que la mayoría de los países de la OCDE. Sin embargo, las economías de la región se enfrentan a numerosos riesgos externos e internos. Entre los factores más relevantes se destacan una demanda externa y comercio debilitado y en particular la desaceleración de China, que afecta de manera importante a las economías exportadoras de materias primas como Argentina, Chile, Brasil, Colombia y Perú y la incertidumbre en los mercados financieros internacionales debido a tensiones geopolíticas y la evolución de las políticas monetarias en países avanzados. La inflación podría permanecer en niveles elevados por un tiempo mayor al anticipado. Además, un aumento en la frecuencia e intensidad de eventos climáticos extremos, como la llegada del Niño, podría afectar más de lo previsto a algunas economías particularmente expuestas a ellos.

Cuadro 1. Perspectivas económicas de los pases de América Latina

Nota: América Latina (ALC) es la media ponderada por PIB a paridad de poderes de compra de los 7 países en la tabla para el PIB; y la media simple de los países incluidos en el cuadro para la inflación.
Fuente: OCDE Perspectivas Económicas, noviembre 2023.

En este contexto macroeconómico incierto y volátil, resulta clave asegurar la estabilidad macroeconómica y un crecimiento fuerte.

Momento de enfrentar el desafío fiscal  

Por el lado de la política monetaria, con la inflación decelerando, la discusión se centra en el ritmo de las futuras reducciones de tasas de interés. El objetivo debe ser que las tasas de inflación vuelvan a sus metas de manera duradera, transitando hacia una posición de la política monetaria más neutral. Esto requerirá diferentes ritmos y tiempos en la reducción de tasas, según las particularidades de cada país. El ritmo de normalización deberá considerar cuidadosamente múltiples riesgos, como el impacto de El Niño y los precios del petróleo más altos, y la política monetaria en las economías avanzadas.

Por su parte, las autoridades fiscales se enfrentan al reto de seguir disminuyendo la deuda pública, que aumentó significativamente después de la pandemia, en un entorno en el que los tipos de interés a largo plazo han aumentado (Gráfico 1). La mayoría de los países ha retirado exitosamente los estímulos fiscales de la pandemia y ha empezado a reducir los déficits, pero enfrentan desafíos significativos dados los altos niveles de deuda, el poco espacio fiscal y el bajo potencial de crecimiento. La consolidación fiscal es un paso necesario para restablecer el margen de maniobra fiscal y evitar los riesgos asociados con elevados niveles de deuda, como pagos de intereses más altos que pueden desplazar los gastos públicos esenciales, especialmente en un contexto internacional de tasas de interés más altas durante más tiempo.

En la mayoría de los casos, los gobiernos de América Latina tienen planes de consolidación fiscal ambiciosos que llevarían a estabilizar la deuda, pero cómo alcanzar estos objetivos es clave. Esto requiere en un primer momento y como prioridad, reforzar los marcos fiscales de mediano plazo para dar una clara y creíble orientación futura sobre cómo se alcanzarán los objetivos fiscales y se reducirá la deuda, basados en proyecciones macroeconómicas y fiscales realistas, al tiempo que se protege la inversión pública, que a menudo es una víctima de la consolidación fiscal en la región. Elementos esenciales son incluir anclas de mediano plazo, como niveles prudentes de deuda, y cláusulas de escape bien definidas con mecanismos de corrección en las reglas fiscales. Se deben fortalecer también los consejos fiscales, dotándolos de independencia legal y de facto, recursos y acceso adecuado a la información, ya que pueden contribuir de forma importante al análisis de la sostenibilidad de las finanzas públicas. Además, superar obstáculos políticos para implementar reformas fiscales que aumenten la eficiencia del gasto, que es baja, y los ingresos tributarios, también bajos en la mayoría de los países de la región, son retos importantes.

El potencial de crecimiento en la región es bajo, lo que limita también el espacio fiscal. Esto hace crucial acelerar las reformas estructurales necesarias desde hace mucho tiempo, y fomentar el consenso necesario para llevarlas a cabo. Impulsar reformas que dinamicen el comercio, que establezcan marcos regulatorios estables para la inversión privada en conectividad, energías renovables y minerales sostenibles, y redoblar esfuerzos para mejorar la calidad de la educación es clave para potenciar la productividad y la inversión. Estas reformas facilitarán la adaptación al cambio climático y la transformación digital, y, al impulsar el crecimiento potencial, contribuirían de manera decisiva a la sostenibilidad fiscal de la región.

Gráfico 1. El incremento en la deuda pública y los pagos de intereses restringen el espacio fiscal
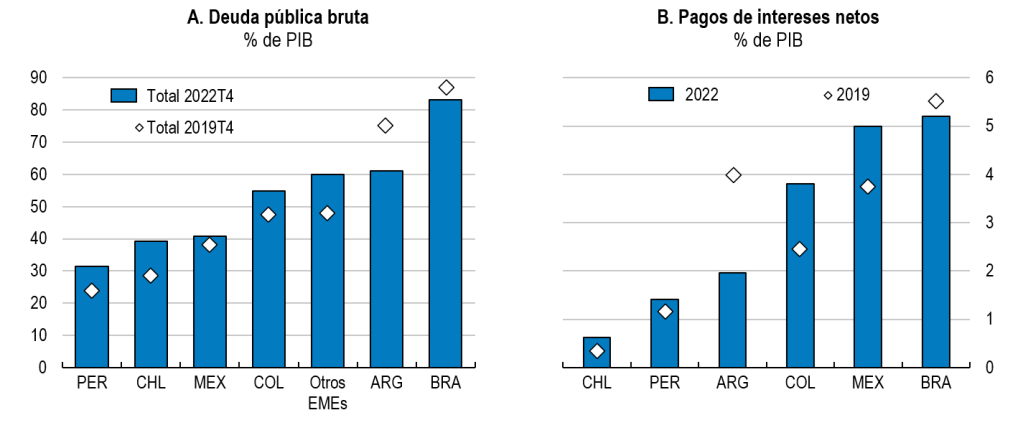
Nota: Panel A: Otras economías de mercados emergentes (EMEs) es el promedio no ponderado de China, Filipinas, India, Indonesia, Malasia, Tailandia, Turquía, y Suráfrica. Panel B: Los datos para Chile se refieren al año 2021 en lugar de 2022.
Fuente: FMI, Base de datos sobre inversores soberanos; Base de datos de Perspectivas Económicas de la OCDE; y FMI, Monitor fiscal, octubre 2023.

Más información:

OECD Economic Outlook, Noviembre 2023– Reporte completo en inglés con las proyecciones macroeconómicas, los principales desafíos estructurales e información detallada por país.

Perspectivas económicas de la OCDE para países de América Latina, Noviembre 2023.

Información detallada por país: Argentina | Brasil | Chile | Colombia | Costa Rica | México | Perú


Institutional shareholding, common ownership and productivity: a cross-country analysis

By Maria Bas1, Lilas Demmou, Guido Franco and Javier Garcia-Bernardo2

The increase in institutional ownership, accompanied by the shift towards passive portfolio management and the rise of common ownership, have transformed OECD countries financial markets in the last decades. These transformations have the potential to influence listed firms’ productivity, given the role of equity owners in allocating private savings across firms and influencing firms’ investment decisions.

Against this backdrop, and relying on a rich firm-level dataset covering financial and granular ownership information on firms across a wide range of countries and sectors, Bas et al. (2023) study the productivity consequences of these changes via two main channels: a “governance channel”, looking at the role of institutional owners’ business model (i.e., investment style, time horizon etc.); and a “common ownership” channel, analysing the productivity impact of simultaneous ownership of shares in competing firms (i.e. intra-industry) or potentially vertically integrated firms (i.e. inter-industry).

The governance channel

The business model of institutional owners has recently been the subject of debate in two main areas. First, institutional investors tend to have higher portfolio turnover rates than corporate owners, potentially inducing a focus on short-term outcomes, while long-term-oriented owners are more likely to support innovative and human capital-intensive projects that yield (productivity) benefits over time. Second, institutional investors increasingly rely on passive investment styles, characterized by reduced monitoring but also increased diversification, which can encourage support for R&D activities by attenuating idiosyncratic risks associated with innovation.

Our main findings suggest, overall, a positive relationship through the governance channel: firms displaying higher institutional ownership tend to have higher productivity levels and growth rates compared to their peers (Figure 1). Consistent with theory, there is some heterogeneity across different types of institutional investors depending on their time horizon and investment style. On the one hand, the positive correlation tends to vanish when institutional investors’ horizon shortens, highlighting the relevance of the provision of patient capital (Figure 1). On the other hand, the correlation appears larger the higher the shares of large, passive and diversified owners, confirming that a diversified portfolio may favour support to innovative investments despite potential lower monitoring.

Figure 1 Institutional ownership and productivity are positively related at the firm-level

Note: Interpreting results as if they were causal, the blue bars represent the average change in firms’ productivity following a 5 p.p. increase in institutional ownership. The orange whiskers indicate the 95% confidence intervals. Source: Bas, Demmou, Franco and Garcia-Bernardo (2023).

The common ownership channel

The consequences of common ownership for firms’ productivity may vary depending on whether it occurs within industries or across industries.

Intra-industry common ownership. Firms operating in the same industry and belonging to the same investor’s portfolio may, in the interest of their common shareholders, compete less intensively on product markets, for instance by colluding more easily, with detrimental consequences for productivity (competition channel). At the same time, intra-industry common ownership could benefit innovation and productivity when inter-firm coordination is explicit (e.g. joint ventures or strategic alliances) and firms find it easier to cooperate in their R&D efforts and share knowledge (cooperation channel). The estimates from the analysis linking intra-sector common ownership and productivity are not always significant (Figure 2, left panel). Still a negative relationship appears to prevail when they are, hinting that the competition channel may slightly outweigh the cooperation channel. The negative association is stronger in innovative sectors, further corroborating the potential existence of a competition channel given that these industries tend to be more concentrated.

Inter-industry common ownership. Common ownership along the value chain may lead to stronger business relationships among vertically integrated firms, (vertical integration / spillover channel), by attenuating hold-up problems when information asymmetries are high. Moreover, from a general equilibrium perspective, the attempt to increase profits through higher prices and lower competition is not immune to a backlash for common owners, as they risk ending up with lower profits in downstream industries due to higher inputs costs. The empirical investigation supports the existence of a positive relationship between inter-industry common ownership and firm-level productivity (Figure 2, right panel). The positive association is again stronger for firms producing in innovative sectors, potentially due to a more efficient network of vertical relationships and technological spillovers, which are particularly relevant in these sectors.

Figure 2 The productivity implications of common ownership depend on whether it occurs intra- or inter-industry

Note: Interpreting results as if they were causal, the blue bars represent the average change in firms’ productivity following an increase in inter (left panel) or intra (right panel) industry common ownership from 0 to the level observed at the 75th percentile of the distribution of the respective firm level common ownership measure. The orange whiskers indicate the 95% confidence intervals. Common ownership is measured as in Azar et al. (2018) and Azar et al. (2021). Source: Bas, Demmou, Franco and Garcia-Bernardo (2023).

References

Azar, J., M. C. Schmalz and I. Tecu, (2018), “Anticompetitive effects of common ownership”, The Journal of Finance, Vol. 73(4): 1513–1565. https://doi.org/10.1111/jofi.12698.

Azar, J., and X. Vives, (2021), “Revisiting the anticompetitive effects of common ownership”, IESE Business School Working Paper. https://dx.doi.org/10.2139/ssrn.3805047.

Bas, M., Demmou, L., Franco, G., Garcia-Bernardo, J. (2023), “Institutional shareholding, common ownership and productivity: A cross-country analysis”, OECD Economics Department Working Paper No 1767, https://doi.org/10.1787/d398e5b4-en.


What explains the ongoing credit slowdown in advanced economies?

Monetary policy image

by Lucia Quaglietti, Economist, Macroeconomic Policy Division, OECD Economics Department

Credit conditions across OECD countries have tightened sharply in recent quarters, with rising policy rates quickly reflected in bank lending rates and bank lending standards becoming more restrictive. Credit growth has slowed, especially to households. New mortgage lending to households has fallen by around 30% year-on-year in the euro area and in the United Kingdom in 2023. A key question is whether this reflects the impact of more restrictive lending conditions or whether demand for borrowing has just declined sharply.

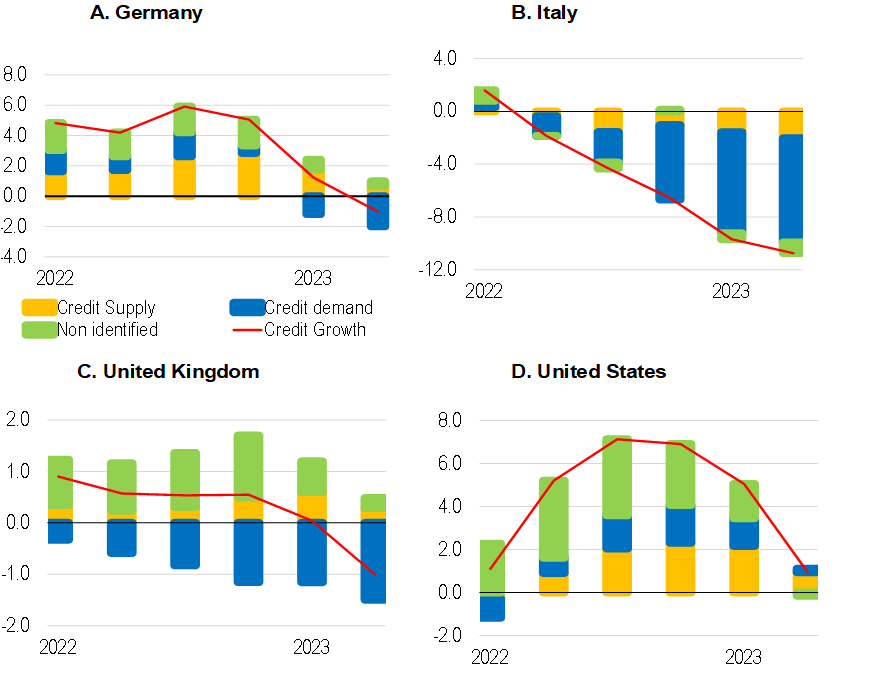
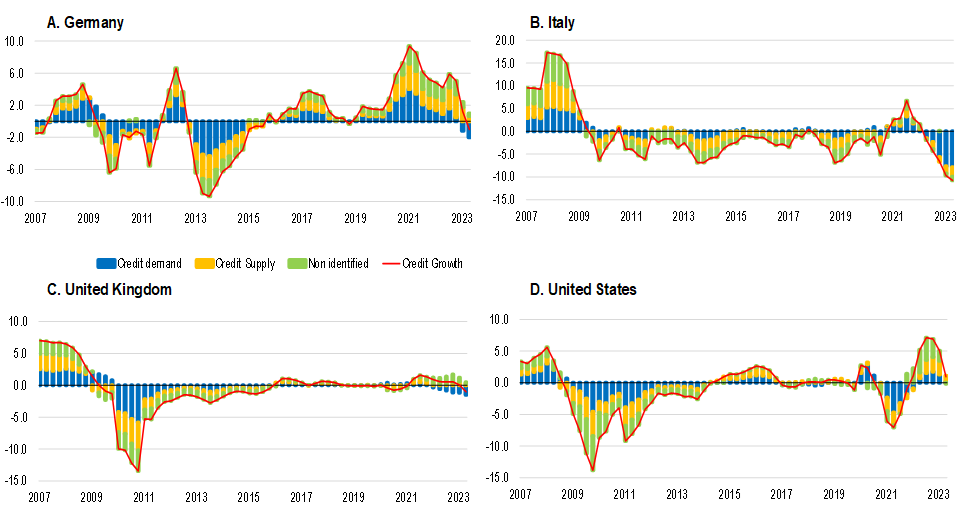
Credit growth is shaped by a range of factors that affect credit demand and supply conditions. Estimates of the impact of these factors on total credit growth to households and non-financial corporations have been obtained for Germany, France, Italy, the United Kingdom and the United States (Quaglietti, 2023). The technique used (structural VARs) permits four types of shocks to be identified: aggregate demand shocks, aggregate supply shocks, monetary policy shocks and credit supply shocks. The contribution of these different shocks to the annual rate of credit growth in 2022 and 2023 is shown in Figure 1, with a longer-term perspective provided in Figure 2. For simplicity, shocks to credit demand are shown as the combined impact of all identified shocks other than credit supply shocks.

  • The results suggest that the recent sharp slowdown in credit reflects a combination of tighter credit supply and falling demand, with the balance of these factors differing across economies (Figure 1).
  • Tighter credit supply has been a more important driver of recent credit dynamics in the United States than weaker credit demand, although other (non-identified) factors have also contributed to credit growth developments (Figure 1).
  • Weaker credit demand accounts for the bulk of the slowdown in Germany, Italy and the United Kingdom. The impact of deteriorating demand conditions appears to be particularly sizeable in Italy, reducing average annual credit growth by 7 percentage points in 2023 (Figure 1). Over the same period, in Germany and the United Kingdom credit demand shocks appear to have lowered average annual credit growth by 1.5 percentage points.
  • The current slowdown in credit growth is comparatively mild relative to that seen during the global financial crisis in many countries, with the exception of Italy (Figure 2). In 2009-10, credit supply and credit demand both contracted sharply. This also occurred in Germany and Italy during the subsequent euro area crisis.

Bank lending surveys broadly corroborate these findings. Banks overwhelmingly report a tightening of credit standards (a supply shock) in the United States, especially for mortgage lending, and a sharp decline in credit demand in the euro area, especially for house purchase.

Higher interest rates, low consumer confidence and falling real disposable income have weakened credit demand by households and firms. The banking sector now is better capitalised than prior to the global financial crisis, and credit supply shocks were still marginally boosting credit growth in most countries as of mid-2023. Even so, banks have tightened credit standards due to rising risk aversion, higher funding costs and balance sheet constraints. In the euro area, the decrease in liquidity following TLTRO (targeted longer-term refinancing operations) repayments may also have contributed to weaker credit supply (Lane, 2023).

So far, there are few signs of a severe and widespread credit shortage of the type seen in the global financial crisis. Ample capital and liquidity buffers and low levels of non-performing loans currently allow banks to continue supplying credit to households and firms, enabling an orderly transmission of monetary policy. But risks remain, especially if the current economic slowdown were to deepen. As banks continue to pass through past increases in policy rates to households and corporates, delinquency rates and non-performing loans could rise, potentially generating credit losses that would weigh on the supply of new credit to the economy. Credit demand could also weaken further in the event of a sharp economic downturn or a swift repricing in asset prices.

Figure 1. Contributions of demand and supply shocks to recent developments of credit growth

Decomposition of the year-on-year percentage change of credit growth relative to its long-term trend

Note: The decomposition is based on the moving average representation of the estimated VARs, and shows in each quarter the contribution of contemporaneous and past structural shocks to credit growth expressed as a deviation from its long-term trend over the period 2000Q1-2023Q2. This trend broadly corresponds to the sample average. Credit demand shocks are obtained as the sum of aggregate demand, aggregate supply and monetary policy shocks. The green bars correspond to unidentified factors [1}.

Source: Bank of England, European Central Bank, Federal Open Market Committee and OECD calculations.

[1] The VAR for each country is estimated by Bayesian techniques, with shocks identified by sign restrictions based on standard theoretical models (Gambetti and Musso, 2017). Aggregate supply shocks are assumed to drive real GDP and inflation in opposite directions; aggregate demand shocks move real GDP, inflation, policy rates, bank lending rates and credit growth in the same direction; positive (i.e., rate-increasing) monetary policy shocks negatively affect both GDP and inflation; and expansionary credit supply shocks are assumed to lead to an increase in output, inflation and (due to the central bank policy reaction) policy rates but make bank lending rates and credit growth move in opposite directions. The VARs are estimated with one lag and sign restrictions are imposed on impact only (first quarter).


Figure 2. Contributions of demand and supply shocks to credit growth in the period 2007-2023

Decomposition of year-on-year percentage change of credit growth relative to its long-term trend

Note: See note to figure 1.
Source: Bank of England; European Central Bank, Federal Open Market Committee; and OECD calculations.


References

Lane P. (2023) “The banking channel of monetary policy tightening in the euro area”, remarks at the Panel Discussion on Banking Solvency and Monetary Policy, NBER Summer Institute 2023 Macro, Money and Financial Frictions Workshop.

Musso, A. & L. Gambetti, (2017), “Loan supply shocks and the business cycle”, Journal of Applied Econometrics, Vol. 32, No. 4, pp. 764-782

Quaglietti, L. (2023), ‘’Drivers of credit growth across advanced economies’’, OECD Economics Department Working Paper, forthcoming.


Higher defence spending will add to the pressures on the public finances

by Mauricio Hitschfeld, Álvaro Pina and Enes Sunel

For several decades the ‘peace dividend’ enabled governments to reduce the share of defence spending in total public expenditure, creating space to help meet demands for additional public expenditure on social protection and health. Growing geopolitical tensions are prompting reassessments of this strategy, with several countries announcing plans to increase defence spending over the next few years. These plans, which are already being implemented in some countries, will compound the rising pressures on the public finances from ageing societies, the climate transition and rising debt-service costs, as noted in the September 2023 OECD Interim Economic Outlook.

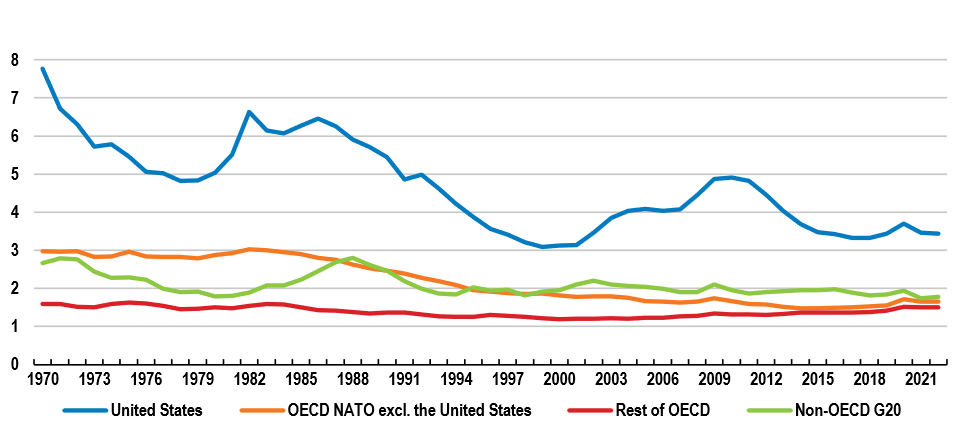
Across G20 countries as a whole, defence spending relative to GDP has declined in the past 50 years, from an average of about 3.8% in the 1970s to 2.4% in the 21st century. However, there have been marked differences across countries. US defence expenditure fell particularly sharply, from 6.0% of GDP in the 1980s to an average of 3.9% of GDP since the turn of the century (Figure 1). In relative terms, the gains from the end of the cold war were even larger for other OECD countries who are longstanding NATO members, with their joint spending declining from 2.8% of GDP in the 1980s to 1.6% of GDP since the year 2000. Military spending in non-NATO OECD members such as Australia, Japan and Mexico has in general been lower and more stable over time.

Figure 1. Global defence spending has declined since the 1970s

Defence spending, per cent of GDP, current prices

Note: OECD and NATO based on current membership. Aggregates show averages weighted by GDP at market prices in USD. Their composition changes over time due to data availability. Saudi Arabia is excluded from the non-OECD G20 aggregate due to the very high volatility of its defence spending.
Source: Stockholm International Peace Research Institute; and OECD calculations.

The reduction in spending has also been more modest in non-OECD G20 economies, a highly diverse group of countries. For instance, defence spending in China has become the second largest in the world in absolute terms, but relative to GDP is estimated to be close to the G20 median. Russia’s spending in per cent of GDP has remained internationally high since the mid‑1990s, particularly over the past decade.

Many OECD countries have begun to raise defence spending as a share of GDP over the last 2-3 years. There have been particularly strong increases in Greece and some Central and Eastern European countries, including Finland, Latvia, Lithuania and Poland, but also in many economies in Western Europe, partly reflecting military aid to Ukraine.

Further spending increases, sometimes sizeable, are likely in the coming years. France, Germany and Japan have started to implement detailed medium-term plans for that purpose, aiming at increases of about 0.4% of GDP, 0.7% of GDP and 1% of GDP respectively. In other countries, a long‑term target exists that implies higher defence spending (for instance, 2% of GDP in Canada and Italy, as per NATO commitments, and 2.5% of GDP in the United Kingdom) but medium-term plans to reach these levels have not yet been released. In contrast, the two OECD G20 countries where military expenditures as a share of GDP are highest, the United States and Korea, do not currently plan to further increase that share. Non‑OECD G20 countries have in general not increased defence spending as a share of GDP in the recent past (Russia is an exception), nor have they announced plans to do so in the medium term.

As with other areas of public spending, improvements in the efficiency of defence spending could help to contain the budget costs of achieving the intended improvement in military effectiveness. Options to enhance efficiency may differ across countries given, among other factors, the variation in the composition of defence spending (Figure 2). The average share of defence budgets spent on investment in equipment in the countries shown is 20% and on personnel costs 48%, with an average 29% devoted to maintenance and single-use equipment and 4% to other spending items, but there are large differences between countries.

Figure 2. The composition of defence spending differs substantially across countries

Shares in total defence spending, per cent, 2012-21 average, current prices

Note: Durable military equipment corresponds to gross fixed capital formation (GFCF), personnel to compensation of employees and maintenance and single-use equipment (such as ammunition) to intermediate consumption. Since GFCF is often volatile, a 10-year average is considered. Values for Korea correspond to the 2012-20 average.
Source: OECD Classification of the Functions of Government (COFOG) database; and OECD calculations.

References

OECD (2023), OECD Economic Outlook, Interim Report September 2023: Confronting Inflation and Low Growth, OECD Publishing, Paris, https://doi.org/10.1787/1f628002-en.


How widespread has the rise in unit profits been?

Compass pointing to profits

By Geoff Barnard and Patrice Ollivaud, OECD Economics Department

In an earlier post on this blog, the decomposition of GDP inflation (year-on-year increases in the GDP deflator) into contributions from unit profits, unit labour costs and unit net taxes across a range of OECD economies was discussed, drawing on an exercise described in the most recent OECD Economic Outlook (OECD, 2023). While informative, the economy-wide picture of unit profits leaves open the policy-relevant question of whether the increase in profits has been widespread across the economy or concentrated in only a few industries.

To get insights about where and by how much profit margins may have increased as inflation rose, information is needed on how an economy-wide increase in profits is distributed across firms. One approach is to use firm-level data. The evidence from this work is mixed. Colonna et al. (2023) find that margins rose in the United States and in non-tradeable sectors in Germany, and returned to pre-pandemic levels in Italy after an earlier decline. Weber and Wasner (2023), using US firm-level data, argue that rising prices after the first phase of the COVID-19 pandemic were mainly the result of market power and implicit agreements between large firms. In contrast, Glover et al. (2023) suggest that the rise of mark-ups in the United States during 2021-22 was due to firms anticipating future cost increases rather than an increase in monopoly power or higher demand. And Bijnens et al. (2023) find no evidence of a widespread opportunistic raising of profit margins in 2022 among firms in Belgium.

Another possible angle is to look at profits by sector. Doing this for the 13 OECD commodity-importing economies that produce timely data on a comparable basis, and computing unit profit as value added minus labour compensation, suggests that a disproportionate part of the observed increase of unit profits in 2022 came from mining and utilities: that is, mining and quarrying together with electricity, gas and water supply (Figure 1, Panel A). This sector accounts for only about 4% of the average economy but more than 40% of the rise of unit profits in 2022 as a whole in this group of commodity-importing countries. For these countries, this likely corresponds mainly to electricity and gas supply, including renewable electricity producers, who did not suffer from higher costs as fossil fuel prices soared, but benefited from higher retail prices. On the other hand, this effect was far from uniform across countries. Neither Germany nor France (Panels C and D of Figure 1) had a large increase in mining and utilities unit profits until late in 2022 or early 2023, when fossil fuel prices were turning down. In the case of the United Kingdom (Panel F), most of the increase in unit profits’ contribution to GDP inflation from negative values in early 2021 to above 5% in the fourth quarter of 2022 corresponded to a swing in unit profits in services, although other sectors, including mining and utilities, also contributed.

Figure 1. Mining and utilities account for a substantial share in the increase in unit profits

Contribution of unit profits to year-on-year GDP inflation

Note: Unit profits based on estimated sectoral gross operating surplus in current values. The latter is computed as sectoral output minus sectoral compensation and an estimate of unit taxes (based on the value at the macroeconomic level in percent of GDP applied to sectoral GDP) and reconciled so that the sum across sectors equals the macroeconomic level. OECD commodity importers correspond to a simple average of Austria, Belgium, Denmark, Finland, France, Germany, Greece, Ireland, Italy, the Netherlands, Spain, Sweden and the United Kingdom.

Source: OECD Quarterly National Accounts database; and OECD calculations.


On a quarterly basis, the contribution of other sectors to the rise of unit profits in the group of commodity-importing countries as a whole gradually increased through 2022 and into the first quarter of 2023, with stronger effects from both services and (through end-2022) manufacturing. Considering the small share of agriculture in the economy (less than 2% for the euro area), the contribution of unit profits in this sector to the overall unit profit contribution to GDP inflation is also notable. Thus, while the increase in unit profits (and thus the contribution to inflation) has been widespread across sectors in commodity-importing OECD economies, and while the details vary significantly across individual countries, the disproportionate rises in mining, utilities and  agriculture suggest some strong sector-specific effects.

Among OECD commodity exporters, there is only one country, Norway, with the necessary sector data on a comparable basis, so this is the only source of information on sectoral developments of unit profits for this group of countries. As expected, the bulk of the large increase in unit profits in Norway in 2022 came from mining and utilities (Figure 1, Panel B), with the contribution of unit profits to GDP inflation plummeting from 2022Q4 because of the global fall in energy prices.

Overall, there is evidence from available cross-country sectoral profit data that the surge in energy prices and the associated increase in the profits of energy and utility providers over 2021-22 played an important role in the widespread rise in the aggregate contribution of unit profits to GDP inflation. The strong rise in international food commodity prices also appears to have helped push up unit profits in agriculture in many countries, although the small size of that sector means that the impact on economy-wide profits was generally limited. The sectoral data indicate, however, that the size, timing and distribution of the increase in unit profits, and thus of their contribution to GDP inflation, varied quite widely across OECD economies – no single story fits all countries.

References

Bijnens, G., C. Duprez and J. Jonckheere (2023), “Are price hikes in Belgium being driven by greed?”, National Bank of Belgium blog, 26 June 2023.

Colonna, F., R. Torrini and E. Viviano (2023), “The Profit Share and Firm Mark-up: How to Interpret Them?”, Occasional Papers, Banca d’Italia, No. 770.

Glover, A., J. Mustre-del-Rìo and A. von Ende-Becker (2023), “How Much Have Record Corporate Profits Contributed to Recent Inflation?”, Economic Review, Federal Reserve Bank of Kansas City.

OECD (2023), OECD Economic Outlook, Volume 2023 Issue 1, OECD Publishing, Paris.

Weber, I. and E. Wasner (2023), “Sellers’ Inflation, Profits and Conflict: Why can Large Firms Hike Prices in an Emergency?”, Economics Department Working Paper Series, University of Massachusetts Amherst.


Corporate taxation can support business investment, but details of the tax system matter

By Tibor Hanappi, Valentine Millot and Sébastien Turban, OECD Economics Department

Business investment has been weak in OECD countries since the global financial crisis (GFC). What can be done to boost it?

One potential lever is to modify corporate taxation to reduce the cost of capital, which is usually considered as a key investment determinant (Feld and Heckemeyer, 2011[3]; Vartia, 2008[4]; Schwellnus and Arnold, 2008[5]). However, as can be seen in the figure below, while the cost of capital has steadily fallen, reflecting the secular decline in global interest rates and cuts in statutory corporate tax rates (STR), business investment rates have not increased and real investment has barely caught up with its pre-GFC trend. These observations suggest that either the sensitivity of firms’ investment to the cost of capital has declined, or the desired level of investment for a given cost of capital has fallen because of other factors. In turn, they raise questions about whether and which changes to corporate tax systems can stimulate business investment.

Note: Panel A: Investment intensity is computed as the ratio of gross fixed capital formation over gross value‑added in business sectors (Sectors B through N according to the ISIC Rev.4 classification, excluding Real Estate). Panel B: The cost of capital corresponds to the rate of return on a marginal investment required for an investor to break even after tax. It is computed based on the formula from Hanappi (2018[4]), the fiscal parameters from Spengel et al. (2020[5]), long-term sovereign interest rates and changes in the GDP deflator as a proxy for inflation. Trends and changes in the cost of capital, but not levels, are robust to replacing sovereign bond yields with a stable premium for corporations. In both panels, the shaded area corresponds to the interquartile range across OECD countries.
Source: Hanappi, Millot and Turban (2023), “How does corporate taxation affect business investment? Evidence from aggregate and firm-level data”, OECD Economics Department Working Papers, No. 1765, OECD Publishing, Paris.

Aggregate trends hide heterogeneity in investment responses to taxation. Indeed recent analysis has shown that the sensitivity of firm investment to corporate taxation tends to be heterogeneous across different types of firms (Federici and Parisi, 2015[6]; Zwick and Mahon, 2017[7]; Fuest, Peichl and Siegloch, 2018[8]; Kopp et al., 2019[9]; Millot et al., 2020[10]). As such, a more nuanced assessment of the implications of corporate taxation on investment and growth is needed.

Our new paper (Hanappi, Millot and Turban, 2023) aims to fill this need. We bring together country-industry and firm-level data on investment, as well as detailed data on the cost of capital and its tax component, to analyse how the tax sensitivity of investment has evolved over time and how it differs across firm and investment characteristics. Finally, we also disentangle key parameters of the corporate tax system to analyse the potential impacts of different tax designs.

The tax sensitivity of investment has weakened since the GFC and varies across firms and tax parameters

Our estimations at the industry and the firm level confirm previous findings that business investment tends to respond negatively to increases in corporate taxation as measured by forward-looking effective tax rates (ETRs) (see Hanappi (2018[4]) for details on the methodology to construct those ETRs). However, the analysis shows that the tax sensitivity of investment fell after the GFC, suggesting that lower ETRs increase investment less now than they did in the past.

We also find that firms that are large, are part of multinational groups, have a large proportion of intangibles in their total fixed assets, or are highly profitable, have all become less sensitive to taxation compared to other firms after the GFC. The fact that these firms have become less sensitive could largely explain the aggregate trends, as investment tends to be highly concentrated among a small number of big firms, usually belonging to multinational groups.

Finally, our paper highlights significant heterogeneity in investment responses to different corporate taxation parameters. Increases in effective taxation delivered through non-profit taxes (i.e. business taxes levied on bases other than corporate income, such as real estate or corporate wealth) have a stronger negative impact on business investment than corporate income taxes (CIT). As for the CIT, “equivalent” changes (i.e., those resulting in the same effective marginal tax rate) in the STR and in capital allowances are associated with different investment responses, depending on the initial level of STR and allowances.

What are the implications for corporate tax policy?

Corporate taxation can support business investment, but the bang for the buck may have fallen, and details of the tax system matter. The results from the empirical analysis call for a more nuanced and granular approach to corporate tax policy. Beyond headline statutory tax rates, a variety of measures can be considered to support investment effectively, accounting for heterogeneity in tax sensitivity.

Potential policy options include:

  • Eliminating or reducing non-profit taxes on domestic and international businesses, which are likely to generate larger adverse effects on investment than taxes on profits.
  • Limiting cuts in the headline corporate income STR; which can be relatively costly compared with other corporate tax policies, as they lower the effective tax rates for all firms regardless of their tax sensitivity.
  • Considering the use of targeted CIT instruments to support specific investments, provided that a coherent policy rationale and a strong institutional framework exist. Differences in effective tax rates across assets and firms can be justified when there are positive externalities. However, decisions to implement targeted measures should also account for the costs of the induced distortions, potentially increased compliance costs and administrative burdens for taxpayers and tax authorities.
  • Making use of more generous capital allowances to reduce ETRs where they are expected to induce strong investment responses. Higher STRs, combined with more generous capital allowances, are likely to be less distortive as the CIT would be largely levied on economic rents. Moreover, such policies would likely be less affected by the Global Minimum Tax under the Global Anti-Base Erosion (GloBE) Rules due to the exclusion of a fraction of the value of assets and payroll from the base of the minimum tax.

Read more on the new paper: How does corporate taxation affect business investment? Evidence from aggregate and firm-level data in the direct link here.

References

Federici, D. and V. Parisi (2015), “Do corporate taxes reduce investments? Evidence from Italian firm-level panel data”, Cogent Economics & Finance, Vol. 3, https://doi.org/10.1080/23322039.2015.1012435. [6]
Feld, L. and J. Heckemeyer (2011), “Fdi and taxation: A meta-study”, Journal of Economic Surveys, Vol. 25/2, pp. 233-272, https://doi.org/10.1111/j.1467-6419.2010.00674.x. [1]
Fuest, C., A. Peichl and S. Siegloch (2018), “Do Higher Corporate Taxes Reduce Wages? Micro Evidence from Germany”, American Economic Review, Vol. 108/2, pp. 393-418, https://doi.org/10.1257/aer.20130570. [8]
Hanappi, T. (2018), “Corporate Effective Tax Rates: Model Description and Results from 36 OECD and Non-OECD Countries”, OECD Taxation Working Papers, No. 38, OECD Publishing, Paris, https://doi.org/10.1787/a07f9958-en. [4]
Kopp, E. et al. (2019), “U.S. Investment Since the Tax Cuts and Jobs Act of 2017”, IMF Working Papers, No. 19/120, https://www.imf.org/en/Publications/WP/Issues/2019/05/31/U-S-46942. [9]
Millot, V. et al. (2020), “Corporate taxation and investment of multinational firms: Evidence from firm-level data”, OECD Taxation Working Papers, No. 51, OECD Publishing, Paris, https://doi.org/10.1787/9c6f9f2e-en. [10]
Schwellnus, C. and J. Arnold (2008), “Do Corporate Taxes Reduce Productivity and Investment at the Firm Level?: Cross-Country Evidence from the Amadeus Dataset”, OECD Economics Department Working Papers, No. 641, OECD Publishing, Paris, https://dx.doi.org/10.1787/236246774048. [3]
Spengel, C. et al. (2020), Effective Tax Levels Using the Devereux/Griffith Methodology, Project for the EU Commission TAXUD/2021/DE/303 Final Report 2021, Mannheim, https://taxation-customs.ec.europa.eu/system/files/2022-03/final_report_2021_effective_tax_levels_revised_en.pdf. [5]
Vartia, L. (2008), “How do Taxes Affect Investment and Productivity?: An Industry-Level Analysis of OECD Countries”, OECD Economics Department Working Papers, No. 656, OECD Publishing, Paris, https://dx.doi.org/10.1787/230022721067. [2]
Zwick, E. and J. Mahon (2017), “Tax policy and heterogeneous investment behavior”, American Economic Review, Vol. 107/1, pp. 217-248, https://doi.org/10.1257/aer.20140855. [7]


Shifting sands: trade partner patterns since 2018

by Seung-Hee Koh, Catherine MacLeod and Elena Rusticelli

Global trade policy is undergoing a sea-change. The share of global merchandise imports subject to trade restrictions has risen particularly rapidly since 2018, initially due to a sharp increase in tariffs on bilateral trade between the United States and China. Since then, trade policy choices have steadily become more harmful to global trade in goods (Figure 1, Panel A). Trade policy uncertainty has also increased, alongside policy discussions about the re-location of value chains and ongoing changes in the design of national industrial policies. The latest OECD Economic Outlook (OECD, 2023) analyses trends in imports of manufactured goods across major OECD economies to understand what impact this has had on trade patterns.

So far, the increasing use of trade policies has coincided with a period of subdued world trade growth, but has not reduced global merchandise trade intensity (the ratio of trade in manufactures and commodities to GDP in volume terms). Nonetheless, since the global financial crisis, global trade intensity has risen only marginally, following a period of very sharp rises in the 1990s and early 2000s. The COVID crisis saw a shallower decline and faster rebound in merchandise trade intensity than the global financial crisis (Figure 1, Panel B). In 2022, global trade in goods was 22% of global GDP in volume terms, marginally higher than 2018.

The recent resilience of trade in volume terms may be linked to the huge increase in demand for goods during the COVID pandemic, as well as strong policy support during the pandemic and energy crises. Merchandise trade as a share of GDP generally rose in OECD countries between 2018 and 2022, including in Europe and Japan, offsetting a decline in Chinese merchandise trade intensity. However, merchandise trade intensity was relatively unchanged in the United States, where weak export growth offset a rise in import intensity.

Underneath the general rise in the value and volume of trade, imported manufactured goods at a country-level reveal important and differing shifts in the composition of manufactured goods imports since 2018 in the major economies (Figure 2). A particular issue of policy interest is the evolution of trade with geographically distant partners for key inputs (far-shoring) compared to trade with geographically closer trade partners (near-shoring).   

  • Shifting far-shoring: In the US, there have been sharp declines in China’s share of manufactured imports since 2018 – which have typically coincided with rising import shares from dynamic Asian economies. This includes goods where the 2018 tariffs are still applied. Evidence of near-shoring is limited, with Mexico and Canada’s share of imports rarely rising in the same categories where China’s share has fallen.
  • Expanding far-shoring: in the EU, China’s weight in manufactured imports has continued to grow steadily. In contrast to the US, this has been alongside rising import shares for dynamic Asian economies. As for the US, there is limited evidence of near-shoring: the share of imports from other OECD countries in Europe has fallen, largely driven by changes in import shares from the United Kingdom.
  • Changes at the margin: In Japan, the shifts in import shares have been much smaller than in the US or Europe. Its trade with the wider Asian region has increased steadily, although increases have been larger for dynamic Asia than China. As in Europe, this has been accompanied by a decline in the share of imports from other advanced economies.

So far, these shifts in trade patterns have occurred whilst aggregate trade has continued to expand broadly in line with global activity. However, in a global economy with slowing long-term growth prospects the economic costs of more harmful trade policies may become more evident over time.


References:

OECD (2023), OECD Economic Outlook, Volume 2023 Issue 1, OECD Publishing, Paris, https://doi.org/10.1787/ce188438-en.


Monetary policy and credit standards: this time it’s different

by Almira Enders and Dennis Dlugosch, OECD Economics Department

The current monetary policy tightening cycle observed in many countries stands out for several reasons. In particular, it is rapid, globally synchronised and accompanied by an equally rapid tightening of credit standards (OECD, 2022).

Since February 2022, the US Federal Funds Target Rate has risen by 500 basis points (Figure 1 Panel A). No tightening cycle since the mid-1980s has seen such a big increase in policy rates in such a short period of time. Central banks in other main advanced economies have acted comparably aggressively in their fight against high inflation. The European Central Bank, for example, has raised its policy rates by 400 basis points since June 2022. The increase of policy rates has been quickly transmitted to money market and bank lending rates over the past year (OECD, 2023).

Figure 1. Policy rates and credit standards have tightened in sync

Note: Starting on Dec 16, 2008, the fed funds target rate contains the average of the upper and lower limits of the target range of the fed funds rate. Prior to Dec 16, 2008 the fed funds target rate was a fixed rate. Credit standards refer to net percentage of US domestic banks reporting tightening of standards for commercial and industrial loans to small firms (in percent, not seasonally adjusted).
Source: Federal Reserve Board; OECD calculations.

While the tightening of credit conditions is a standard transmission channel of monetary policy, the synchronised increase in interest rates and tightening of credit standards is eye-catching in comparison to previous tightening cycles (Figure 1 Panel B).[1]  Credit standards are non-price measures that determine access to credit, such as collateral requirements, employment status or income situation. Credit standards can restrict access to credit in addition to sheer the changes in lending rates which affect the supply and demand for credit through their impact on cost of debt and banks’ and borrowers’ balance sheets.

The net share of banks reporting tightened credit standards in the current monetary policy tightening cycle has increased, in step with the increase in policy rates. In March and April 2023, the net share of banks tightening lending standards to small firms over the previous three months reached 47% in the US.[2] While this share is still below the peaks reached during the Covid-19 crisis (70%) and the Global Financial Crisis (about 75%), the current rapid tightening of credit standards is similar to the dynamics seen during the last two severe economic downturns. In the euro area, as well, the current monetary policy tightening was accompanied by the tightening of credit standards, although less rapidly than in the US. The corresponding net share of banks tightening credit standards  in the euro area increased to about 24% recently, only a fraction below the last peak reached during the euro area sovereign debt crisis at 28%. In the UK, the share of lenders reporting worsened availability of unsecured credit to households and small businesses widened rapidly to almost 40%, approaching the peak reached during the Covid-19 crisis of about 63%.[3]

Bank lending surveys also provide information on the reasons behind changes in lending standards. In the US, most banks have reported tighter lending standards because of a less favourable or more uncertain economic outlook and a reduced tolerance for risk. In the euro area, we observe similar patterns, as higher risk perception and a lower tolerance for risk of banks were the main reasons behind the recent tightening of credit standards.

Focussing on small firms and households is interesting because they are usually more exposed to tighter credit standards given that they rely more on bank loans as external source of finance. In the US and the euro area, the evolution of lending standards to small firms appears representative for the overall corporate sector. While in the US more banks have also reported tighter standards for credit card loans; in the euro area, the net share of banks reporting tighter credit standards for households, which includes but is not limited to credit card loans, has receded from their recent peaks over the past two quarters. In the UK, credit availability remains favourable for corporate sector and for secured lending for households.

In the past, banks rapidly tightened credit standards during severe economic downturns, mainly due to the expected deterioration of borrower’s balance sheets (Ciccarelli et al., 2015). In contrast to the current juncture, at that time monetary policy accommodated these economic downturns, by lowering interest rates in response to a slump in aggregate demand and declining inflation. The combined tightening of policy rates and credit standards has several implications for policy makers. First, it adds to the uncertainty over the impact of monetary policy on the real economy and thus makes the transmission channel for monetary policy difficult to gauge. Central banks will need to maintain restrictive monetary policy to curb inflation durably. However, monitoring financial stability and clear communication will be needed to minimise uncertainty about apparent conflicts between the pursuit of price stability and financial stability mandates. Finally, keeping an eye on competition in financial services will be critical to ensure that small business and households continue to benefit from a vibrant financial sector.

References

Ciccarelli, M., A. Maddaloni and J.-L. Peydró (2015),”Trusting the bankers: A new look at the credit channel of monetary policy”, Review of Economic Dynamics, Vol. 18 (4).

OECD (2022), OECD Economic Outlook, Volume 2022 Issue 2, OECD Publishing, Paris, https://doi.org/10.1787/16097408.

OECD (2023), OECD Economic Outlook, Volume 2023 Issue 1, OECD Publishing, Paris, https://doi.org/10.1787/ce188438-en.

Footnotes


[1] The figure shows the synchronized tightening of policy rates and credit standards in the US. The euro area bank lending survey was launched in 2003. This limits a comparison over several monetary policy tightening cycles.

[2] Based on a survey of lending practices of major US banks conducted by the Federal Reserve Board System. The number refers to the net percentage of banks that have tightened lending standards over the previous three months. The net percentage is equal to the difference between the sum of banks answering “tightened considerably” and “tightened somewhat” and the sum of banks answering “eased somewhat” and “eased considerably” in percentage of the total number of banks.

[3] Based on the Bank Lending Survey conducted by the Eurosystem of Central Banks for the euro area and based on the Credit Conditions Survey conducted by the Bank of England for the UK.


Do central bank losses matter?

coins with downward arrow

By Nobukazu Ono and Álvaro Pina, OECD Economics Department

After recording sizeable gains from quantitative easing (QE) over most of the past decade, several central banks have recently reported financial losses. Further losses are likely in the coming years. As discussed in the latest OECD Economic Outlook (OECD, 2023), these losses have long been anticipated, as past gains and current losses are two sides of the same coin. This is also the case for the adverse impact of losses on the public finances, which comes after several years of significant central bank remittances to Treasuries. Nonetheless, losses and the potential need for recapitalisation from the government can still undermine the credibility and perceived independence of central banks. This calls for transparency and clear communication in the presentation of losses.

Why are central banks making losses?

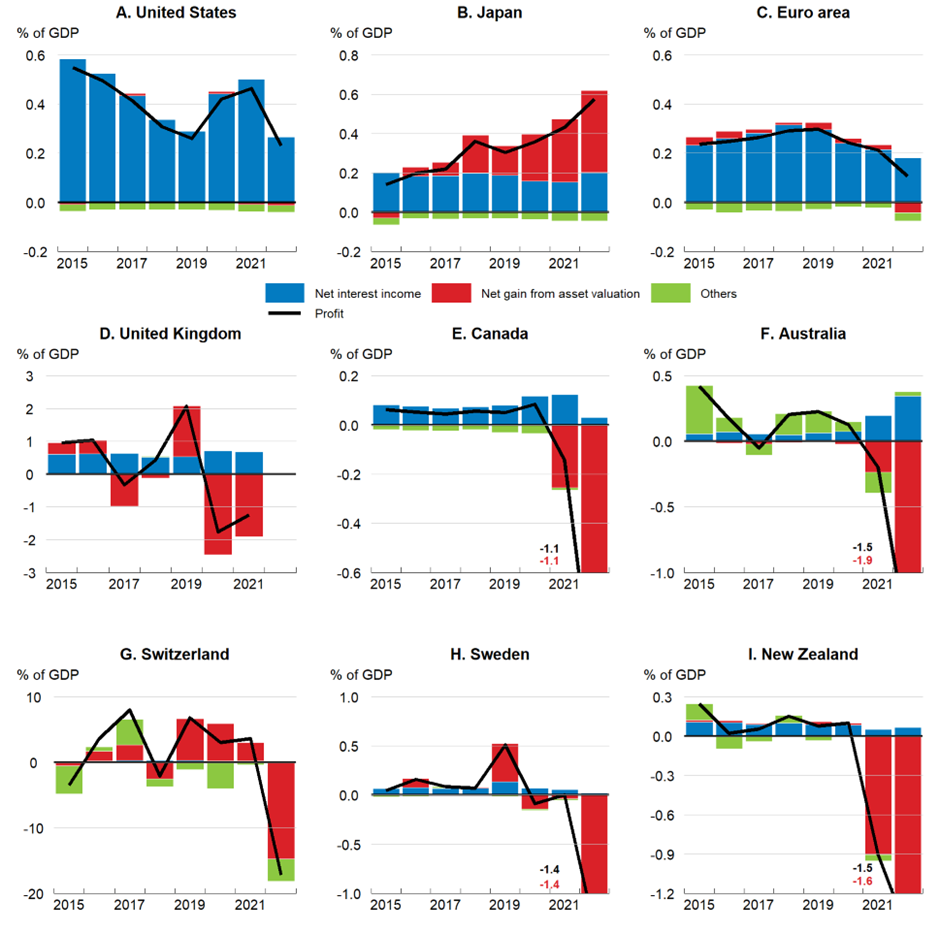
Losses largely reflect the large balance sheets built up during an extended period of QE and the effects of the recent rises in policy interest rates. QE created a sizeable mismatch in the maturity of central bank assets and liabilities. On the liability side, central bank reserves (mainly commercial bank deposits) rose sharply. The remuneration on these is closely linked to policy interest rates, and has thus risen rapidly, to the benefit of commercial banks. In contrast, on the asset side, QE purchases were mostly long-term fixed-rate bonds that generate a relatively stable stream of income. When policy interest rates were at or close to the zero lower bound, the balance of these two sets of payments generated gains for central banks. Even as policy rates were raised through 2022, their impact on whole-year net interest income was still relatively mild (Figure 1), especially where most rate increases took place towards the end of the year, as in the euro area. However, larger impacts are likely in 2023 and 2024 (Anderson et al., 2022; De Nederlandsche Bank, 2022).  

Higher interest rates also reduce the market value of securities. Valuation losses may thus arise, though this depends on the accounting frameworks and asset sales decisions of central banks. For instance, the Federal Reserve and the Bank of Japan account for securities held for monetary policy purposes using amortised cost. This means that valuation changes do not affect profits unless securities are sold, which has not been the case so far. Eurosystem accounting guidelines, also followed by Sweden, allow central banks to value securities held for monetary policy purposes at either amortised cost or the current market price. While euro area national central banks have generally opted to use amortised cost, the Riksbank has adopted market pricing, making a significant loss apparent in 2022. Mark-to-market accounting brings forward loss recognition, as also illustrated by Australia, Canada, New Zealand, Switzerland and the United Kingdom. In Switzerland, the central bank loss was unusually large in 2022, at 17 per cent of GDP, but these losses stemmed largely from changes in the domestic currency value of foreign exchange reserves, including foreign securities.

 Do losses hamper fiscal or monetary policy?

Central bank losses affect the public finances by reducing or ending central bank payments to the Treasury in the form of income taxes or remittances. Moreover, reverse cash flows (i.e., payments from the Treasury) may occur if central banks are entitled to be compensated by the government for certain losses, such as QE-related losses. For instance, in the United Kingdom, the Bank of England Asset Purchase Facility (APF), through which QE asset purchases were conducted, is fully indemnified by the Treasury.

The annual impact on the general government fiscal balance should in general be modest: over 2015-21, revenues from the central banks considered in Figure 1 rarely exceeded, and were often far below, 0.5% of GDP per year. However, even if small, the negative effect on fiscal balances could be protracted, as losses may persist for several years. Even after the central bank returns to profit, some time may elapse before remittances to the Treasury resume.

Central bank losses are not an indication of a policy error and need not hamper the effectiveness of monetary and financial policies. The policy mandates of central banks include price stability and financial stability, but not profit maximisation. Their current losses, as well as their earlier gains from QE, are a by-product of policy actions designed to help achieve their mandates. Moreover, central banks are not subject to capital adequacy requirements or bankruptcy procedures and can operate effectively even with negative equity, as the central banks of Chile, the Czech Republic, Israel and Mexico have done over several years (Bell et al., 2023).

However, losses or negative equity can pose communication challenges. For instance, some policy decisions, such as retaining rather than selling government bonds, could be misinterpreted as being motivated by a desire to contain losses rather than as actions to pursue specific policy mandates. This would reduce central bank credibility. Likewise, financial flows from government, including actions to strengthen central bank capital positions, could be misperceived as being inconsistent with central bank independence. This underscores the importance of clear communication about the reasons for losses and of a transparent framework for financial flows between the central bank and the government.

Figure 1: Several central banks now report negative profits

Note: Accounting approaches and financial years differ across countries and data should therefore be compared with caution. ‘Net gain from asset valuation’ includes realised gains/losses and, in some countries, unrealised ones. For the euro area, the chart shows the consolidated result of national central banks. The euro area figure for 2022 is based on the 17 member banks who had published results by 29 June 2023. For the United Kingdom, the chart shows the consolidated result of the Bank of England and the Asset Purchase Facility. See Box 1.3 in OECD (2023) for further details.
Source: Board of Governors of the Federal Reserve System; Bank of Japan; national central banks in the euro area; Bank of England; Bank of Canada; Reserve Bank of Australia; Swiss National Bank; Sveriges Riksbank; Reserve Bank of New Zealand; OECD Quarterly National Accounts database; and OECD calculations.

References

Anderson, A., P. Marks, D. Na, B. Schlusche, and Z. Senyuz (2022), “An Analysis of the Interest Rate Risk of the Federal Reserve’s Balance Sheet, Part 2: Projections under Alternative Interest Rate Paths,” FEDS Notes, Washington; Board of Governors of the Federal Reserve System, 15 July, https://doi.org/10.17016/2380-7172.3174.

Bell, S., M. Chui, T. Gomes, P. Moser-Boehm, and A. P. Tejada (2023), “Why are Central Banks Reporting Losses? Does it Matter?,” BIS Bulletin No 68, February, https://www.bis.org/publ/bisbull68.pdf.

De Nederlandsche Bank (2022), “Letter regarding DNB’s capital position – September 2022,” 9 September, https://www.dnb.nl/media/p4igu5fc/letter-regarding-dnb-s-capital-position-september-2022.pdf.

OECD (2023), OECD Economic Outlook, Volume 2023 Issue 1, OECD Publishing, Paris, https://doi.org/10.1787/ce188438-en.


Monetary policy pass-through to bank credit conditions: progressing fast

Monetary policy image

Ane Kathrine Christensen and Lucia Quaglietti, OECD Economics Department

Policy interest rates have risen at an unusually rapid pace since the end of 2021 in many countries. Such policy changes affect economic activity through many different channels. One key channel is the speed and extent to which changes in policy rates are passed through to financing conditions and credit growth, and thus to private consumption and investment (Bernanke and Gertler 1995; Mishkin 1996).  Analysis in the June 2023 OECD Economic Outlook, suggests that changes in policy rates in OECD advanced economies are being quickly reflected in bank credit conditions faced by households and firms, with transmission occurring at a broadly similar pace to past tightening cycles.

One indicator is the extent to which increases in policy rates have been transmitted into the interest rates on new bank loans for households and firms. The evidence suggests that transmission in the current cycle is similar to that in past tightening cycles on average, but with significant variation across countries (Figure 1, Panels A and B). In particular, there have been strong increases in the cost of new bank loans for non-financial corporations, where bank lending rates have on average increased almost one‑to‑one with policy rates. The largest relative increases in new bank lending rates have been observed in Australia, Canada, New Zealand, Norway and Sweden, in some cases reflecting an earlier start to policy tightening. In the euro area, bank lending rates charged on short-term loans to non-financial corporations have generally increased faster than those on loans with longer maturities and lending rates on consumer loans to households have risen less than rates on loans for house purchases.

Figure 1: Bank credit is slowing down and swiftly becoming more expensive

Note: For the current tightening cycle, changes in policy rates, new lending rates and real credit growth are computed between the date of the first policy increase in each country and March 2023. Similarly, changes in bank lending rates across past tightening cycles are computed since the first rate increase and over a period matching the one elapsed since the first increase in the current cycle. Changes across past tightening cycles are computed as simple averages of individual country tightening cycles since 2000. “Average” is computed as a simple average across countries. Bank lending rates and credit growth to households are for house purchases. Real credit growth is obtained by deflating nominal credit growth by national consumer prices.
Source: Central bank statistics; and OECD calculations.


Banks generally base the lending rates they charge to firms and households on their own funding costs, plus a mark-up. Rising policy rates have been quickly transmitted to interbank lending rates, but transmission to deposit rates has been sometimes slower. However, deposit rates have started to rise more rapidly recently, with banks trying to counteract tighter liquidity conditions and an acceleration in deposit outflows by offering higher rates to their customers.

Fast-rising bank lending rates have been associated with a slowdown in the pace of real credit growth (Figure 1, Panels C and D). On average, the slowdown in real credit growth during the current tightening cycle has been somewhat larger for households than for companies, though credit to firms has contracted sharply in a number of countries in the euro area and in the United Kingdom, while it has remained comparatively resilient in the United States and Canada. In the majority of the countries considered, credit growth has been weaker than at similar points in previous tightening cycles, and also lower than on average over 2000-19, particularly for households.

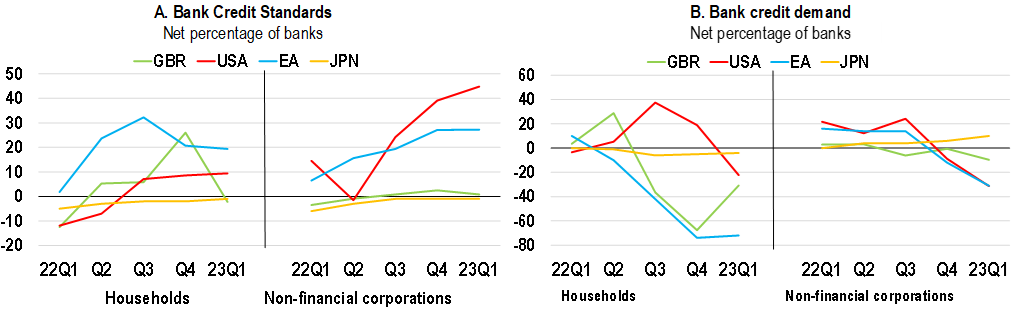
Monetary policy changes may also affect the willingness of banks to make credit available to potential borrowers. Bank lending surveys suggest that slowing credit growth and higher lending rates observed in the major advanced economies reflect a combination of tighter credit standards and falling credit demand (Figure 2). Credit standards have often tightened substantially in recent quarters, especially for mortgage lending in the euro area and for lending to non-financial corporations in the United States. Surveys point to a sharp decline in credit demand as well, especially for house purchase in the euro area and in the United Kingdom. In the euro area, the decline in credit demand for house purchases is similar to the fall seen during the global financial crisis. Japan is an exception, with credit standards and demand being little changed due to the continued accommodative monetary policy stance.

Figure 2: Credit standards have tightened and demand has declined sharply

Note: Net percentages are defined as the difference between the sum of the share of banks reporting a tightening in credit standards/rising credit demand and the sum of the share of banks reporting a loosening of credit standards/falling credit demand. Positive (negative) balances indicate tighter (easier) credit standards and rising (falling) credit demand. For the United Kingdom, credit standards are proxied by inverted loans approved. For the United States, the United Kingdom and Japan, credit standards to non-financial corporations are for large firms
Source: Central bank statistics; and OECD calculations.


The pace of policy rate increases has now begun to slow in many countries, but bank credit conditions could tighten further in the coming quarters, with banks continuing to pass through higher funding costs to households and corporates. As a result, the full impact of policy tightening on activity is likely to appear with a lag over the course of 2023 and early 2024.

References

Bernanke, B., and M. Gertler (1995). “Inside the Black Box: The Credit Channel of Monetary Policy Transmission.” Journal of Economic Perspectives, Vol. 9.

Mishkin F. (1996), “The Channels of Monetary Transmission: Lessons for Monetary Policy,” NBER Working Papers 5464.

OECD (2023), OECD Economic Outlook, Volume 2023 Issue 1, OECD Publishing, Paris.