Quantifying the link between educational policies and macroeconomic productivity

By Christine de La Maisonneuve, Balazs Égert and Dave Turner, OECD Economics Department

The importance of education is frequently emphasised by policy-makers and the OECD’s Programme for International Student Assessment (PISA) is often used to compare OECD countries educational performance of students aged 15 and to formulate policy advice. Recent OECD work not only quantifies the relationship between policies and educational performance, but further extends it to a measure of human capital and to the effect on macroeconomic productivity (Égert et al., 2023). Based on this work, this blogpost highlights the policies with the greatest potential to raise productivity through the human capital channel. In particular, boosting the participation in early childhood education and care, increasing education spending (for low spending countries) or reducing country income inequality could generate large potential gains in long-run productivity of several percentage points for some countries.

Early childhood education and care

At the student level, participation in early childhood education and care (ECEC) is the policy with one of the strongest links with student performance and productivity.

Participation in ECEC is widely recognised to have a positive effect on children’s cognitive, socio-emotional, and physical development (Heckman et. Al., 2013, Braga et al., 2013; OECD, 2022). Quality ECEC is particularly important for pupils from disadvantaged backgrounds, and those not speaking the country’s official language (Phillips et al., 2017).

Recent data (relating to 2021) show that 70% of OECD countries have already achieved an impressive 90% coverage for three-to-five-year-olds in ECEC. However, the same data suggest that one-fifth of OECD countries have a coverage which is between 10 and 60 percentage points below this threshold, suggesting an increase in PISA score of between 5 and 20 points and the potential for long-run gains in productivity of between 0.6% and 2.9% (Figure 1). Türkiye and Switzerland have the most to gain from raising ECEC participation to this 90% threshold, with potential long-run productivity gains of 2.9% and 1.8%, respectively, but United States, Greece, and Costa Rica might also benefit with long-run productivity gains of about 1.5%.

Education spending

At the country level, education spending has a strong link with student performance and productivity.
The literature summarised in Smidova (2019) suggests that the relationship between the level of spending per student and student performance is non-linear, with any positive relationship weakening at higher levels of spending.

For countries with low education spending such as Colombia and Mexico, raising spending per student to the median OECD would boost PISA scores by between 25 and 30 points. For those countries, productivity gains could reach between 4.0 and 4.5%.

Education as a transmission channel between inequality and growth

At the country level, the links between growth and income inequality are complex, with causation running in both directions and a range of published empirical findings (Cerra et al.,2021). However, a number of recent studies using cross-country data (Guillemette et al, 2017; Cingano, 2014), all suggest a negative effect of inequality on growth, with macroeconomic effects that are often very large.

The recent work suggests that human capital is an important channel by which reduced inequality is transformed into a higher growth performance. Based on the most recently available data, the new analysis suggests that if countries with the highest levels of inequality, measured by the Gini coefficient, such as Colombia, Costa-Rica and Mexico moved towards the OECD median, the expected gains in average PISA scores would be between 30 and 40 points, which if sustained could raise long-run aggregate productivity by 4% to 6%.

Other policies

Other education policies could generate large effects on the performance of individual pupils or schools, although the overall macroeconomic gains are much less important than the ones from the policies considered above. These include:

  • Enhancing teacher quality by elevating the share of teachers with master’s degree from the lowest shares (in Chile, Colombia or Denmark) to the OECD median, would be translated into productivity gains of around 1.8%.
  • Reducing the share of schools separating students in all subjects or reducing grade repetition to the median OECD would be translated into productivity gains of up to 1.0%.
  • For countries with low accountability rules such as Austria, Belgium or Finland, increasing the share of schools posting achievement data publicly to the upper quartile would be associated with long-run productivity gains of 0.3%.
Figure 1. Aggregate productivity gains from policy reforms and reduced inequality
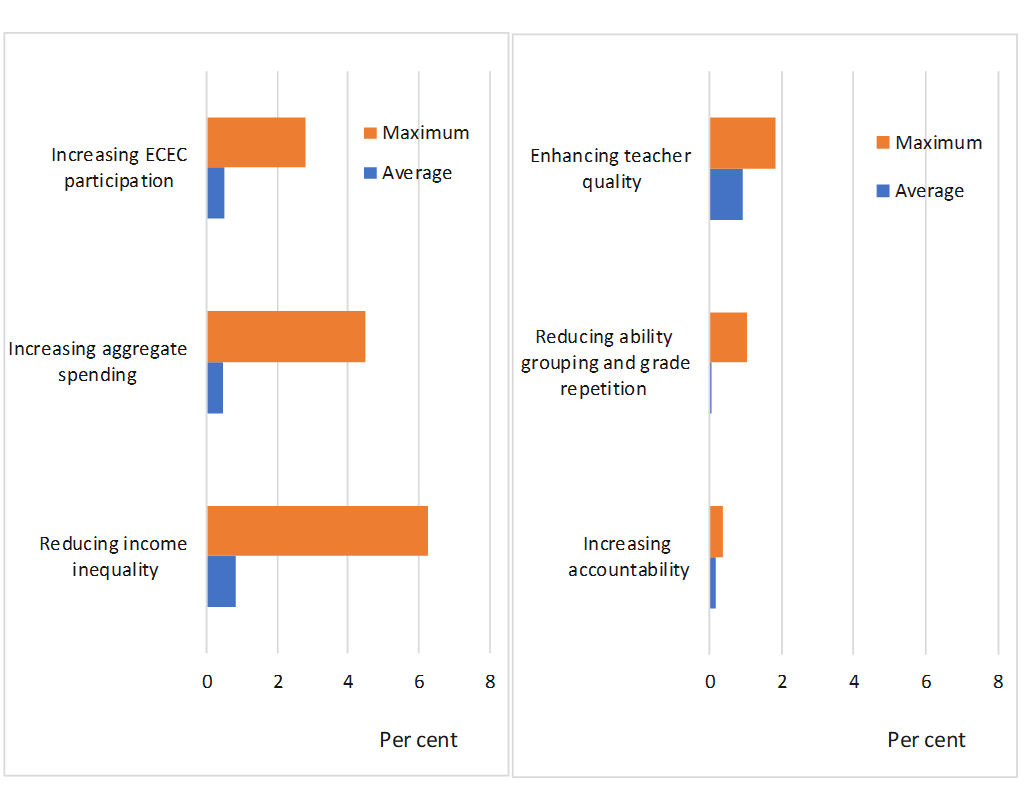
Note: This chart summarises the scenario analysis performed in Égert et al. (2023). For most scenarios, low performing countries are expected to converge to the median OECD except for teacher quality and accountability where low performing countries are expected to converge to the upper quartile.

References

Braga, M., D., Checchi and E. Meschi, (2013), “Educational policies in a long-run perspective“, Economic Policy, 28 (73), 45–100.

Cerra, V., R. Lama and N. Loayza (2021), “Links between growth, inequality and poverty: A survey, IMF Working Paper No.WP/21/68.

Cingano, F. (2014), “Trends in Income Inequality and its Impact on Economic Growth”, OECD Social, Employment and Migration Working Papers No. 163, OECD Publishing, Paris.

Égert, B., C. de la Maisonneuve and D. Turner (2023), “Quantifying the effect of policies to promote educational performance on macroeconomic productivity”, OECD Economics Department Working Papers, No. 1781.

Guillemette, Y., A. Kopoin, D. Turner and A. De Mauro (2017), “A revised approach to productivity convergence in long-term scenarios“, OECD Economics Department Working Papers No. 1385.

Heckman, J. J., R. Pinto and P. Savelyev (2013), “Understanding the Mechanisms, through which an Influential Early Childhood Program Boosted Adult Outcomes”, American Economic Review, Vol. 103 (6), pp. 2052-66.

OECD (2022), Using school funding to achieve both efficiency and equity in education, Chapter 4 in: Value for Money in School Education: Smart Investments Outcomes, Equal Opportunities, OECD Publishing, Paris.

Phillips, D. A. et al. (2017), Puzzling It Out: The Current State of Scientific Knowledge on Pre-Kindergarten Effects A Consensus Statement, Brookings, consensus-statement_final.pdf (brookings.edu)

Smidova, Z. (2019), “Educational Outcomes: A Literature Review of Policy Drivers from a Macroeconomic Perspective”, OECD Economics Department Working Papers, No. 1577.


Enhancing independent fiscal institutions in Latin America: a roadmap based on practical lessons from OECD countries

by Aida CalderaPaula GardaAlberto Gonzalez-Pandiella, Alessandro Maravalle and Elena Vidal, OECD Economics Department

The number of independent fiscal institutions (IFIs) across OECD countries has significantly grown in the last decade, following the global financial crisis. The experience of Latin America countries is more recent and mixed. While some countries, such as Peru or Chile, have well-functioning IFIs, others have less developed institutions and are actively exploring ways to reinforce or establish IFIs.

Strengthening IFIs in Latin American economies could be very beneficial at the current juncture. In most cases, these economies emerged from the COVID-19 crisis with higher government debt as a percentage of GDP and limited fiscal space (Arnold et al. 2023). Strong IFIs can play a pivotal role by fostering  fiscal sustainability and enhancing credibility of fiscal policies and support the effective implementation of medium-term fiscal frameworks (Caldera et al. 2024). Evidence from OECD and EU countries suggests that well-functioning IFIs are associated with higher forecasting accuracy, better compliance with fiscal rules and reductions of fiscal deficits. Ultimately, this can facilitate countries  access to international financial markets at lower borrowing costs, a valuable prospect in a higher-for-longer interest rate environment.

Our recent paper reviews the diverse experience of OECD countries in establishing and running independent fiscal institutions with the aim of drawing practical insights and establishing a roadmap for Latin American countries. There is a large heterogeneity among OECD countries in the way IFIs are designed and establishing a set of stylised facts about alternative IFIs designs can help to identify good examples and best practices. With that aim, the paper identifies, through cluster analysis, different types of independent fiscal institutions based on their functions and resources (Figure 1). The paper supplements the cluster-analysis with cases studies from Chile, Spain and Korea and with the OECD Principles for Independent Fiscal Institutions to guide the set-up and strengthening of IFIs in the region.

Figure 1. OECD IFIs can be categorized into four groups according to their functions and staff size

Note: The cluster plot reports the projections of original data over the two largest eigenvectors, respectively the x-axis and the y-axis, which explain most of the total variance of the data.
Source: Authors’ calculation.

The analysis in the paper suggests that a road map towards independent fiscal institutions in Latin America could have the following key features:

1. Prioritize Legal and Financial Independence. They are crucial to ensure the IFI resilience in the face of policy uncertainty. Defining IFIs in national legislation with clearly specified tasks and functional autonomy is vital, but IFIs can still find difficulties in ensuring funding and recruiting staff. A clear definition of the IFI’s mandate in higher-level legislation, establishing their tasks and degree of functional autonomy, namely in terms of funding and recruitment policy, can provide IFIs with the necessary financial and statutory independence. An example of best practice is the Fiscal responsibility Act in Ireland, which sets in legislation the budget of the Fiscal Advisory Council and grants it full recruiting powers.

2. Bolster Leadership Selection and Expertise. Legislation should also specify leadership expertise and include clear guidelines for appointment, including technical requirements and term length for the president of the fiscal council, which would help to guarantee leadership independence. Making the president position a full-time position and making its appointment conditional on a qualified majority in Parliament (such as in the Slovak Republic or Portugal) also helps to strengthen independence.

3. Tailor IFIs’ Mandates to Local Needs and Resources.  An IFI should be established with a legal broad mandate and sufficient resources that would make it possible to fulfil its functions. Initially an IFI could be small and perform a limited set of functions, those requiring fewer resources according to its budget (e.g., monitoring of fiscal rules, assessment of government economic and/or fiscal forecasts, undertaking long term sustainability analysis). Over time and after gaining a solid reputation, the IFI could assume gradually more functions as it grows in financial and human resources, such as policy costing and producing macroeconomic and fiscal forecasts. This approach was successfully adopted in the Netherlands.

4. Ensure Timely Access to Information. This is often quoted as a key barrier for IFIs to perform its duties in the case studies in the paper. A good practice is to specify in legislation that the IFI should have access to information to fulfil its function. Reinforcing this requirement with the signature of memorandums of understanding with relevant institutions has been found to be very effective (e.g. in Luxembourg and the Netherlands).

5. Emphasize Communication Efforts. Public visibility and effective communication are essential for IFIs’ operational independence and effectiveness. Proactive engagement with the media, independent of government intermediation, can enhance an IFI’s reputation and credibility. IFIs could also formally commit to participating in parliamentary hearings, cultivating strong ties with Parliament, and proactively engaging with different parliamentary groups. OECD IFIs practical experiences reveal that planning and resourcing since the set-up of an IFIs the appropriate tools to communicate in an easy and understandable way to non-experts, the Parliament and the broad public is key to influence the public debate and promote sound fiscal policies, build a strong reputation and gain de-facto independence.

6. Invest in Technical Capacities. High-quality and independent technical capacities are essential to build reputation and ensure accurate and transparent fiscal analysis. Staff training, recruitment of experts, and cooperation with international organisations are effective ways to enhance these capacities. When IFIs are young and have few resources, they can build institutional cooperation with non-political bodies recognized for high-quality analysis, such as Central Banks or academic and research institutions.

References:

Caldera et al. (2024), “Independent Fiscal Institutions: a typology of OECD institutions and a roadmap for Latin America”, OECD Economics Department Working Papers N. 1789.


Restoring growth and tackling public debt in Italy

by Cyrille Schwellnus

Italy has weathered recent crises well, but growth is now slowing amid tightening financial conditions. Public debt remains among the highest in the OECD, limiting the space for continued fiscal policy support. The 2024 OECD Survey of Italy discusses fiscal and structural reforms to tackle high public debt and restore growth.

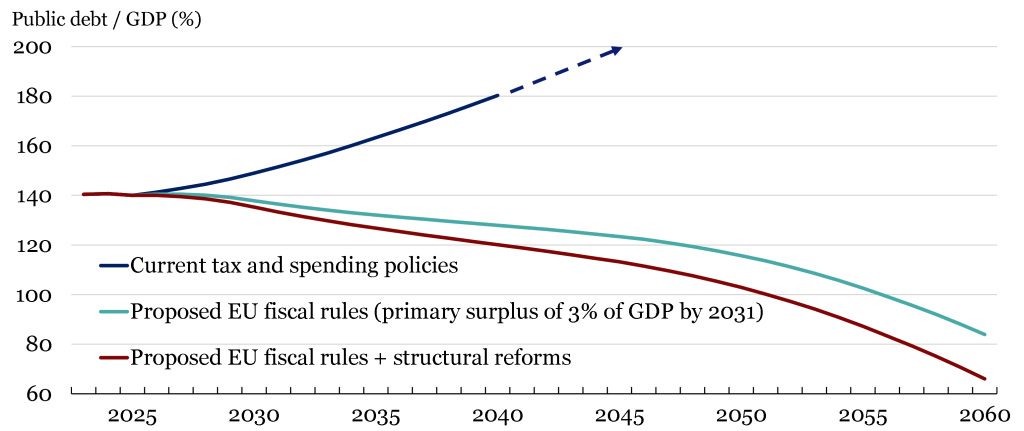
Under current tax and spending policies, public debt is on an upward trajectory (Figure 1). Over 2024-40, spending on pensions, health and long-term care is projected to increase by about 2½ percent of GDP and debt servicing costs could rise by 2% of GDP if interest rates remain high.

A sustained fiscal adjustment will be required over several years to put the debt ratio on a more prudent path, meet future costs and comply with proposed EU fiscal rules. Decisively tackling tax evasion, including of value added taxes, and limiting costly tax expenditures, for instance by limiting the coverage of the dependent spouse deduction, would help. The property tax base needs to be updated. Strengthening the ambition of spending reviews and reducing the generosity of pensions for higher-income households could address spending pressures, while maintaining adequate public services and social protection.

Figure 1: Reforms are required to ensure fiscal sustainability

Note: Ratio of public debt to GDP in percent of GDP. The scenario “Current tax and spending policies” assumes current tax and spending policies, accounting for announced changes in 2025. The scenario “Proposed EU fiscal rules” is based on a stylised simulation of new EU fiscal rules, which results in a primary budget surplus of around 3% of GDP in 2031. The scenario “Proposed EU fiscal rules + structural reforms” assumes the additional implementation of structural reforms in the areas of competition, civil justice, public administration and labour markets.
Source: OECD calculations based on OECD Economic Outlook database and OECD Long-Term Model.


The revised National Recovery and Resilience Plan (NRRP), largely financed by Next Generation EU (NGEU) funds, is an ambitious package of structural reforms, as well as a major ramp-up in public investment. This will support demand in the near term and boost growth over the next years. But, potential output growth is estimated around 1% and will decline further due to rapid population ageing unless productivity growth is lifted and labour market participation is enhanced. The transition to an innovation-led high-productivity growth model has been hindered by inefficiencies in the justice system and the public administration, weak competition in services, sub-par workforce skills and a rigid labour market.

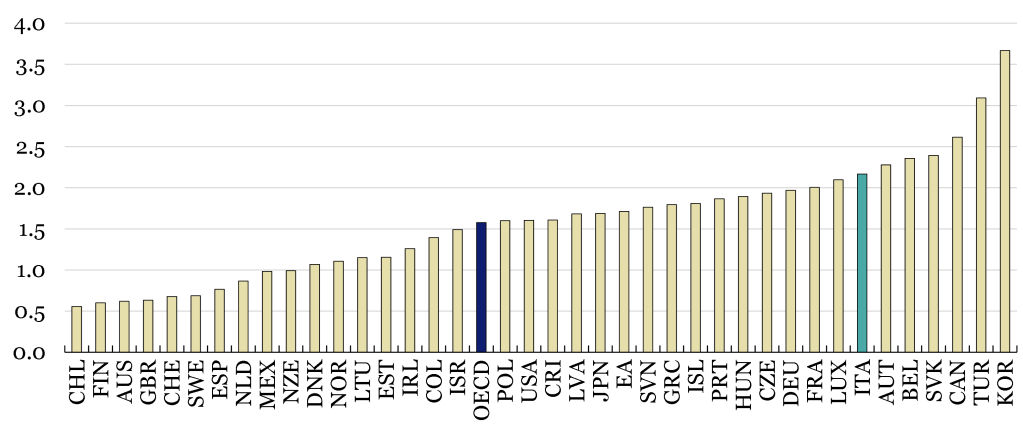
Strengthening competition, especially in professional services (Figure 2), would boost productivity and lower prices. New “fair compensation” rules risk being perceived as minimum tariffs and should be re-examined. Continuing to improve the effectiveness of the public administration, including by expanding the hiring of specialised personnel and strengthening training and performance incentives, would help to implement the public investment projects in the NRRP that are critical to raise long-term growth. Bringing more women into the labour force by promoting public early childcare education and strengthening incentives for paternity leave would support employment growth in the face of a shrinking working-age population.

Figure 2: Regulatory barriers to competition in professional services should be lifted

0-6 in ascending order of restrictiveness, 2018

Note: Product market regulation indicators, professional services, 0-6 in ascending order of restrictiveness, 2018. The preliminary 2023 Product Market Regulation data suggest that regulation of professional services in Italy remains among the most restrictive in the OECD.
Source: OECD 2018 PMR database.


Significant progress in emissions reduction was made in the wake of the global economic crisis of 2008-09, but additional policy efforts are now needed to meet emissions reduction targets. Excise taxes could be better aligned with the carbon content of consumption, as foreseen by the ongoing tax reform. Authorisation procedures for renewable energy investments and the expansion of the electricity grid could be simplified. Continuing the strengthening of public transport and the regional train network, as well as updating the system of car purchase and scrapping incentives, would help reduce vehicle emissions. Further reforming the system of tax incentives for energy efficiency home improvements – which in the form of the so-called Superbonus generated large fiscal costs in the past – would improve value for money.

References

OECD (2024), OECD Economic Surveys: Italy 2024, OECD Publishing, Paris.


Navigating changing demand in skills in Denmark through the demographic, digital and green transitions

By Jonathan Smith, OECD Economic Department

Denmark has for many years enjoyed a well-functioning labour market. Employment levels have reached new record highs and participation rates have risen over the past decade even for those groups with historically low attachments to the labour market. However, the demographic, digital and green transitions are rapidly transforming jobs and skills requirements.

These transitions can represent an opportunity. Denmark is already well advanced in the adoption of digital technologies and outsourcing its low value-added activities. But, it can also challenge the well-functioning labour market and complicate the matching between the supply and demand for workers. This is already visible in the chronic labour shortages prevalent in areas directly affected by these mega trends, notably ICT, engineering, and long-term care.  

This fast transformation calls for agile labour and education policies as persistent labour shortages hold back productivity. As highlighted in the latest Economic Survey of Denmark, three areas could assist in this transformation: (1) increasing the take-up of science, technology, engineering, and mathematics (STEM) education among girls; (2) making vocational education more attractive; and (3) increasing efforts to widen the recruitment pool in long-term care.

Increasing the take-up of STEM education by girls

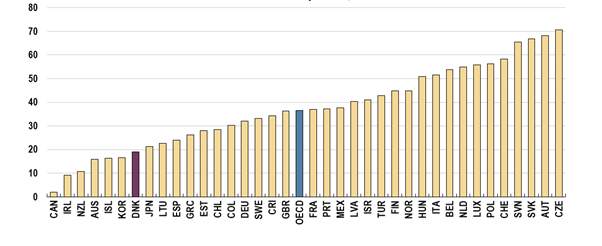
Denmark has a relatively low number of STEM graduates compared to peer countries like Sweden, Finland and Germany. Danish girls are particularly unlikely to choose STEM subjects. While gender gaps are generally low in Denmark, there are significant imbalances in STEM (Figure 1). This in part reflects a general trend of occupational gender segregation in Denmark – acknowledged in Denmark’s 2023 action plan on gender equality – and it contributes to the already low number of Danish STEM graduates in a field where demand is high and rising.

Studies suggest segregation occurs early in life, so providing girls with the opportunity to interact with STEM from an early age is key. Plans to introduce a new subject into early schooling called “understanding of technology” moves in the right direction, but Denmark must implement a broad approach. This includes teacher training and increased awareness of internalised beliefs, outreach activities to tackle gender biases, and showcasing female role models to counter underlying stereotypes.

Figure 1:  Difference in the share of tertiary graduates in STEM between males and females

Note: STEM (science, technology, engineering, and mathematics).
Source: OECD Education at a Glance database.

Improving attractiveness of vocational education

Vocational education and training (VET) will play a key role in providing the skills needed for the low-carbon transition. In Denmark, green activities employ 10% more vocationally trained staff than the average. Yet, the share of young upper secondary students enrolled in vocational programmes is relatively low (Figure 2) and declining over the past decade. Denmark must make vocational tracks more attractive.

While the Danish VET system is well developed, it suffers from an image problem, particularly among younger students. First, age gaps between students are large – those that do choose VET straight from lower secondary school are often mixed with adult VET students – and this leads to a lack of social community. Creating an exclusive pathway for those straight out of lower secondary school, as proposed by the Danish Reform Commission, would help. Second, many Danish young students see VET as a one-way street as it mostly closes the door to academic tracks in the future. This lack of mobility between academic and vocational tracks drives people away from VET. Denmark should consider developing programmes across tracks, something that has been implemented in Flanders.

Figure 2: Share of upper secondary students enrolled in vocational programmes

% of 15-19 year olds, 2021

Source: OECD Education at a Glance database.

Expanding the recruitment pool in the long-term care sector

The ageing population is putting increasing pressure on the Danish long-term care sector. Estimates suggest Denmark will need around 50% more care workers by 2040 just to keep the current ratio of caregivers to the elderly population constant and maintain high standards of care. But, staff attrition rates are high and enrolment in social and health education programmes are below required levels.

While pay and working conditions need to improve – Danish care workers should benefit from a DKK 6.8 billion package of pay-related measures for the public sector recently agreed as part of the tripartite negotiations – efforts must be made to widen recruitment from beyond the traditional pool of predominately Danish female workers. Denmark has one of the lowest shares of foreign-born care workers in the OECD and relaxing criteria for work permits in this area could expand recruitment. Care work also suffers from a stigmatised image among men, therefore enhanced efforts are required to change gender stereotypes, such as through public awareness campaigns and targeted training programmes.

References

OECD (2024), OECD Economic Surveys: Denmark 2024, OECD Publishing, Paris, https://doi.org/10.1787/d5c6f307-en


Addressing high public debt: selective expenditure restraint matters

By Álvaro Pina, Mauricio Hitschfeld and Martin Borowiecki, OECD Economics Department

In dealing with significant fiscal challenges posed by ageing and the climate transition and the risk of rising future debt burdens, countries can draw on the lessons from past episodes of large and sustained reductions in debt-to-GDP. Work in the November 2023 OECD Economic Outlook found that there have been 34 sustained debt reduction episodes in OECD countries since the late 1970s, with 25 countries having experienced at least one such episode during this time. Reductions in the debt-to-GDP ratio have mainly hinged on achieving and sustaining a primary surplus over several years, largely via expenditure restraint, as well as favourable cyclical conditions and low interest rates. Expenditure restraint has often been accompanied by growth-friendly shifts in the composition of public spending.

What has made debt-to-GDP ratios fall?

Debt reduction episodes are defined as ones that persist for a minimum of five years and bring down the gross debt-to-GDP ratio by at least 10 percentage points. All episodes start in the year after the debt ratio peaks and end when the debt-to-GDP ratio bottoms out. The analysis spans from the late 1970s to 2019, though data availability is limited for some countries.

Accounting decompositions of changes in the debt-to-GDP ratio typically consider three components (Rawdanowicz et al., 2021): the primary balance-to-GDP ratio (hereafter the “primary balance”), the interaction of debt and the differential between interest rates and GDP growth (the so‑called “snowball effect”), and a residual stock-flow adjustment that summarises changes in gross debt unaccounted for by the budget balance. In turn, the average primary balance over each debt reduction episode can be decomposed into the initial balance when the debt ratio peaks and the average primary balance change over the length of the episode relative to the initial balance. Likewise, the aggregate snowball effect can be split to show separate impacts from real interest rates (with inflation measured by the GDP deflator) and real GDP growth.

The final decomposition of each debt reduction episode is shown in Figure 1. This highlights two key factors:

  • In all but three episodes the primary balance is on average in surplus, helping to reduce the debt ratio. In around 80% of the episodes, this is due to improvements in the primary balance during the episode itself.
  • In about two thirds of the episodes, and in all but one of the 14 episodes that have begun since the year 2000, the snowball effect contributes positively to the debt reduction. Cyclical conditions have almost always improved relative to those when the debt ratio peaked, and the real interest rate has often been only marginally positive or even negative. 

Figure 1. Decomposition of the average annual change in the debt-to-GDP ratio during debt reduction episodes

Note: Episodes are ordered chronologically by starting year. See Annex 1.B. in OECD (2023) for further details.
Source: OECD Economic Outlook 113 database; and OECD calculations.


Expenditure restraint and shifts in the composition of public spending

Improvements in the primary balance during debt reduction episodes have mainly occurred due to declines in the primary expenditure-to-GDP ratio. This has taken place in over 80% of the 34 episodes considered. In contrast, the primary revenue-to-GDP ratio has risen in fewer than half of the episodes, mostly for ones that began in the 1980s and 1990s.

Expenditure restraint has often been accompanied, and likely made more sustainable, by relatively growth-friendly shifts in expenditure composition. Public investment as a share of GDP declined in about two-thirds of the episodes (23 out of 34; Figure 2), but these declines were often smaller than declines in other expenditure items, in contrast to the large public investment cuts often seen in consolidation episodes (Pina, 2016). Spending on education, health and family and children, generally regarded as growth- and equity‑friendly (Cournède et al., 2014; Fournier and Johansson, 2016), has generally been better preserved than spending on pensions and the bulk of non-education, non-health wages and intermediate consumption. Declines in the GDP share of the remainder of public expenditure, including subsidies, unemployment, sickness and disability benefits, other current transfers, and capital transfers have typically been the largest factor behind spending restraint. Many of these items are not growth-enhancing, though some can be very important for poorer households.

A positive differential between GDP growth and interest rates cannot be relied upon to decrease the debt-to-GDP ratio in the coming years, and attaining primary surpluses via expenditure restraint may prove difficult (Arslanalp and Eichengreen, 2023). This reflects the multiple future spending pressures governments face. Reductions in the debt ratio may thus be harder to achieve in the coming decade than in the past. However, past debt reduction episodes illustrate that it is possible to make significant savings in spending items which often harm growth, such as subsidies and certain transfers. In the current context, where the composition of public expenditure needs to change to address new challenges, that lesson remains highly relevant. However, such changes need to be accompanied by improvements to the overall targeting and design of spending programmes to maintain support for those who need it most.

Figure 2. Growth-friendly expenditure has typically been spared during debt reduction episodes

Changes in ratios to GDP, percentage points, average over each debt reduction episode

Note: The chart decomposes the average annual change in primary expenditure as a share of GDP over the length of each episode relative to its initial value into several expenditure components as defined in the OECD Public Finance Dataset (Bloch et al., 2016). In some earlier episodes not all components can be identified due to data limitations. Episodes are ordered chronologically by starting year. See Annex 1.B. in OECD (2023) for further details.
Source: OECD Economic Outlook 113 database; OECD Public Finance Dataset; and OECD calculations.


References

Arslanalp, S. and B. Eichengreen (2023), “Living with High Public Debt”, paper presented to Jackson Hole Conference, August 2023.

Bloch, D., Fournier, J.-M, D. Gonçalves and Á. Pina (2016), “Trends in Public Finance: Insights from a New Detailed Dataset”, OECD Economics Department Working Papers, No. 1345, OECD Publishing, Paris, https://doi.org/10.1787/4d3d8b25-en.

Cournède, B., A. Goujard and Á. Pina (2014), “Reconciling Fiscal Consolidation with Growth and Equity”, OECD Journal: Economic Studies, vol. 2013/1, https://doi.org/10.1787/eco_studies-2013-5jzb44vzbkhd.

Fournier, J. and Å. Johansson (2016), “The Effect of the Size and the Mix of Public Spending on Growth and Inequality”, OECD Economics Department Working Papers, No. 1344, OECD Publishing, Paris, https://doi.org/10.1787/f99f6b36-en.

OECD (2023), OECD Economic Outlook, November 2023, https://doi.org/10.1787/7a5f73ce-en.

Pina, Á. (2016), “Making Public Finances More Growth and Equity-friendly in the Euro Area”, OECD Economics Department Working Papers, No. 1316, OECD Publishing, Paris, https://doi.org/10.1787/5jlv2jgl4kbr-en.

Rawdanowicz, Ł., Turban, S., Haas, J., D. Crowe and V. Millot (2021), “Constraints and Demands on Public Finances: Considerations of Resilient Fiscal Policy”, OECD Economics Department Working Papers, No. 1694, OECD Publishing, Paris, https://doi.org/10.1787/602500be-en.


New long-run scenarios: A path to offset CO2 mitigation costs

by Yvan Guillemette, OECD Economics Department

Every 2-3 years, the OECD Economics Department publishes a set of country-level economic scenarios to 2060 to quantify some of the most important long-term macroeconomic trends and policy challenges facing the global economy. The latest update includes the standard ‘business-as-usual’ scenario, in which no major reforms to government programmes are undertaken and progress on energy efficiency and energy decarbonisation continues along recent trends. For the first time, the update also describes a stylised scenario in which OECD and non-OECD G20 economies successfully transition to low-carbon energy in a way broadly consistent with a net-zero target for greenhouse gas emissions by 2050. While this represents a negative supply shock to all economies, the upshot of the analysis is that fiscal and structural reforms could fully offset the output costs associated with mitigation efforts over the first 10 years of the energy transition.

In the baseline scenario, global CO2 emissions from energy use remain around current levels, a trajectory incompatible with the UN Paris Agreement’s ambition of limiting warming to 1.5°C. This failure occurs despite trend annual real GDP growth for the combined OECD+G20 area gradually declining from around 3% pre-COVID to 1.7% by 2060, mainly due to falling working-age population growth and a deceleration of trend labour efficiency growth in emerging-market economies. China and India continue to account for most of global growth, with India’s contribution surpassing China’s in the late-2030s.

Figure 1. The baseline scenario in a snapshot

Note: ‘G20 advanced’ includes Australia, Canada, Germany, France, the United Kingdom, Italy, Japan, Korea and the United States. ‘G20 emerging’ includes Argentina, Brazil, China, India, Indonesia, Mexico, Russia, Saudi Arabia, Türkiye and South Africa. The OECD+G20 aggregate includes all OECD and non-OECD G20 countries.


In per capita terms, growth in the OECD area remains stable, around 1½ per cent per annum, below historical norms. Real GDP per capita growth is projected to slow in most of the G20 emerging-market economies, except those where recent performance has been relatively weak (including Argentina, Brazil and South Africa).

In the energy transition scenario, all countries accelerate their CO2 mitigation efforts as of 2026, eliminating coal as an energy source by 2050 and lowering oil and gas shares in total energy supply to 5% and 10%, respectively. Abstracting from gains due to avoidance of environmental damages, this acceleration of the energy transition leads to a reallocation of resources that impact GDP negatively. Global growth slows by 0.2 pp per annum initially relative to the baseline scenario, and by 0.6 pp toward the end of the transition period. The slowdown is more modest in the OECD area, but sharper in the G20 emerging-market area given higher carbon intensity.

An increase in carbon taxation sufficient to bring about the transition could bring in around 3¼ per cent of GDP in additional government revenue in the OECD area over the 2026-2030 period. In the basic energy transition scenario, this extra revenue is channelled back to households as a direct transfer. However, an alternative scenario assesses a tax shift strategy in which revenue from higher carbon pricing is used to lower the tax burden on labour (labour tax wedges). Dynamics are important here because revenue from carbon pricing first rises, but later declines along with CO2 emissions, implying that tax wedges could be lowered, but would eventually have to rise again. Nevertheless, because higher carbon pricing is politically awkward to implement, the tax shift strategy could facilitate the phasing in of higher carbon taxes, allowing at least the initial part of the energy transition to benefit from the greater efficiency of a price-induced transition.

Via positive effects on employment, this tax shift strategy is shown to fully offset the decline in output otherwise associated with the first 10 years of the energy transition, leaving living standards in 2035 higher than in the baseline scenario in the OECD area and most individual countries. At peak impact around 2035, the euro area and OECD aggregate employment rates are around 1½ pp higher than without the tax shift.

Figure 2. Shifting tax burden from labour to carbon offsets most transition costs to 2035
Level of potential output in 2035, % difference between scenarios (see legend and note)

Note: Blue bars show the % difference in the level of output in 2035 in an energy transition scenario with carbon revenue rebated as lump sums versus the baseline scenario. Orange bars show the % difference in the level of output in 2035 in an energy transition scenario with carbon revenue used to lower tax wedges versus when it is rebated as lump sums. Diamonds show the % difference in the level of output in 2035 in an energy transition scenario with carbon revenue used to lower tax wedges versus the baseline scenario, which corresponds to the sum of blue and orange bars. Chile, Colombia, Costa Rica, Mexico, Norway and Türkiye are not shown as these countries do not have a fiscal block in the OECD Global Long-Term Model.

Additional scenarios show that deploying the extra revenue into a combination of higher R&D expenditure and support for childcare would have similar effects. Other structural reforms, such as product market liberalisation and improvements in governance could also help to offset the output costs of CO2 mitigation.

Reference

Guillemette, Y. and J. Chateau (2023), “Long-term scenarios update: incorporating the energy transition”, OECD Economic Policy Papers, No. 33, OECD Publishing, Paris, https://doi.org/10.1787/153ab87c-en


Doombot Recession Outlook

Doombot robot made of blocks

by Thomas Chalaux and Dave Turner, OECD Economics Department

Macroeconomic forecasters make their biggest errors because of a failure to predict future recessions.[1] The problems of predicting the timing of cyclical turning points or future shocks can, however, be mitigated by a prescient discussion of risks surrounding the central published forecast. For example, the recently published OECD Economic Outlook, warns “[T]he unusually fast and large-scale tightening of monetary policy … could continue to expose vulnerabilities among households, firms, financial market participants and countries”, so that “[O]verall, the risks to the projections remain skewed to the downside”. Recent work at the OECD attempts to take such risk assessments further by quantifying the probability of a future recession (Chalaux and Turner, 2023).

An algorithm, “DoomBot”, selects parsimonious models to predict recessions over different quarterly horizons covering the ensuing two years for 20 OECD countries. The models are country- and horizon-specific and are automatically updated as the estimation sample period is extended, so facilitating out-of-sample evaluation of the algorithm. A limited combination of explanatory variables is chosen from a much larger pool of potential variables that include those that have been most useful in predicting downturns in previous OECD work. The most frequently selected variables are financial variables, especially those relating to credit and house prices, but also include equity prices and various measures of interest rates (such as the slope of the yield curve). Business cycle variables — survey measure of capacity utilisation, industrial production, GDP and unemployment — are also selected, but more frequently at short horizons. The variables selected do not just relate to the domestic economy of the country being considered, but also international aggregates, consistent with findings from previous OECD work.

Looking at the performance of the algorithm over past episodes, the models provide a clear out-of-sample early warning of the Global Financial Crisis (Figure 1, LHS panel). The models are less good at predicting the euro area crisis out-of-sample, but it is clear from the evolution of the choice of variables that the algorithm learns from this episode, for example through the more frequent selection of a variable measuring euro area sovereign bond spreads.

Figure 1. Distribution of recession probabilities among 20 OECD countries

Comparing Doombot projections made in June 2008 and December 2023

Note: The box and whiskers chart shows the distribution of recession probabilities among a sample of 20 OECD countries according to out-of-sample probit model predictions made using the DoomBot algorithm. The LHS panel shows the out-of-sample predictions using information available at the time of the publication of the June 2008 Economic Outlook, whereas the RHS panel shows the current predictions made with the latest available data. The box shows the inter-quartile range for the 20 countries; the whiskers the extremes; the X is the simple average; and the horizontal bar is the median.

Recession risks to the current outlook

The latest Doombot predictions suggest that the probability of recessions among OECD countries is much lower than prior to the GFC (comparing RHS and LHS panels of Figure 1), although it still remains quite high in historical context, especially over the coming year and among European countries:

  • There are 5 European countries — Germany, France, Finland, Portugal and Sweden – where recession probabilities exceed 50% in two consecutive quarters over the next year and a further four —  the United Kingdom, Italy, Switzerland and Belgium — where they exceed 25%. The main driver in most of these cases is the turning of the house price cycle, often supplemented by weak signals from activity variables.

  • For Japan, recession risks for the first two quarters have risen above 25%, partly because of the rise in oil prices. Although oil prices enter into many other country risk models, Japan seems particularly vulnerable in this respect. For Canada, recession risks reach 25% in coming quarters driven by weak survey measures of capacity utilisation and a negative yield curve slope.

  • For the United States, risks of a recession in 2024 appear to be small; there is no warning signal from share prices or survey measures of capacity utilisation that usually pick up weakness at short horizons, and the slope of the yield curve (a popular signal of recession risks) has recently become less negative. The turning of the house price cycle suggests recession risks increase in 2025, although the models are less reliable at longer horizons.

References

An, Z., J. Jalles and P. Loungani (2018), “ How well do economists forecast recessions?”, IMF Working paper, WP/18/39.

Turner, D., T. Chalaux and H. Morgavi (2018), “Fan charts around GDP projections based on probit models of downturn risk“, OECD Economics Department Working Papers, No. 1521, OECD Publishing.

Chalaux, T.  and D. Turner (2023) , “Doombot: a machine learning algorithm for predicting downturns in OECD countries“, OECD Economics Department Working Papers, No. 1780, OECD Publishing.


[1] For discussion and evidence of the difficulties in forecasting recessions, see An et al., (2018) and Turner et al. (2018) as well as references therein.


Towards stronger, more inclusive and more sustainable growth in Thailand

By Jens Arnold, Kyongjun Kwak and Kosuke Suzuki, OECD Economics Department

Thailand has achieved remarkable economic and social development since the 1960s. Among countries in Southeast Asia, Thailand was one of the first to open its economy by pursuing an active integration into global value chains and attracting foreign direct investment, which enabled the country to undertake significant investment in infrastructure. Thailand’s manufacturing sector was able to gain a competitive edge, while the tourism industry flourished. Amid continuous growth, Thailand became an upper-middle income country in 2011, according to a commonly used classification by the World Bank.

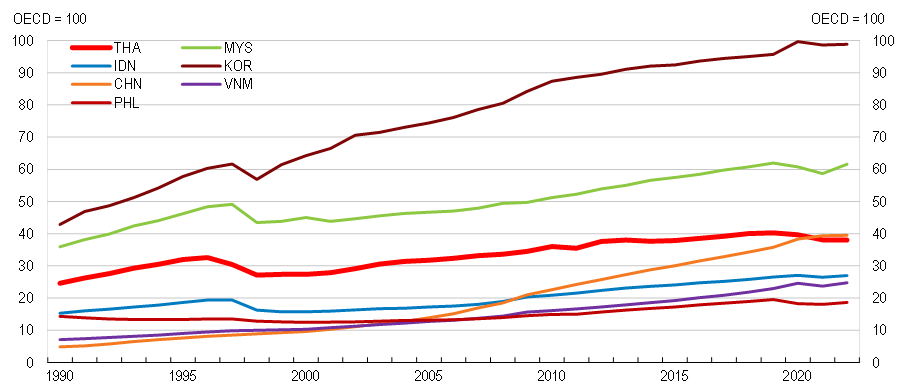
However, Thailand’s growth has been losing momentum over the last decade, as highlighted in the recent edition of the OECD Economic Survey of Thailand (OECD, 2023). GDP per capita has stagnated at the same time as other countries in the region experienced more vigorous growth (Figure 1). The already softer growth momentum was further weakened by the economic fallout from the pandemic, which -among others- severely affected the tourism industry.

Figure 1. After a rapid catch up, income convergence has stagnated since 2013

GDP per capita relative to the OECD average, computed at 2017 USD PPP

Source: World Bank, World Development Indicators database.

Looking ahead, resuming income convergence and achieving more rapid improvements in material living standards will hinge on Thailand’s ability to tackle a number of challenges (OECD, 2023).

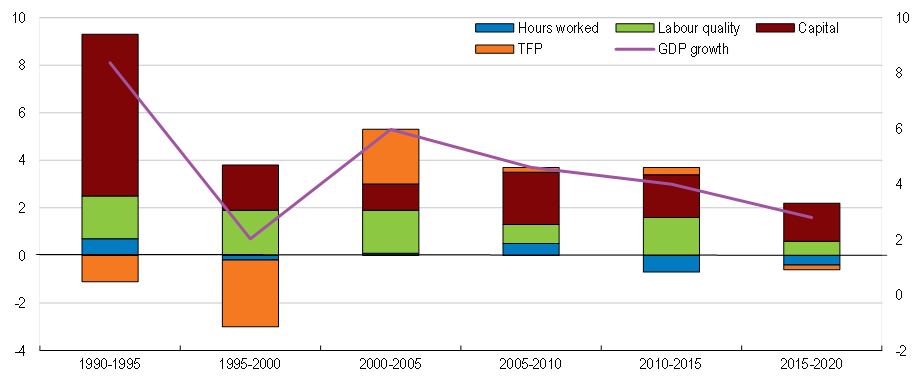
Strengthening competition is one of these challenges, as strong competition is crucial for boosting productivity growth, which has been subdued over the last 20 years (Figure 2). A range of Thai industries are characterised by high concentration and low levels of competition, which tends to foster rigid industry structures in which strong performers find it more difficult to grow at the expense of established low-productivity firms. Thailand ranked 85th out of 141 countries in an indicator about the extent of market dominance elaborated by the World Economic Forum, suggesting that many markets for products and services are dominated by a few players. Analysis based on administrative data of Thai registered firms suggests an increase in market power among Thai firms, which coincided with lower business dynamism (Apaitan et al., 2020). Structural impediments to competition including regulatory constraints have been identified across a wide range of sectors, perhaps most notably in services sectors including telecommunications, energy and retail.

Figure 2. Boosting productivity is crucial to sustain high economic growth

Factors contributing to the Thai GDP growth, annual average, %

Source: Asian Productivity Organisation, APO Productivity database 2022.

Rekindling the convergence process towards higher income levels will also include continuing to attract foreign investment, which has been an engine of growth in the past. Inward FDI stocks still have scope for further increases, including by expanding trade agreements and by relaxing remaining restrictions to foreign direct investment, especially in the particularly restrictive services sector. Based on the OECD FDI Restrictiveness Index, Thailand’s policies are more restrictive than in regional peers, and this holds particularly true for many services sectors. The same regulatory reforms that are required to strengthen competition and enhance the business climate will also be instrumental to attract more FDI.

Boosting growth is one thing, but spreading the fruits of this growth more widely is equally crucial. Income inequality and poverty remain significant concerns, but Thailand has made progress with social protection mechanisms, most of which have been established over the last 25 years.  Over those years, Thailand has strengthened its social safety net and achieved a significant expansion in coverage, including among those not formerly covered by social protection policies. A universal public healthcare system was established in 2002. Income inequality has significantly improved since the 1990s, as evidenced by a substantial decline in the Gini coefficient from 0.44 in 1990 to 0.38 in 2021.

However, Thailand’s social protection instruments are organised in a number of parallel systems, which has led to significant fragmentation. Social security benefits are currently provided to contributing formal-sector employees, but these amount to only 50% of the workforce. Building on past progress, Thailand can do more to reduce poverty and inequality through improvements in social protection. The main challenges for the future will be to achieve fully universal coverage with basic benefits, reconsider benefit adequacy for some benefits and improve the organisation of benefit delivery, ideally moving from a fragmented system to a single system that can deliver different tiers of benefits depending on the specific situation of beneficiaries.

Future growth will also have to become more sustainable. Thailand has pledged to achieve net zero greenhouse gas emissions by 2065, but the success of the green transition will hinge on better policy coordination. Currently, several ministries and agencies are involved in the design of environmental policies and there are different and sometimes overlapping plans, making policy coordination complex. A newly created leading environmental agency is tasked to coordinate the overall green transition strategy and monitor policy progress, but it will require a strong mandate to fulfil this task successfully.

At present, the energy sector is a major source of CO2 emissions. Renewable power generation has advanced but is mostly limited to small-scale producers incentivised by feed-in tariffs. The overall share of renewable energy sources remains lower than in peer countries. More large-scale energy generation from renewable sources through public tenders and renewable energy certificates would help to address rising electricity demand and reduce emissions. That would require reducing private entry restrictions in the retail electricity market.

In addition, an effective carbon pricing mechanism will be key for achieving emission reduction goals. A voluntary emission trading system is in operation, but carbon prices are low compared with OECD countries. Moreover, regulated energy prices, such as a cap on diesel prices, weaken the effect of market prices and fossil-fuel taxes. Stricter environmental regulations should complement carbon pricing. A mix of price-based and regulatory measures is likely to enhance the effectiveness and political viability of mitigation efforts. Stricter air pollution standards could be one way forward, including on coal power plants and internal combustion engine cars.

The recently published OECD Economic Survey of Thailand aims to support the design of policies that can address these challenges and allow Thailand to achieve stronger, more inclusive and more sustainable growth.

References


Creando espacio fiscal y fomentando el crecimiento en América Latina

Jens Arnold, Aida Caldera, Paula Garda, Alberto González Pandiella, Michael Koelle, Alessandro Maravalle, Claudia Ramirez Bulos, Adolfo Rodriguez-Vargas and Elena Vidal, Departamento de Economía, OCDE

El crecimiento económico en América Latina está desacelerándose a medida que las políticas monetarias más restrictivas para combatir la inflación surten efecto y las condiciones externas se tornan menos favorables, de acuerdo con las Perspectivas Económicas de la OCDE recientemente lanzadas. El crecimiento del PIB en 2023 presenta divergencias significativas entre las principales economías. El crecimiento se ha mantenido sólido en Brasil y México, que ha mostrado ser resiliente a la inflación y a tasas de interés elevadas impulsado respectivamente por una cosecha abundante y la fortaleza del consumo privado. Sin embargo, el crecimiento ha sido débil en Argentina, Chile, Colombia y Perú debido a eventos climáticos extremos, a una elevada incertidumbre política y la debilidad de la economía mundial. La inflación sigue en descenso en todos los países, salvo en Argentina, gracias a las rápidas subidas de tipos de interés. La caída de la inflación ha sido más rápida que en otras regiones. De hecho, Brasil, Chile, Costa Rica y Perú ya han comenzado a disminuir sus tasas de política monetaria. En México y Colombia, con inflaciones contenidas, pero aún elevadas, se espera que comiencen a reducir tasas en 2024.

Para 2024 y 2025 persistirá el bajo dinamismo económico en la región, situándose por debajo del crecimiento global (Cuadro 1) y de otras economías emergentes (3.9% y 4.1%). La inflación seguirá cediendo y se proyecta que alcance los objetivos establecidos por los bancos centrales en 2024, antes que la mayoría de los países de la OCDE. Sin embargo, las economías de la región se enfrentan a numerosos riesgos externos e internos. Entre los factores más relevantes se destacan una demanda externa y comercio debilitado y en particular la desaceleración de China, que afecta de manera importante a las economías exportadoras de materias primas como Argentina, Chile, Brasil, Colombia y Perú y la incertidumbre en los mercados financieros internacionales debido a tensiones geopolíticas y la evolución de las políticas monetarias en países avanzados. La inflación podría permanecer en niveles elevados por un tiempo mayor al anticipado. Además, un aumento en la frecuencia e intensidad de eventos climáticos extremos, como la llegada del Niño, podría afectar más de lo previsto a algunas economías particularmente expuestas a ellos.

Cuadro 1. Perspectivas económicas de los pases de América Latina

Nota: América Latina (ALC) es la media ponderada por PIB a paridad de poderes de compra de los 7 países en la tabla para el PIB; y la media simple de los países incluidos en el cuadro para la inflación.
Fuente: OCDE Perspectivas Económicas, noviembre 2023.

En este contexto macroeconómico incierto y volátil, resulta clave asegurar la estabilidad macroeconómica y un crecimiento fuerte.

Momento de enfrentar el desafío fiscal  

Por el lado de la política monetaria, con la inflación decelerando, la discusión se centra en el ritmo de las futuras reducciones de tasas de interés. El objetivo debe ser que las tasas de inflación vuelvan a sus metas de manera duradera, transitando hacia una posición de la política monetaria más neutral. Esto requerirá diferentes ritmos y tiempos en la reducción de tasas, según las particularidades de cada país. El ritmo de normalización deberá considerar cuidadosamente múltiples riesgos, como el impacto de El Niño y los precios del petróleo más altos, y la política monetaria en las economías avanzadas.

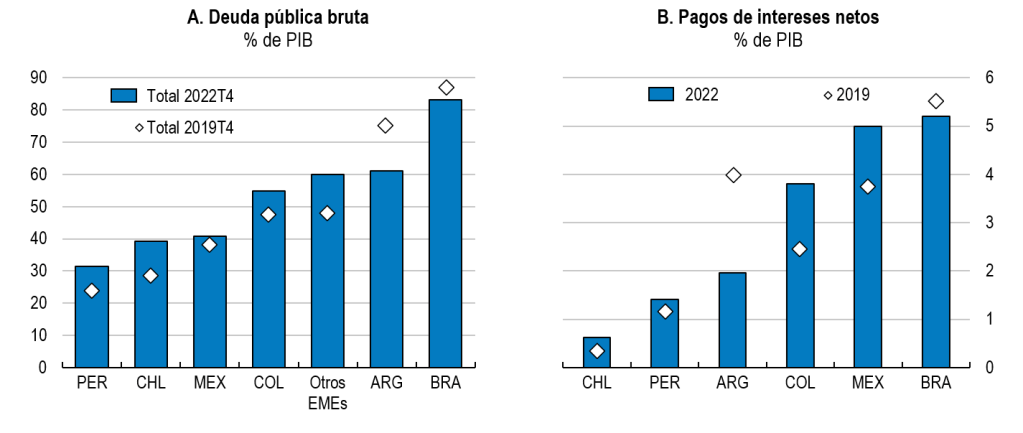
Por su parte, las autoridades fiscales se enfrentan al reto de seguir disminuyendo la deuda pública, que aumentó significativamente después de la pandemia, en un entorno en el que los tipos de interés a largo plazo han aumentado (Gráfico 1). La mayoría de los países ha retirado exitosamente los estímulos fiscales de la pandemia y ha empezado a reducir los déficits, pero enfrentan desafíos significativos dados los altos niveles de deuda, el poco espacio fiscal y el bajo potencial de crecimiento. La consolidación fiscal es un paso necesario para restablecer el margen de maniobra fiscal y evitar los riesgos asociados con elevados niveles de deuda, como pagos de intereses más altos que pueden desplazar los gastos públicos esenciales, especialmente en un contexto internacional de tasas de interés más altas durante más tiempo.

En la mayoría de los casos, los gobiernos de América Latina tienen planes de consolidación fiscal ambiciosos que llevarían a estabilizar la deuda, pero cómo alcanzar estos objetivos es clave. Esto requiere en un primer momento y como prioridad, reforzar los marcos fiscales de mediano plazo para dar una clara y creíble orientación futura sobre cómo se alcanzarán los objetivos fiscales y se reducirá la deuda, basados en proyecciones macroeconómicas y fiscales realistas, al tiempo que se protege la inversión pública, que a menudo es una víctima de la consolidación fiscal en la región. Elementos esenciales son incluir anclas de mediano plazo, como niveles prudentes de deuda, y cláusulas de escape bien definidas con mecanismos de corrección en las reglas fiscales. Se deben fortalecer también los consejos fiscales, dotándolos de independencia legal y de facto, recursos y acceso adecuado a la información, ya que pueden contribuir de forma importante al análisis de la sostenibilidad de las finanzas públicas. Además, superar obstáculos políticos para implementar reformas fiscales que aumenten la eficiencia del gasto, que es baja, y los ingresos tributarios, también bajos en la mayoría de los países de la región, son retos importantes.

El potencial de crecimiento en la región es bajo, lo que limita también el espacio fiscal. Esto hace crucial acelerar las reformas estructurales necesarias desde hace mucho tiempo, y fomentar el consenso necesario para llevarlas a cabo. Impulsar reformas que dinamicen el comercio, que establezcan marcos regulatorios estables para la inversión privada en conectividad, energías renovables y minerales sostenibles, y redoblar esfuerzos para mejorar la calidad de la educación es clave para potenciar la productividad y la inversión. Estas reformas facilitarán la adaptación al cambio climático y la transformación digital, y, al impulsar el crecimiento potencial, contribuirían de manera decisiva a la sostenibilidad fiscal de la región.

Gráfico 1. El incremento en la deuda pública y los pagos de intereses restringen el espacio fiscal

Nota: Panel A: Otras economías de mercados emergentes (EMEs) es el promedio no ponderado de China, Filipinas, India, Indonesia, Malasia, Tailandia, Turquía, y Suráfrica. Panel B: Los datos para Chile se refieren al año 2021 en lugar de 2022.
Fuente: FMI, Base de datos sobre inversores soberanos; Base de datos de Perspectivas Económicas de la OCDE; y FMI, Monitor fiscal, octubre 2023.

Más información:

OECD Economic Outlook, Noviembre 2023– Reporte completo en inglés con las proyecciones macroeconómicas, los principales desafíos estructurales e información detallada por país.

Perspectivas económicas de la OCDE para países de América Latina, Noviembre 2023.

Información detallada por país: Argentina | Brasil | Chile | Colombia | Costa Rica | México | Perú


Institutional shareholding, common ownership and productivity: a cross-country analysis

By Maria Bas1, Lilas Demmou, Guido Franco and Javier Garcia-Bernardo2

The increase in institutional ownership, accompanied by the shift towards passive portfolio management and the rise of common ownership, have transformed OECD countries financial markets in the last decades. These transformations have the potential to influence listed firms’ productivity, given the role of equity owners in allocating private savings across firms and influencing firms’ investment decisions.

Against this backdrop, and relying on a rich firm-level dataset covering financial and granular ownership information on firms across a wide range of countries and sectors, Bas et al. (2023) study the productivity consequences of these changes via two main channels: a “governance channel”, looking at the role of institutional owners’ business model (i.e., investment style, time horizon etc.); and a “common ownership” channel, analysing the productivity impact of simultaneous ownership of shares in competing firms (i.e. intra-industry) or potentially vertically integrated firms (i.e. inter-industry).

The governance channel

The business model of institutional owners has recently been the subject of debate in two main areas. First, institutional investors tend to have higher portfolio turnover rates than corporate owners, potentially inducing a focus on short-term outcomes, while long-term-oriented owners are more likely to support innovative and human capital-intensive projects that yield (productivity) benefits over time. Second, institutional investors increasingly rely on passive investment styles, characterized by reduced monitoring but also increased diversification, which can encourage support for R&D activities by attenuating idiosyncratic risks associated with innovation.

Our main findings suggest, overall, a positive relationship through the governance channel: firms displaying higher institutional ownership tend to have higher productivity levels and growth rates compared to their peers (Figure 1). Consistent with theory, there is some heterogeneity across different types of institutional investors depending on their time horizon and investment style. On the one hand, the positive correlation tends to vanish when institutional investors’ horizon shortens, highlighting the relevance of the provision of patient capital (Figure 1). On the other hand, the correlation appears larger the higher the shares of large, passive and diversified owners, confirming that a diversified portfolio may favour support to innovative investments despite potential lower monitoring.

Figure 1 Institutional ownership and productivity are positively related at the firm-level

Note: Interpreting results as if they were causal, the blue bars represent the average change in firms’ productivity following a 5 p.p. increase in institutional ownership. The orange whiskers indicate the 95% confidence intervals. Source: Bas, Demmou, Franco and Garcia-Bernardo (2023).

The common ownership channel

The consequences of common ownership for firms’ productivity may vary depending on whether it occurs within industries or across industries.

Intra-industry common ownership. Firms operating in the same industry and belonging to the same investor’s portfolio may, in the interest of their common shareholders, compete less intensively on product markets, for instance by colluding more easily, with detrimental consequences for productivity (competition channel). At the same time, intra-industry common ownership could benefit innovation and productivity when inter-firm coordination is explicit (e.g. joint ventures or strategic alliances) and firms find it easier to cooperate in their R&D efforts and share knowledge (cooperation channel). The estimates from the analysis linking intra-sector common ownership and productivity are not always significant (Figure 2, left panel). Still a negative relationship appears to prevail when they are, hinting that the competition channel may slightly outweigh the cooperation channel. The negative association is stronger in innovative sectors, further corroborating the potential existence of a competition channel given that these industries tend to be more concentrated.

Inter-industry common ownership. Common ownership along the value chain may lead to stronger business relationships among vertically integrated firms, (vertical integration / spillover channel), by attenuating hold-up problems when information asymmetries are high. Moreover, from a general equilibrium perspective, the attempt to increase profits through higher prices and lower competition is not immune to a backlash for common owners, as they risk ending up with lower profits in downstream industries due to higher inputs costs. The empirical investigation supports the existence of a positive relationship between inter-industry common ownership and firm-level productivity (Figure 2, right panel). The positive association is again stronger for firms producing in innovative sectors, potentially due to a more efficient network of vertical relationships and technological spillovers, which are particularly relevant in these sectors.

Figure 2 The productivity implications of common ownership depend on whether it occurs intra- or inter-industry

Note: Interpreting results as if they were causal, the blue bars represent the average change in firms’ productivity following an increase in inter (left panel) or intra (right panel) industry common ownership from 0 to the level observed at the 75th percentile of the distribution of the respective firm level common ownership measure. The orange whiskers indicate the 95% confidence intervals. Common ownership is measured as in Azar et al. (2018) and Azar et al. (2021). Source: Bas, Demmou, Franco and Garcia-Bernardo (2023).

References

Azar, J., M. C. Schmalz and I. Tecu, (2018), “Anticompetitive effects of common ownership”, The Journal of Finance, Vol. 73(4): 1513–1565. https://doi.org/10.1111/jofi.12698.

Azar, J., and X. Vives, (2021), “Revisiting the anticompetitive effects of common ownership”, IESE Business School Working Paper. https://dx.doi.org/10.2139/ssrn.3805047.

Bas, M., Demmou, L., Franco, G., Garcia-Bernardo, J. (2023), “Institutional shareholding, common ownership and productivity: A cross-country analysis”, OECD Economics Department Working Paper No 1767, https://doi.org/10.1787/d398e5b4-en.