América Latina: aprovechando oportunidades en un entorno internacional cambiante

Por Jens Arnold, Aida Caldera, Priscilla Fialho, Paula Garda, Alberto González Pandiella, Michael Koelle, Alessandro Maravalle, Tomas Opazo, Claudia Ramírez, Adolfo Rodriguez-Vargas y Elena Vidal, Departamento de Economía, OCDE.

El panorama global ha comenzado a mejorar, aunque el crecimiento sigue siendo modesto según las Perspectivas Económicas de la OCDE (OECD, 2024). Por su parte, en América Latina, el crecimiento económico presenta heterogeneidad. En la mayoría de las economías el crecimiento ha perdido dinamismo debido a condiciones financieras restrictivas, una demanda externa débil y a eventos climáticos extremos. La inflación sigue disminuyendo en el conjunto de la región, aunque en Colombia, y en Argentina, sigue en un nivel elevado, lo que ha permitido que todos los bancos centrales hayan comenzado a disminuir sus tasas de política monetaria.

Las proyecciones macroeconómicas de la OCDE para América Latina señalan un crecimiento modesto para los próximos dos años (Cuadro 1). En 2024, se proyecta que la actividad avance a un ritmo ligeramente menor que en 2023, como resultado de una demanda externa aún débil. Si bien es cierto que se prevé un crecimiento en la región por debajo de la media de la OCDE, con una fuerte contracción en Argentina, algunos países muestran mejores resultados. En Chile y Perú la recuperación de los salarios reales, impulsaran el consumo y junto a la relajación paulatina de la política monetaria, permitirán que el crecimiento del PIB mejore en 2024. En 2025, las perspectivas para la región tienen un tono más positivo, asociado a un mayor crecimiento de la demanda externa, y una menor inflación, ya dentro de los rangos meta de los bancos centrales.

Los riesgos económicos siguen sesgados a la baja en la región. Las tensiones geopolíticas globales y la volatilidad en los mercados financieros globales podrían tener un impacto negativo sobre la región. Por otro lado, una mayor persistencia de la inflación a nivel mundial y en la región, que frenara la bajada de tipos de interés podría mermar también las perspectivas de crecimiento. Los riesgos asociados a los elevados niveles de deuda pública y déficits estructurales, y una alta carga de intereses de la deuda pública, también persisten. Eventos climáticos extremos también pueden impactar las producciones agrícolas de la región y alterar los precios de las materias primas.

Sin embargo, a pesar de estos riesgos y dificultades, el escenario global ofrece un futuro lleno de oportunidades para América Latina. Si los países de la región logran aprovechar sus ventajas frente al resto del mundo, un crecimiento duradero y sostenible es posible.

Cuadro 1. Perspectivas económicas de los países de América Latina

Nota: América Latina 7 es la media ponderada por PIB a paridad de poderes de compra de los 7 países en la tabla para el PIB. América Latina 6 es la media simple de los países incluidos en el cuadro para la inflación excluyendo a Argentina.
Fuente: OCDE Perspectivas Económicas No. 115, mayo de 2024.

Aprovechar las oportunidades

La transición energética se ha acelerado en la mayoría de los países incrementando la demanda de energías renovables. En este contexto, América Latina puede desempeñar un papel determinante en el nuevo sistema energético global. La región está muy bien posicionada para mitigar el cambio climático y ayudar en la transición hacia energías más limpias, gracias a su alto potencial para la generación de energías renovables, y gran riqueza de minerales esenciales para la transición energética (Grafico 1). De hecho, la energía hidroeléctrica ya genera el 60% de la electricidad de la región, el doble de la media mundial (IEA,2023). Por ejemplo, Costa Rica ya ofrece una matriz eléctrica 100% verde y el potencial aún no utilizado de otros países para avanzar en la misma dirección es enorme. Brasil, Chile y Colombia podrían ser exportadores clave de hidrógeno verde en los próximos años. América Latina atesora cerca del 50% de las reservas mundiales de litio, un metal esencial para la fabricación de baterías de vehículos eléctricos. Chile y Perú desempeñan un papel clave en el suministro de otros minerales críticos para la transición energética como el cobre.

Las tensiones geopolíticas están provocando cambios relevantes en las cadenas globales de suministros. Algunas empresas han decidido trasladar partes de sus actividades productivas a países más cercanos geográficamente de los consumidores finales (“nearshoring”). Costa Rica y México son los países que más se han beneficiado de momento, pero otros países en la región podrían también beneficiarse.

Para aprovechar las oportunidades y desbloquear el potencial de América Latina para un crecimiento sostenible que además traiga desarrollo social, se requieren inversiones significativas, tanto públicas como privadas. Para ello se requieren medidas de política pública en tres áreas prioritarias:

Habilidades e innovación: Es necesario mejorar la educación técnica y superior, junto con programas de capacitación, para fomentar la innovación, la absorción de tecnologías y conocimientos técnicos para facilitar la producción de alto valor agregado en las cadenas de valor, así como energías renovables e hidrógeno verde.
Infraestructura: Mejorar la infraestructura es clave para desarrollar el potencial de las energías renovables y el nearshoring, incluyendo carreteras, puertos, aeropuertos, redes eléctricas y de telecomunicaciones.
Seguridad jurídica: Garantizar la seguridad jurídica, un marco regulatorio estable y transparente, y fortalecer las instituciones y la gobernanza es clave para catalizar la inversión y atraer inversión extranjera directa.

Gráfico 1. América Latina tiene amplias reservas de minerales

Fuente: United States Geological Survey (USGS).

Referencias:

IEA (2023). Latin America Energy Outlook

OECD Economic Outlook, May 2024 – Reporte completo en inglés con las proyecciones macroeconómicas, los principales desafíos estructurales e información detallada por país.

Perspectivas económicas de la OCDE para países de América Latina, Mayo 2024.

Información detallada por país: Argentina | Brasil | Chile | Colombia | Costa Rica | México | Perú


An unfolding recovery

By Clare Lombardelli, OECD Chief Economist

Available in French

Cautious optimism has begun to take hold in the global economy, despite modest growth and the persistent shadow of geopolitical risks. Inflation is easing faster than expected, labour markets remain strong with unemployment at or near record lows.  Private-sector confidence is improving.  Yet the impacts of tighter monetary conditions are being felt, especially in housing and credit markets.

This recovery is unfolding differently across regions. The United States and a number of large emerging markets continue to exhibit strong growth, in contrast to European economies.  The mixed macroeconomic landscape is expected to persist, with inflation and interest rates declining at differing paces, and differing needs for fiscal consolidation.  

Despite a more balanced risk outlook, substantial concerns remain.  High geopolitical tensions, particularly in the Middle East, could disrupt energy and financial markets, causing inflation to spike and growth to falter.  Debt service burdens are already significant, and could rise further as low-yielding debt is rolled over or fixed-term borrowing rates are renegotiated. Expectations that inflation will continue to decline steadily might also prove misplaced.

In the medium and longer term, the fiscal position is worrying.  Governments must address mounting debt and rising expenditure demands due to ageing populations, climate change mitigation, and defence needs.  Increasing debt-service costs further worsen fiscal sustainability.  There is never an attractive time to do this, but conditions enable this rebuilding to begin now.   A robust medium-term approach to containing spending, building revenues, and focusing policy efforts on growth enhancing structural reforms are all needed.

Disappointing growth underscores the case for strengthening global trade and productivity.   Trade and industrial policies should aim for resilient global value chains through diversification without undermining the benefits of open trade. At the same time, accelerating decarbonisation requires bold policy measures, such as investing in green and digital infrastructure, enhancing carbon pricing, and promoting technology transfer.  The developments in Artificial Intelligence (AI) provide a welcome and much needed opportunity to raise productivity.  Ensuring the benefits materialise and are broadly shared requires investments in education and training and strong and internationally consistent competition policy.

Access the digital report.

Reference:

OECD (2024), OECD Economic Outlook, May 2024: An unfolding recovery, OECD Publishing, Paris, https://doi.org/10.1787/69a0c310-en.


L’amorce d’une reprise

Clare Lombardelli, Cheffe économiste de l’OCDE

Un optimisme prudent a commencé à gagner l’économie mondiale, malgré une croissance modeste et l’ombre persistante des risques géopolitiques. Le recul de l’inflation est plus rapide que prévu, et les marchés du travail restent vigoureux, avec un taux de chômage à son plus bas niveau ou proche de l’être. Dans le secteur privé, la confiance s’améliore. Pour autant, les effets du durcissement des politiques monétaires sont perceptibles, notamment sur les marchés du logement et du crédit.

Cette reprise qui s’amorce diffère dans ses modalités selon les régions du monde. Les États-Unis et un certain nombre de grands marchés émergents continuent d’afficher une forte croissance, contrairement aux économies européennes. Le paysage macroéconomique devrait rester contrasté, le repli de l’inflation et des taux d’intérêt étant plus ou moins rapide et les besoins d’assainissement budgétaire plus ou moins importants.

Malgré des perspectives plus équilibrées sur le plan des risques, des préoccupations majeures subsistent. Les fortes tensions géopolitiques, notamment au Moyen-Orient, pourraient venir perturber les marchés de l’énergie et les marchés financiers, provoquant une envolée de l’inflation et un ralentissement de la croissance. Le service de la dette représente déjà une charge importante, qui pourrait s’alourdir davantage au fur et à mesure du refinancement des emprunts à faible rendement ou de la renégociation des taux des emprunts à terme fixe. Les attentes d’une poursuite de la baisse régulière de l’inflation pourraient également s’avérer inappropriées.

À moyen comme à long terme, la situation budgétaire est préoccupante. Les pouvoirs publics doivent faire face à un endettement croissant, ainsi qu’à la hausse des dépenses requise par le vieillissement démographique, l’atténuation du changement climatique et les besoins en matière de défense. La hausse du coût du service de la dette amplifie la dégradation de la viabilité budgétaire. Il n’y a jamais un moment idéal, mais les conditions actuelles permettent d’engager dès à présent le redressement des finances publiques. Une approche à moyen terme et ferme s’impose pour maîtriser les dépenses, accroître les recettes et centrer les efforts des pouvoirs publics sur des réformes structurelles favorisant la croissance.

La croissance étant décevante, cela appelle à renforcer les échanges mondiaux et la productivité. Les politiques commerciales et industrielles devraient viser à assurer la résilience des chaînes de valeur mondiales, en favorisant leur diversification sans compromettre les avantages de l’ouverture des échanges. Dans le même temps, l’accélération de la décarbonation exige de la part des pouvoirs publics des mesures ambitieuses, par exemple investir dans les infrastructures vertes et numériques, relever la tarification du carbone et promouvoir les transferts de technologies. Les progrès de l’intelligence artificielle (IA) offrent des perspectives de gains de productivité aussi bienvenues qu’indispensables. Pour que ces avantages puissent se concrétiser et être largement partagés, des investissements dans l’éducation et la formation, et une politique de la concurrence solide, cohérente au niveau international, seront essentiels.2 mai 2024.

Editorial des Perspectives économiques de l’OCDE

Référence:

OECD (2024), Perspectives économiques de l’OCDE, Volume 2024 Numéro 1, OECD Publishing, Paris, https://doi.org/10.1787/bd18c5ae-fr


Artificial Intelligence: Promises and perils for productivity and broad-based economic growth

By Francesco Filippucci, Peter Gal, Cecilia Jona-Lasinio, Alvaro Leandro, Giuseppe Nicoletti

Recent OECD work discusses the impact of Artificial Intelligence (AI) on productivity, distribution, and growth, highlighting the challenges and conditions to be met before its benefits can be realised (Filippucci et al., 2024). These issues are particularly timely considering weak productivity growth across OECD economies in recent decades (Andre and Gal, 2024) and the widespread enthusiasm and active debate surrounding the growth-potential of AI. Some proponents suggest it might reverse the long-standing productivity slowdown by adding 1-1.5 percentage points of annual growth (Baily, Brynjolfsson, and Korinek, 2023; Artificial Intelligence Commission of France, 2024; Briggs and Kodnani, 2023). Acemoglu (2024), on the other hand, contends that current capabilities can only support moderate macro-level productivity gains, in the order of 0.1% per year.

AI is becoming a general-purpose technology with a transformative impact on a broad range of economic activities, as was the case with computers, the internet or electricity (Agrawal, Gans and Goldfarb, 2019). It is a digital technology that combines software, data and computing power to perform a variety of advanced cognitive tasks, such as content generation, prediction, or even physical tasks (coupled with robotics). It is also characterised by self-improvement (learning) and greater autonomy. These features imply that AI can boost not only the production of goods and services but also the generation of ideas, speeding up research and innovation (Aghion, Jones and Jones, 2018).

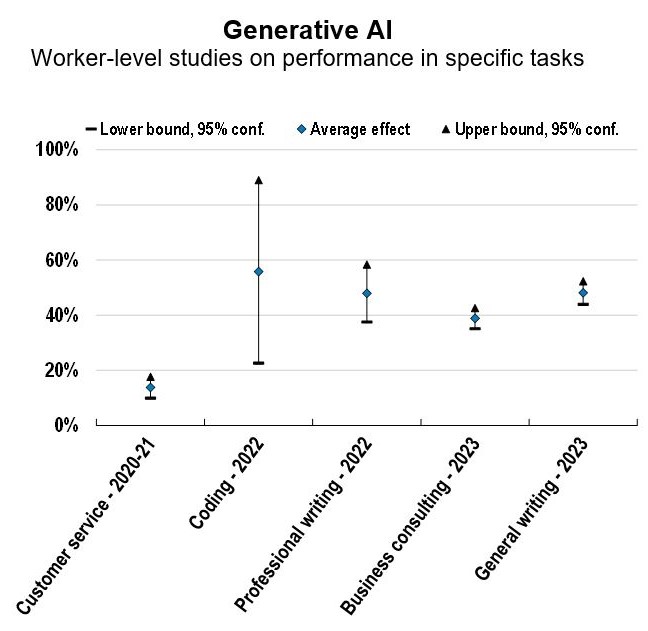
Reviewing the fast-growing literature, initial micro-level evidence covering firms, workers and researchers suggests that AI may stimulate innovation (Van Noorden and Perkel, 2023) and delivers significant productivity and performance benefits. The size of the firm-level productivity gains from pre-Generative AI is comparable to previous digital technologies (up to 10%; see Figure 1, panel on Non-Generative AI). When using more recent Generative AI to assist with various tasks – writing, computer programming or customer service – substantially larger performance benefits have been identified, with widely varying magnitudes depending on the context (in the order of 20-50%; see panel on Generative AI).

Figure 1. The relationship between AI and productivity or worker performance: Selected estimates from the literature

Note: *controlling for other ICT technologies. In the Non-Generative AI panel, “AI use” is a 0-1 dummy obtained by firm surveys, while AI patents refers either to a 0-1 dummy for having at least 1 patent (US study) or to the number of patents in firms (for the EU+UK study, where the average number is 0.48 with 2.6 standard deviation, so that firms cumulating more than one patents are relatively few). Two of the estimates in the panel (“9 countries, 2016-21”) relate to the same study (Calvino and Fontanelli, 2023), but the second estimate controls for other ICT technology use and thus better isolates the marginal impact of AI. Given that the study reports separate estimates for all 9 countries, the median estimate across countries is shown on the Figure.
Source: authors’ compilation from micro level studies.

How these microeconomic gains will translate into macroeconomic productivity growth hinges on the extent of AI adoption, which seems limited to date at less than 5% of firms in the United States (Census Bureau, 2024). It also depends on whether AI-driven automation displaces workers from heavily affected activities; or the human-augmenting capabilities of AI will prevail, underpinning labour demand. Currently, AI exposure varies greatly across sectors: knowledge-intensive, high-productivity activities seem much more affected (Figure 2), with high potential for automation in some cases (Cazzaniga et al, 2024; WEF, 2023). Hence an eventual fall in the employment shares of these sectors would act as a drag on aggregate productivity growth, resembling a new form of “Baumol disease” (Aghion, Antonin and Bunel, 2019).

Figure 2. High productivity and knowledge intensive services are most affected by AI

AI exposure of workers by sector (2019)

Note: The index measures the extent to which worker abilities are related to important AI applications. The measure is standardized with mean zero and standard deviation 1 at the occupation level and then matched to sectors. The figure does not yet include recent Generative AI models.
*Including non-market services, manufacturing, utilities, etc.
Source: Filippucci et al (2024) and OECD (2024) based on (Felten, Raj and Seamans, 2021).

AI-driven threats to market competition and inequality may weigh on its potential benefits. First, the high fixed costs and returns to scale related to data and computing power may lead to excessive concentration of AI development. Second, AI use in downstream applications may also lead to market distortions, especially if it allows first movers to build up a substantial lead in market share and market power. Moreover, AI-powered pricing algorithms have a tendency to charge supra-competitive prices (Calvano et al., 2020), and can also enhance harmful price discrimination (OECD, 2018).          

AI will likely have ambiguous impacts on inequality. The technology has the potential to substitute for high-skilled labour and narrow wage gaps with low-skilled workers, thereby reducing inequalities (Autor, 2024) at least within occupations (Georgieff, 2024). But there are also indications that AI can be associated with higher unemployment (OECD, 2024). On the other hand, AI can also lead to more inclusion and stronger economic mobility by improving education quality and access, expanding credit availability, and lowering skill barriers (e.g. foreign languages).

Further uncertainties surrounding AI include broader societal concerns. More immediate ones relate to privacy, misinformation, and bias (possibly leading to exclusion), while longer-term ones include mass unemployment or even existential risks (Nordhaus, 2021; Jones, 2023).

A comprehensive policy approach is needed to effectively manage these risks and harness AI’s full potential. Immediate priorities involve promoting market competition and widespread access to AI technologies while preserving innovation incentives and addressing issues of reliability and bias. Job displacement, reallocation and inequality impacts might emerge over longer periods, but they require preventive policy action through training, education, and redistribution measures. Policymakers should also devise national and international governance mechanisms to cope with rapid, unpredictable developments in AI.  

Endnote:
The main paper underlying this blog (Filippucci et al, 2024) was developed within the Joint OECD-Italy’s Department of Treasury Project for Multilateral Policy Support.

References:
– Acemoglu, D. (2024), “The Simple Macroeconomics of AI”, https://economics.mit.edu/sites/default/files/2024-04/The%20Simple%20Macroeconomics%20of%20AI.pdf.
Aghion, P., B. Jones and C. Jones (2018), “Artificial Intelligence and Economic Growth”, NBER Chapter in The Economics of Artificial Intelligence: An Agenda, p. 237-28, https://doi.org/10.3386/w23928.
– Aghion, P., C. Antonin and S. Bunel (2019), “Artificial Intelligence, Growth and Employment: The Role of Policy”, Economie et Statistique / Economics and Statistics, 510-511-512, 149–164. https://doi.org/10.24187/ecostat.2019.510t.1994.
– Agrawal, A., J. Gans and A. Goldfarb (2019), “Economic Policy for Artificial Intelligence”, Innovation Policy and the Economy, Vol. 19, https://doi.org/10.1086/699935.
– Andre, C., and P. Gal (2024), “Reviving productivity growth: A review of policies”, OECD Economic Policy Papers, forthcoming.
– Artificial Intelligence Commission of France (2024), “AI, Our Ambition for France” / “IA : Notre Ambition pour la France”, https://www.info.gouv.fr/upload/media/content/0001/09/4d3cc456dd2f5b9d79ee75feea63b47f10d75158.pdf.
– Autor, D. (2024), “Applying AI to Rebuild Middle Class Jobs”, NBER Woking Paper, No. 32140, National Bureau of Economic Research, https://doi.org/10.3386/w32140.
– Baily, M., E. Brynjolfsson and A. Korinek (2023), “Machines of mind: The case for an AI-powered productivity boom”, in The Economics and Regulation of Artificial Intelligence and Emerging Technologies, Brookings, https://www.brookings.edu/articles/machines-of-mind-the-case-for-an-ai-powered-productivity-boom/.
– Briggs, J., and D. Kodnani, (2023), “The Potentially Large Effects of Artificial Intelligence on Economic Growth”, Global Economics Analyst, Goldman Sachs, New York, https://www.gspublishing.com/content/research/en/reports/2023/10/30/2d567ebf-0e7d-4769-8f01-7c62e894a779.html.
– Calvano, E. et al. (2020), “Artificial intelligence, algorithmic pricing, and collusion”, American Economic Review, Vol. 110/10, p. 3267-3297, https://doi.org/10.1257/aer.20190623.
– Calvino, F. and L. Fontanelli (2023), “A portrait of AI adopters across countries: Firm characteristics, assets’ complementarities and productivity”, OECD Science, Technology and Industry Working Papers, No. 2023/02, OECD Publishing, Paris, https://doi.org/10.1787/0fb79bb9-en.
– Cazzaniga, M. et al. (2024), “Gen-AI: Artificial Intelligence and the Future of Work”, IMF Staff Discussion Notes, International Monetary Fund, https://www.imf.org/en/Publications/Staff-Discussion-Notes/Issues/2024/01/14/Gen-AI-Artificial-Intelligence-and-the-Future-of-Work-542379.
– Census Bureau (2024), Business Trends and Outlook Survey, Updated March 28, 2024, https://www.census.gov/hfp/btos/data.
– Felten, E., M. Raj and R. Seamans (2021), “Occupational, industry, and geographic exposure to artificial intelligence: A novel dataset and its potential uses”, Strategic Management Journal , 42(12), p. 2195-2217, https://doi.org/10.1002/smj.3286.
– Filippucci, F., P. Gal, A. Leandro, C. Jona-Lasinio and G. Nicoletti (2024), “The impact of Artificial Intelligence on productivity, distribution and growth: Key mechanisms, initial evidence and policy challenges”, OECD Artificial Intelligence Papers, No. 15. OECD Publishing, Paris, https://doi.org/10.1787/8d900037-en.
– Georgieff, A. (2024), “Artificial intelligence and wage inequality”, OECD Artificial Intelligence Papers, No. 13, OECD Publishing, Paris, https://doi.org/10.1787/bf98a45c-en.
– Jones, C. (2023), “The A.I. Dilemma: Growth versus Existential Risk”, NBER Working Paper, No. 31837, National Bureau of Economic Research, https://doi.org/10.3386/w31837.
– Nordhaus, W. (2021), “Are We Approaching an Economic Singularity? Information Technology and the Future of Economic Growth”, American Economic Journal: Macroeconomics, Vol. 13/1, p. 299–332, https://doi.org/10.1257/mac.20170105.
– OECD (2018), Personalised Pricing in the Digital Era. https://www.oecd.org/competition/personalised-pricing-in-the-digital-era.htm
– OECD (2024), “Labour Market Shortages, Mismatches and Megatrends”, Global Forum on Productivity, forthcoming.
– Van Noorden, R. and J. Perkel (2023), “AI and science: what 1,600 researchers think”, Nature, vol. 621/7980, p. 672-675, https://www.nature.com/articles/d41586-023-02980-0.
– WEF (2023), “Jobs of Tomorrow: Large Language Models and Jobs”, https://www.weforum.org/publications/jobs-of-tomorrow-large-language-models-and-jobs/.


Addressing housing market challenges in the Slovak Republic

By Federica De Pace

As in many OECD countries, housing affordability deteriorated in Slovakia before the energy crisis. Between 2015 and 2022, house prices rose at a much faster pace than households’ income (Figure 1). Since 2022, the cost-of-living crisis has been squeezing real incomes, dampening housing demand and resulting in declining house prices. However, with interest rates and mortgage costs surging, housing affordability remains a challenge today. Moreover, Slovak households have been particularly exposed to the surge in energy prices, as nearly 10% of their budget accounts for electricity and gas expenditures – the highest share among OECD countries. The poor thermal performance of the housing stock, mostly comprising buildings that were constructed during the communist era, contributes to explaining such high costs for electricity and heat. Last, many low-income households, especially in the Roma community, live in low-quality and overcrowded housing, and homelessness has reached an alarming dimension over the past years.

Figure 1. House prices have increased faster than incomes until 2022

Price to income ratio, index 2015 = 100

Source: OECD Analytical House Prices database.

To address these housing market challenges, Slovakia needs to find ways to boost efficiency, promote affordability and inclusiveness, and accelerate environmental sustainability of housing. To do so, the 2024 OECD Economic Survey of the Slovak Republic suggests reforms in five broad areas:

1.Streamlining housing construction. Administrative inefficiencies in the building permits procedures contribute to slow the responsiveness of housing supply to demand pressures. The process for obtaining building permits is very slow: in 2019 it took on average 300 days versus 152 days in the average OECD country (World Bank, 2019). Expediting the adoption of digitalisation in building permits would accelerate procedures and enhance housing supply responsiveness, alleviating pressures on housing prices. Furthermore, land use policy is highly decentralised. This leads to inefficiencies in the management of resources, challenges in hiring qualified staff for construction-related tasks and an increased risk of policy capture by local stakeholders, resulting in blockages of construction projects at local level. Giving more responsibilities to higher levels of government in land use policy and construction-related activities would help to facilitate construction projects.

    2. Expanding the private formal rental market. As a consequence of the privatisation of state-owned housing during the transition to a market economy in the early 1990s, most households own their home, and the formal private rental market is thin. Developing the private rental market can spur residential (Figure 2) and labour mobility. This can help to reduce skill shortages and improve matching between employers and employees, with positive effects on productivity. It requires inter alia striking a better balance between the interests of landlords and tenants, for example by making provisions for a rental contract that ensures enough flexibility and security for both parties.

      Figure 2. Homeownership is negatively correlated with residential mobility

      Source: OECD Affordable Housing database; and OECD (2021), Brick by Brick: Building Better Housing Policies, OECD Publishing, Paris, https://doi.org/10.1787/b453b043-en

      3. Reforming housing taxation. Revenues from recurrent taxes on immovable property are low in international comparison. A comprehensive reform package shifting the burden from labour to property taxation has the potential to reduce distortions to economic growth.  Moreover, basing property taxes on regularly updated property values would help stabilise fluctuations in housing prices and improve equity. Gradually phasing-in the taxes and introducing tax deferrals, for example by paying the tax only when a house is sold or bequeathed, can increase acceptance and protect vulnerable homeowners.

      4. Increasing housing inclusiveness. Many low-income households live in poor housing conditions and are overburdened by housing costs. These issues are particularly pronounced among the Roma, where the overcrowding rate reaches 80% and almost a third of the community lives in dwellings without access to tap water (European Agency for Fundamental Rights, 2022). Accelerating the formalisation of property rights in Roma settlements would help to provide access to basic infrastructure, such as tap water and sanitary facilities, improving life conditions and promoting social integration. Higher investment in social housing, especially in areas connected to job centres and transports, and expanding targeted housing allowances would help to raise affordability and reduce social exclusion.

      5. Strengthening incentives to accelerate housing renovation. Higher carbon prices in the building sector, as planned at the European level from 2027, would provide strong incentives for renovating housing and shifting to lower-emission heating systems. In addition, implementing stricter regulation, including by extending coverage of high-quality energy performance certificates and relaxing voting rules for renovation works in multi-apartment buildings, together with targeted financial assistance to low-income households living in the most energy inefficient dwellings would help to further incentivise housing renovations, reduce energy poverty and advance environmental objectives. 

      Reference

      OECD (2024), OECD Economic Surveys: Slovak Republic 2024, OECD Publishing, Paris, https://doi.org/10.1787/397ca086-en.


        Strengthening economic resilience in Switzerland through trade

        By Erik Frohm

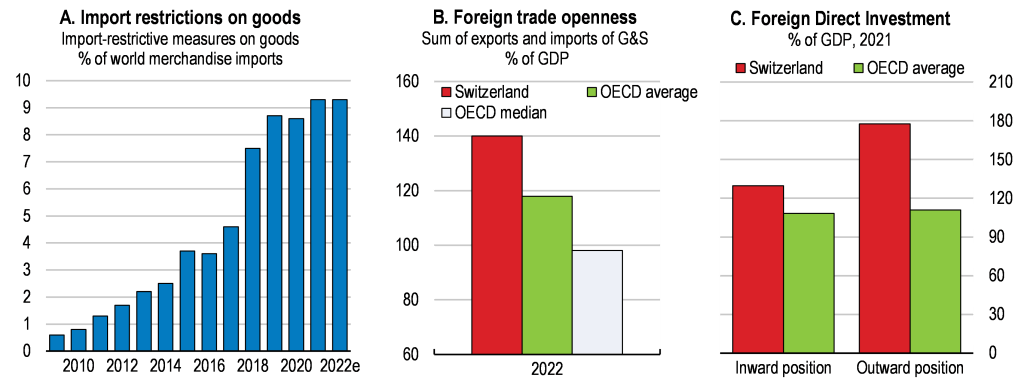
        The COVID-19 pandemic and escalating conflicts, such as Russia’s war of aggression against Ukraine, have sent shockwaves through energy markets and global value chains. This has reinforced the imperative to foster economic resilience in many countries, while raising calls for self-reliance, more active industrial policies to benefit domestic industries and trade restrictions (Figure 1).

        For Switzerland, a country deeply embedded in global markets, navigating these challenges is vital. Central to Switzerland’s success has been its steadfast commitment to openness, enabling the flow of goods and services, capital, people and ideas. Although trade may act as a conduit for adverse shocks, less integration into the global economy would not make Switzerland more resilient, as highlighted in the 2024 Economic Survey. Instead, stable and predictable trade and investment regimes reduce uncertainty and lower trade costs. This empowers companies to diversify and fortify their supply chains cost-effectively, as open trade makes markets “thicker”, by expanding the number of possible suppliers and buyers.

        Figure 1. Global trade restrictions pose challenges for Switzerland’s open economy

        Notes: For panel A, the chart denotes the global cumulative trade coverage of restrictions on goods estimated by the WTO Secretariat, based on information available in the TMDB on import measures recorded since 2009 and considered to have a trade-restrictive effect. The estimates include import measures for which HS (Harmonised Commodity Description and Coding System) codes were available. The figures do not include trade remedy measures.
        Source: WTO November 2022 Report; Economic Outlook database; OECD International Direct Investment Statistics database.

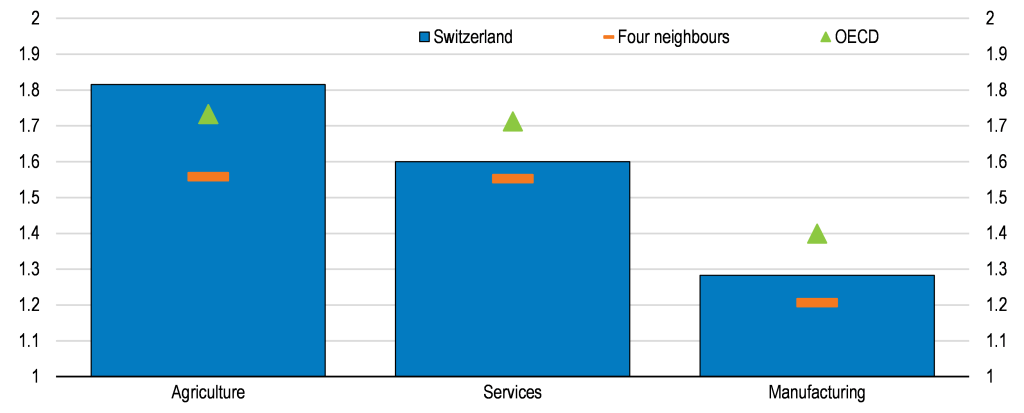
        According to the WTO’s Trade Cost Database, effective trade costs, representing all factors constraining international trade versus domestic activity, are lower in Switzerland than the OECD average in manufacturing and services, yet higher than in the four neighbouring countries (Austria, Germany, France and Italy), see Figure 2. Trade costs can be lowered in many ways. Tariff cuts, deeper or new free trade agreements (FTAs), improved at-the-border regulations and procedures, as well as investments in digital infrastructure all help. In this regard, Switzerland unilaterally abolished tariffs on industrial goods from January 2024. Similarly, the signing of an FTA with India in March 2024 together with the EFTA member states (Iceland, Lichtenstein and Norway) represents an important milestone. Yet barriers to trade remain high in agriculture and the services sector. Less direct support and more import competition would raise agriculture productivity and lower prices. Minimising barriers to services trade will increase the gains from digital transformation and boost competitiveness.

        Figure 2. There is scope to reduce effective trade costs, in particular in services and agriculture

        Notes: The effective trade costs are estimates of the costs involved with international trade relative to domestic activity. The figure shows trade cost estimates from the WTO, averaged across ISIC Rev. 4 sub-sectors in 2018. The trade costs are expressed as ad-valorem equivalents, in logarithms. Four neighbours refer to Austria, Germany, France and Italy. OECD is a simple average of OECD countries.
        Source: WTO.

        Most of Swiss exports and imports flow within FTAs. The usage rate is 73% for imports, which is higher than for the EU average yet lower than best performing countries. There are several reasons why companies may choose not to use the FTAs, depending on the products they trade and their preferential rules of origin. Complying with the rules may be difficult due to complex information requirements or involve large administrative costs. Reducing the administrative burden and providing centrallised, clearly structured and understandable information could increase the use of FTAs.

        With the EU standing as Switzerland’s largest trading partner, the bilateral relationship is of paramount importance. The current partnership is governed by roughly 120 separate treaties, but faces uncertainties as efforts to reach a comprehensive “framework agreement” stalled since 2021. The Federal Council’s adoption of a new negotiating mandate with the EU in March 2024 is a welcome step, and opens the door to continued deep economic integration. An erosion of the Switzerland-EU partnership would raise uncertainty, be harmful for Switzerland’s external trade and competitiveness and undermine its economic resilience.

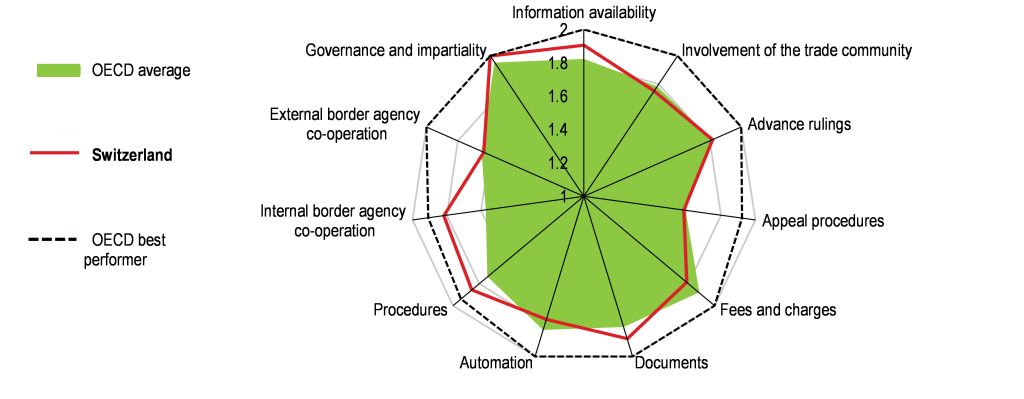
        Addressing behind- and at-the-border regulations, as well as enhancing digital connectivity, are crucial steps to facilitating trade and limiting bottlenecks. While Switzerland outperforms the OECD average in several aspects of trade facilitation, there is further room for improvement, particularly in areas such as fees and charges, process automation, and external border agency cooperation (see Figure 3). Streamlining information availability and pre-arrival processing procedures for imports can significantly reduce the time and cost burden for businesses, particularly SMEs looking to expand internationally and diversify their supply chains.

        As Switzerland charts its course through a changing global economic landscape, maintaining openness in trade and reducing regulatory burdens will be key to strengthening economic resilience. This approach can allow companies to improve the resilience of their supply chains, without unduly increased state influence or costly public support.

        Figure 3. Improving trade facilitation measures would help reduce bottlenecks

        OECD Trade Facilitation Indicators, from 0 to 2 (best performance), 2022

        Source: OECD (2022), Trade Facilitation Indicators.   


        Employment dynamics across firms during COVID-19: The role of job retention schemes

        By Sara Calligaris, Gabriele Ciminelli, Hélia Costa, Chiara Criscuolo, Lilas Demmou, Isabelle Desnoyers-James, Guido Franco and Rudy Verlhac[1]

        Three years after the outbreak of the COVID-19 pandemic, the implications of the massive fall in economic activity and of the associated widespread government support to businesses are still not fully understood. Yet, they are key to inform policy design and action going forward, in particular with respect to their potential consequences for aggregate productivity via labour reallocation.

        Against this backdrop, a recent paper (Calligaris et al., 2023) investigates employment dynamics across firms along the intensive and extensive margins during the COVID-19 pandemic, the extent to which these adjustments were productivity enhancing, and the role of job retention schemes (JRS) in shaping these patterns. The paper relies on a combination of novel and unique data. First, in collaboration with 12 participating countries, it collects high-frequency (monthly) harmonised micro-aggregated statistics, computed using administrative data on employment and wages from electronic payroll records, linked to monthly information on policy support during COVID-19. Second, it builds a new cross-country and high-frequency de-jure indicator of JRS allowing researchers to benchmark their generosity across countries and over time.

        Employment adjustments and reallocation in COVID-19 times

        The analysis shows that, since the onset of the COVID-19 crisis, employment adjusted through different margins. In 2020, employment adjusted mainly along the intensive margin, with a decline in employment growth of surviving firms relative to 2019, while – at the extensive margin – survival rates remained on average stable. In 2021, employment growth of surviving firms picked up, while average survival rates started to decline. These aggregate results mask high cross-country and cross-sector heterogeneity, with increases (decreases) in job destruction (creation) rates significantly higher in low-telework sectors.

        These adjustments in employment dynamics also entail a reallocation of resources across firms within sectors, which is a relevant factor affecting aggregate productivity growth. Relative to 2019, the productivity enhancing nature of labour reallocation was weaker in 2020 and 2021. Indeed, while on the extensive margin high productivity firms still showed significantly higher survival rates compared to their lower productivity competitors, the contribution of the intensive margin weakened, with employment growth of surviving firms remaining only marginally related to productivity.

        Figure 1. Labour reallocation remained productivity-enhancing, though to a lower extent

        Difference in total employment growth relative to the bottom quartile of the productivity distribution.

        Note: The figure presents differential employment growth rate for mid (25-75) and high productivity firms (75-100) relative to the baseline group of low productivity ones (0-25) in 2019, 2020, and 2021. The estimates come from regressing employment growth (between January of each year and January of the year after) on a dummy for each productivity quantile along with country-sector fixed effects and weighting the regression by sectoral employment shares. The columns represent estimated coefficients and the green bars 95% confidence intervals.
        Source: Calligaris et al. (2023).

        The role of job retention schemes

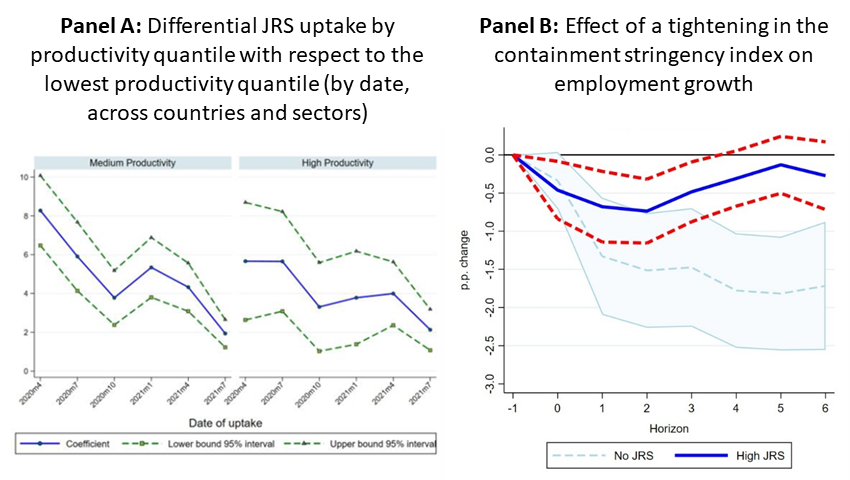
        Job retention schemes have been the most widespread policy instrument to support workers and firms across OECD countries. The data show that the uptake of JRS by firms in the sample varies markedly across countries, sectors and over time.  At its peak, around 80% (60%) of firms received support in New Zealand (Australia), and more than 20% of firms were supported in European countries such as Denmark, Latvia and the Slovak Republic. Uptake has been by far the highest in the “Accommodation and food service activities” sector and at the time the COVID-19 pandemic hit the hardest. It was gradually reduced and the eligibility requirements to access the schemes were tightened when countries lifted mobility restrictions. There was also heterogeneity in the allocation of support across firms within sectors: In all countries, JRS support was not disproportionately directed towards unproductive companies (Figure 2.A), as uptake was relatively higher for firms in the middle quartiles and in the top quartile of the productivity or size distribution.

        The analysis investigates the role of JRS using: i) firm-level information on uptake to contrast employment growth and survival rates across firms at a detailed level, as well as ii) local projections estimations exploiting ex ante differences in the generosity of support design through a novel de-jure JRS indicator to further ease endogeneity concerns.  The two approaches provide complementary insights, showing that JRS contributed to mitigating the negative consequences of the crisis on employment and business survival. Specifically, following a tightening in the intensity of the pandemic, employment growth was on average lower and firm exit higher in the absence of JRS, relative to when generous JRS were in place (Figure 2.B). Furthermore, the analysis shows that when no JRS were in place, employment for mid and high productivity firms decreased significantly more than when more generous JRS was in place, while no significant difference was found for the least productive firms.

        Taken together, these results suggest that government policies were effective in mitigating the effects of the crisis and did not appear to distort the creative destruction process and productivity enhancing nature of reallocation.

        Figure 2. JRS mitigated the consequences of the crisis, without distorting the reallocation process

        Note: Panel A plots the coefficient and related 95% confidence intervals of a regression of JRS uptake on the productivity quantiles categorical variable, on a cross-country sample evaluated repeatedly at different points in time, controlling for country by industry fixed effects. Each sector is weighted according to its average size in terms of employment over the year. Panel B. The lines represent the effect on employment growth of a change in the containment stringency index between 0 and 6 months after the change, if the JRS indicator in the month before the change in severity was equal to 0 (No JRS, light blue dotted line) or to the 75th percentile (High JRS, blue filled line). The red dotted lines and the thick light blue lines represent the 90% confidence interval around the estimates.

        References

        Calligaris, S., G. Ciminelli, H. Costa, C. Criscuolo, L. Demmou, I. Desnoyers-James, G. Franco, R. Verlhac, (2023), “Employment dynamics across firms during COVID-19: The role of job retention schemes”, OECD Economics Department Working PaperNo 1788, https://doi.org/10.1787/33388537-en.


        [1] The analysis is the result of a collaboration project between two OECD Departments, namely the Economics Department and the Directorate for Science, Technology and Innovation. It would not have been possible without the valuable contribution of national experts from the Central Bank, the Ministry of Economy and/or Finance, Revenues and Customs, or National Statistical Office of the countries participating to the project –namely, Australia, Belgium, Canada, Costa Rica, Denmark, Italy, Latvia, Netherlands, New Zealand, Norway, Slovak Republic and United Kingdom.


        Strengthening the recovery and accelerating the green transition in Hungary

        By Pierre-Alain Pionnier and Donal Smith

        After a strong demand-based recovery from the economic fallout of the COVID-19 pandemic, Hungary’s economy contracted in 2023 while inflation climbed higher than elsewhere in the European Union, at some point surpassing 25%. The good news is that growth has restarted in mid-2023 and inflation is receding. At the same time, both fiscal and monetary policies will need to work hand-in-hand to fight remaining inflationary pressures and recreate fiscal space for future spending needs, as highlighted by the recently published OECD Economic Survey of Hungary (OECD, 2024).

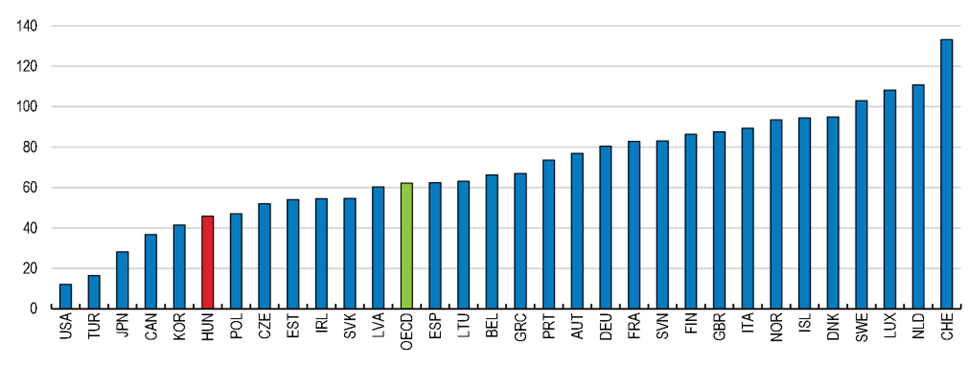
        One of the big challenges of the next decades will be to move towards a greener and more sustainable economy. Hungary has made progress in this direction, but this progress needs to accelerate. For a large part, emission reductions achieved so far have been related to the changing industry structures as the economy transitioned to a market economy in the early 1990s. Regulations and standards are currently the main tools used to support the green transition, but they will likely be insufficient to reach the 2030 and 2050 emission targets. Price signals are key for an efficient decarbonisation. The European Union’s Emission Trading Scheme is the main price-based measure to curb emissions in Hungary, but it only covers a third of emissions. As a result, average carbon prices are low in international comparison, exacerbated by energy subsidies on fossil fuels (Figure 1).

        Figure 1. Carbon prices are low

        Net effective carbon rates, all sectors, EUR per tonne of CO2, 2021

        Note: Net effective carbon rates consist of emission trading prices, carbon taxes, and fuel excise taxes, minus fossil fuel subsidies. The OECD average is an unweighted average of net effective carbon rates across OECD countries.
        Source: (OECD, 2022)

        In the residential sector, price caps keep retail electricity and gas prices low for many households. Along with poor dwelling insulation, this may explain why household energy consumption is among the highest in Europe (Figure 2). If energy support to households were restructured and price caps replaced with targeted cash transfers, this would not only protect vulnerable households, but it would also improve energy efficiency incentives and cost less, as energy subsidies reached 2.5% of GDP in 2023. Part of the fiscal savings could be allocated to upgrade the housing stock of financially constrained households.

        Figure 2. Households’ energy consumption is high

        Energy consumption of households for heating, in kilograms of oil equivalent (koe) per m²

        Note: For each country, energy consumption is corrected for changes in meteorological conditions across years.
        Source: Odysee-Mure, https://www.odyssee-mure.eu/

        Emissions from the transport sector have increased since 1990 and now represent 20% of overall greenhouse gas emissions. Car ownership has expanded along with rising income levels, but Hungarians drive one of the oldest car fleets in Europe, and over longer distances than elsewhere in Europe. Transport emissions could be limited through better incentives to replace high-polluting cars and choose public transportation where available, but also by improving the quality of public transportation and limiting urban sprawl, especially around Budapest.

        On the supply side, meeting emission targets will require a significant increase in electricity production from low-carbon sources. Current plans are mostly focused on solar energy and biomass, particularly wood. While burning wood is a low-emission energy source seen over the long run, when accounting for the replanting of trees, in the short run it would increase emissions and reinforce an already acute air pollution problem. Hungary could make better use of its potential for wind and geothermal energy, but that will require removing restrictive rules on windmill installation and easing licensing procedures for geothermal energy projects. Moreover, the development of intermittent energy sources like solar and wind energy will require massive investments in the electricity grid.

        Ensuring a sufficient low-carbon electricity supply will be a challenge. Hungary currently imports 40% of its electricity from neighbouring countries, which are engaged in a similar decarbonisation process. Eventually, Hungary will also have to replace an ageing nuclear plant, and large projects like this can be subject to financial, technical, and even geopolitical risks.

        All of these considerations will make it even more important to speed up progress on rolling out low-carbon renewable energy sources. Only this can make Hungary’s progress towards living standards more sustainable and leave a brighter future for the next generation.

        References:

        OECD (2022), Pricing Greenhouse Gas Emissions: Turning Climate Targets into Climate Action, OECD Series on Carbon Pricing and Energy Taxation, OECD Publishing, Paris, https://doi.org/10.1787/e9778969-en

        OECD (2024), OECD Economic Survey of Hungary, March 2024, OECD Publishing, Paris, available at https://doi.org/10.1787/795451e5-en.


        Whither excess household savings? A key known unknown

        by Geoff Barnard and Patrice Ollivaud, OECD Economics Department

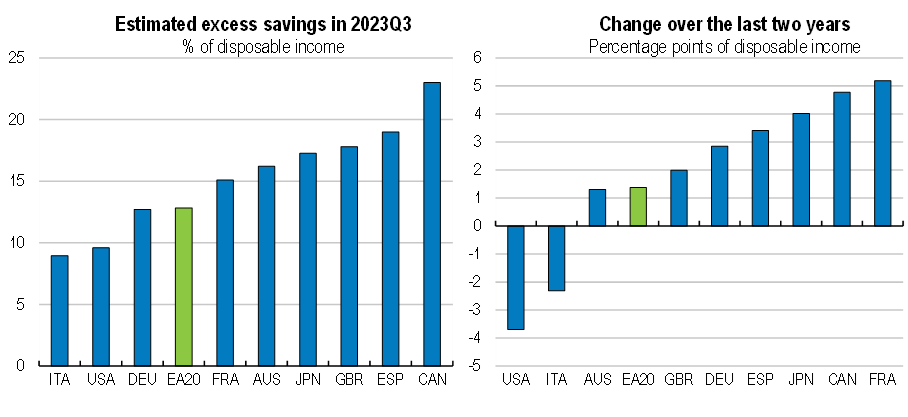
        In most advanced economies, the estimated level of excess household savings accumulated during the pandemic and as yet unspent is high (Figure 1, Panel A). The unusual circumstances in which they were accumulated, with temporarily constrained spending opportunities combined, in some countries, with large-scale government income support, means that past experience offers limited guidance on whether and when these additional savings will be run down. This remains a key source of uncertainty in economic projections. An analysis of the composition and distribution of the estimated excess savings across a range of OECD economies suggests that the likelihood that they will be drawn down soon is limited given the large share held by high‑income households and the small proportion held in liquid assets. However, the margins of uncertainty around projections of spending from accumulated savings are wide.

        The excess savings estimates are based on the difference between the household saving rate in each quarter since the first quarter of 2020 and its average pre-pandemic level (2015-19). A positive value is considered to be “excess” saving in that quarter, and the sum of the quarterly values from the first quarter of 2020 onward corresponds to the cumulative stock of excess savings.1 There are large cross-country differences in excess savings levels, with these estimated to amount to more than 20% of disposable income in Canada in the third quarter of 2023 but less than 10% in Italy and the United States.

        While excess savings were built up in all the large advanced economies in the first year of the pandemic, the experience since then has varied widely. In particular, as shown in the latest OECD Interim Economic Outlook, households have run down excess savings to a greater extent in the United States than in other advanced economies (Figure 1, Panel B). This has helped private consumption to grow much more strongly in the United States than in these other economies, supporting faster GDP growth. Over the two years to 2023Q3, private consumption has grown by more than 4% in the United States, compared to just 1% in Japan and less than 2% in the euro area and the United Kingdom.

        There are several factors that help to account for these differences. The build-up of excess savings in the United States was largely driven by a succession of fiscal packages that included stimulus cheques, expanded unemployment insurance benefits and coverage and child tax credits (Abdulrahman and Oliveira, 2023). These boosted average household incomes substantially relative to their pre-pandemic levels. By contrast, in the euro area government assistance was mostly provided by job retention measures, maintaining workers’ pre-pandemic earnings. Excess savings were largely accumulated as a result of the reduction in spending opportunities, especially for in-person services (Battistini and Gareis, 2023). Thus, excess savings were to a greater extent initially accumulated by lower-income households in the United States than in Europe, with such households having a higher marginal propensity to consume than higher-income ones. In addition, the form and scale of the fiscal support in the United States may have meant that it was more likely to have perceived as a windfall gain. There is evidence that windfall gains are more likely to be spent than other savings (Arkes et al. 1994).

        Looking ahead, the saving rates in 2024-25 projected in the November 2023 OECD Economic Outlook (OECD, 2023) pointed to three main groups of economies: those in which households are projected to continue to run down excess savings (e.g. the United States); those where excess savings have yet to decline but are projected to do so (e.g. Australia); and those where excess savings are projected to continue to rise (e.g. Japan, the United Kingdom and much of the euro area).

        Figure 1. Estimated current stocks of household excess savings and projected changes in stocks

        Note: Based on gross household savings. Excess savings are the cumulated sum of quarterly saving flows since 2020Q1 relative to the levels that would have occurred if the saving rate had been equal to the average 2015-19 saving rate. Saving rates for Japan are estimated from 2021Q1 onwards.
        Source: OECD, Quarterly National Accounts database; and OECD calculations.

        One factor affecting the extent to which excess savings are spent is their distribution across the population. The estimated share of excess savings held by the top 10% of the income distribution rose from under 50% at the end of the first quarter of 2020 in the United States and the euro area to more than 75% and 67% respectively by the end of 2022 (Battistini et al., 2023). The propensity to spend out of wealth is generally higher at the bottom of the income distribution (Arrondel et al., 2015), so the shift in the distribution of excess savings towards better-off households implies that the economy-wide propensity to spend excess household savings will have declined over time. This makes a rapid rundown of excess savings less likely than otherwise.

        The proportion of savings held in liquid assets (currency and deposits) also tends to be higher for lower-income households (Bobasu et al., 2023). Thus, a shift in the distribution of excess savings towards higher-income households tends, other things equal, to lower the aggregate share of excess savings held in liquid form. Higher interest rates since early 2022, raising the opportunity cost of holding savings in deposits or cash, and the increase in the share of excess savings held by higher-income households help to explain the growing tendency for financial assets to be held in less liquid forms (Figure 2). This again reduces the likelihood that such savings will be spent.

        The simple estimation of excess savings using cumulative saving flows omits an additional factor that could affect spending behaviour: valuation changes on the financial and non-financial assets acquired by households via saving. Asset prices have experienced wide swings since the beginning of the pandemic, with the result that household net worth has sometimes moved quite differently to what would be expected on the basis of net saving flows. For example, the Federal Reserve’s estimates of changes in household net worth declined by $9.3 trillion between March and September 2022, whereas flows of saving during that period would have implied an increase of $0.3 trillion in the absence of valuation changes. Such asset price changes can also affect households’ ability and willingness to spend out of accumulated saving.

        Figure 2. Evolution of household wealth

        Percent of disposable income

        Note: liquid financial assets correspond to currency and deposit holdings.
        Source: Bank of Japan; Board of Governors of the Federal Reserve System; European Central Bank; Eurostat; and OECD calculations.

        References

        Abdulrahman, H. and L. Oliveira (2023), “The Rise and Fall of Pandemic Excess Savings”, Federal Reserve Bank of San Francisco Economic Letter 2023-11.

        Aladangady, A., D. Cho, L. Feiveson and E. Pinto (2022), “Excess Savings during the COVID-19 Pandemic,” FEDS Notes. Washington: Board of Governors of the Federal Reserve System, October 21, 2022.

        Alves, P. and C. Martínez-Carrascal (2023), “The Accrual and Use of the Excess Savings Built up by Spanish Households Since the Onset of the Pandemic”, Economic Bulletin – Banco de España, 2023/Q2.

        Arkes, H. et al. (1994), “The Psychology of Windfall Gains”, Organization Behavior and Human Decision Processes, vol. 59, pp.331-347.

        Arrondel, L., P. Lamarche and F. Savignac (2015), “Wealth effects on consumption across the wealth distribution: empirical evidence”, European Central Bank Working Paper Series, N° 1817.

        Battistini, N., and J. Gareis (2023), “Excess Savings: To Spend or Not to Spend”, ECB Blog, November 2, 2023.

        Battistini, N., V. Di Nino and J. Gareis (2023), “The Consumption Impulse from Pandemic Savings ‒ Does the Composition Matter?”, ECB Economic Bulletin, Issue 4.

        Bobasu, A., V. di Nino and C. Osbat (2023), “The impact of the recent inflation surge across households”, ECB Economic Bulletin, Issue 3/2023.

        Colabella, A., E. Guglielminetti and C. Rondinelli (2023), “The Distribution and Use of Italian Households’ Savings After the Pandemic”, Occasional Papers, Banca d’Italia, N°797.

        de Soyres, F., D. Moore and J. Ortiz (2023), “An update on excess savings in selected advanced economies”, FEDS Notes, Washington: Board of Governors of the Federal Reserve System, December 15, 2023.

        Klitgaard, T. and M. Higgins (2023), “Spending Down Pandemic Savings Is an ‘Only-in-the-U.S.’ Phenomenon”, Liberty Street Economics, Federal Reserve Bank of New York.

        OECD (2023), OECD Economic Outlook 114, November 2023, OECD Publishing, Paris.

        OECD (2024), OECD Interim Economic Outlook 115, February 2024, OECD Publishing, Paris.


        Making the grass greener: the role of firms’ financial and managerial capacity in paving the way to the green transition

        By Hélia Costa, Lilas Demmou, Guido Franco, Stefan Lamp

        The ambitious targets set by many OECD countries to become carbon neutral by 2050 require substantial investment. The European Commission estimates that relevant investment will need to be raised from an average of €683 billion per year to around €1,040 billion per year until 2030 (Lenaerts et al., 2021). According to the International Energy Agency, global energy investment will need to almost double to 4.5% of global GDP by 2030 and remain at this level until 2050. Furthermore, this investment will have to be shouldered mainly by the private sector, responding to market signals and policies set by governments (IEA, 2021).

        Green investment efforts to date however fall well short of the zero-emission scenario (ECB, 2023). Various factors may contribute to this. Particularly, financing investment in such technologies may be more difficult to obtain compared to other, more established, technologies, due to specific characteristics like high fixed costs and risk, or information asymmetries (De Haas and Popov, 2023). Investments in newer and riskier green technologies may also be deferred due to a lack of knowledge among firms regarding this specific type of investment and how to manage it effectively (De Haas et al., 2022).

        Against this backdrop, our new paper (Costa et al., 2024) delves into the factors holding back corporate green investment. The study places specific emphasis on the role of firm capacity, examining both financing constraints and weak green management practices, and their interaction with environmental policies. Our cross-country analysis focuses on the response to a survey of over 6.500 large, listed companies, which are more strictly regulated, across 33 countries between 2004 and 2020. This is complemented by a case study analysis based on disaggregated and comprehensive data available for Portuguese firms between 2010 and 2020. Our research aims to contribute valuable insights to boost green investments toward meeting the ambitious targets set for 2050.

        What determines corporate green investment?

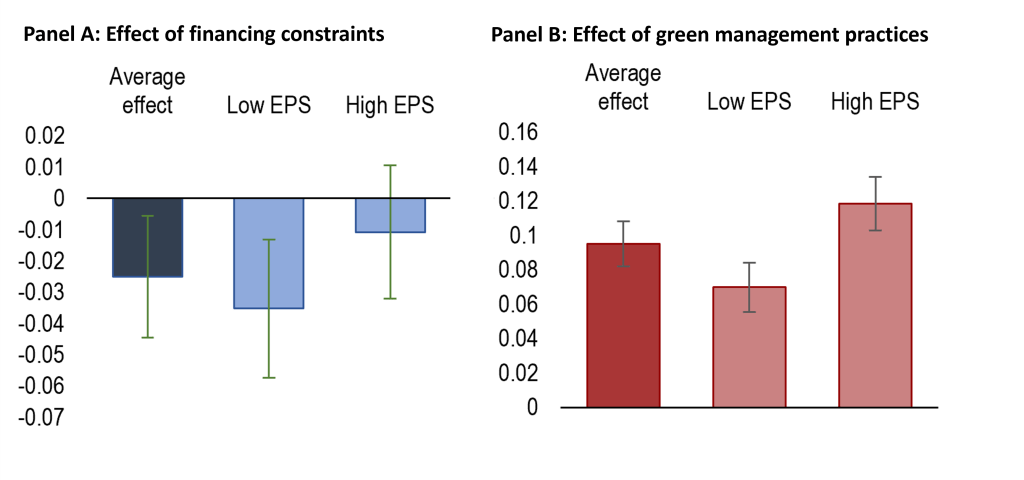
        Our cross-country analysis shows that in OECD countries both financing constraints and a lack of green managerial capacity reduce firms’ probability of investing in green technologies, leading to higher emission intensity. Specifically, becoming financially constrained increases a firm’s probability to invest by 2.5 percentage points, around 8% of the average probability (Figure 1, Panel A, first column). In turn, introducing a green management practice, for example by creating a team with green functions, is associated with an increase in the probability to invest (Figure 1, Panel B, first column).

        While it is known from previous research that all investment tends to respond negatively to financing constraints (Kalemli-Özcan et al., 2022), our case study shows that green investment is more elastic to financing conditions than other types of investment. Within green investment, we find that investment in integrated technologies is more sensitive to financing conditions than end-of-pipe solutions, possibly because it is performed less often and primarily to comply with regulation and its costs are less easily measured.

        How does firms’ capacity interact with policy?

        The impacts estimated are toned down in the presence of well-designed environmental policies. Specifically, stringent market-based environmental policies countervail the negative effects of financing barriers on green investment. This is possibly because such policies may incentivise firms to prioritise green investments which would otherwise not be undertaken due to financing constraints. In addition, the positive effect of green management practices is larger the more stringent non-market environmental policies are (Figure 1 Panel A) and the more generous public support is (Figure 1 Panel B). This indicates that green management capacity may help firms to deal with the complexity of non-market-based regulations and government support.

        Figure 1: Firm capacity and environmental policy jointly affect green investment

        Note: The bars represent the estimated coefficients and the green whiskers the 90% confidence intervals. Panel A: Financial constraints are firms within the highest quartile of the SAFE indicator at NACE2 rev.2 – year; Panel B: The indicator of green management practices is equal to 0-1-2 for firms adopting respectively 0, 1 or 2 green management practices (having a dedicated green team or providing green training to staff).
        Source: OECD calculations based on Refinitiv ESG data matched to Orbis 2004-2020.

        These results offer valuable insights for policy makers wishing to progress towards their decarbonization goal by promoting private investment. Our paper discusses a menu of policy options that may foster the green transition by upgrading firms’ capacity. These include actions to ease financing constraints both at the banking and equity market levels, and actions to improve monitoring tools such as ESG standards which help investors assess firms’ greenness and exposure to transition risks, as well as actions to improve environmental management, and complementary signals through strong and predictable climate policy.

        References

        Costa, H., Demmou, L., Franco, G., and S. Lamp (2024), “Making the grass greener: the role of firms’ financial and managerial capacity in paving the way to the green transition”, OECD Economics Department Working Papers, No. 1791)

        De Haas, R., Martin, R., Muûls, M., and H. Schweiger (2022), “Managerial and Financial Barriers during the Green Transition”, CentER Discussion Paper Nr. 2021-008

        De Haas, R. and A. Popov (2023), “Finance and Green Growth”, Economic Journal, Vol. 133/150, pp. 637-668

        ECB (2023), “Closing gaps to bend the trend: embedding the flow of finance in the transition”, Speech by Frank Elderson, State of the Union conference organised by the European University Institute, May 2023

        IEA (2021), “Net Zero by 2050 – A Roadmap for the Global Energy Sector”, October 2021

        Kalemli-Özcan, Ş., Laeven, L., & Moreno, D. (2022), “Debt overhang, rollover risk, and corporate investment: Evidence from the European crisis”, Journal of the European Economic Association, 20(6), 2353-2395

        Lenaerts, K., Tagliapietra, S.,  and G.B. Wolff (2021), “How much investment do we need to reach net zero?”, Bruegel Blog, 25 August