Mexico and the benefits of global value chains

By Elena Vidal and Alberto González Pandiella, OECD Economics Department

At the beginning of the 1990s, Querétaro, a state in central Mexico, was primarily known for its agriculture and small-scale industries. Many residents migrated to larger cities or the United States in search of better prospects. Today, Querétaro is a recognized hub for the aerospace industry. Thousands of jobs were created, and local talent has thrived thanks to partnerships between companies and local universities and technical schools.

The 1994 North American Free Trade Agreement (NAFTA) was crucial in this success story and triggered a transformation of the Mexican economy, which became deeply integrated into global value chains (GVCs), with exports as a share of GDP tripling between 1994 and 2023.  This success story is not without shadows and significant challenges remain.  Not all the states in Mexico benefited from the trade agreement equally, and Southern states lagged, contributing to the high inequalities seen in Mexico today (OECD, 2024). Disentangling backward and forward linkages shows also that Mexico’s GVC participation is mainly driven by backward linkages to GVCs, i.e., the share of foreign value added in Mexico’s total exports is large (Vidal and González-Pandiella, 2024). Conversely, Mexico’s forward participation, i.e., the share of Mexican value added embodied in foreign countries’ exports, is relatively low, (Figure 1). This reflects a strong specialisation in assembling processes and Mexico being a prime exporter of final goods assembled for the US manufacturing sector. Moving up in the value chain and developing stronger forward linkages would boost productivity and promote more and better remunerated formal jobs.

Figure 1. Mexico’s backward participation in global value chains is high and increasing while forward participation remains low
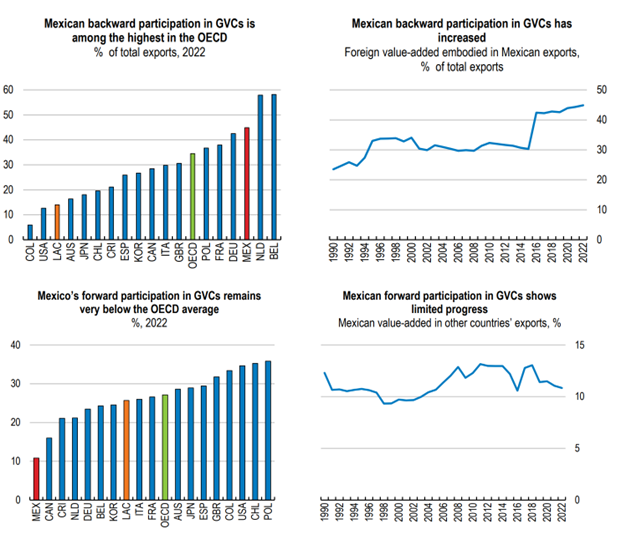
Note: LAC is an unweighted average of Chile, Colombia, Costa Rica, Argentina, Brazil, and Peru. Backward GVC participation corresponds to the foreign value added which is embodied in a country’s exports as a share of this country’ s total exports.
Source: UNCTAD-Eora Multi-Region Input-Output tables (MRIO) (1990-2017); and estimations (2018-2022).

Ongoing nearshoring trends provide historic opportunities to spread the benefits of integration into GVC to other regions in Mexico (González Pandiella and Maravalle, 2024). Nearshoring also holds the promise to improve supply chain linkages, shifting from low-cost assembling processes to higher value-added functions being carried out in Mexico. Identifying which public policies can help to grasp these opportunities is of upmost relevance at the current juncture, with a new government taking office in September 2024. According to our recent paper (Vidal and González-Pandiella, 2024), the following 5 public policies would help :

  1. Keep free trade agreements and maintain low tariffs. Mexico’s current trade policy stance of maintaining wide trade agreements and low trade tariffs is conducive to GVC participation. Seeking new trade agreements, especially in services, and enhancing trade integration with Latin America would also help to increase GVC participation.
  2. Improve infrastructure, logistics, and connectivity. This would particularly increase most remoted regions chances to integrate into GVCs.
  3. Increase investment in research and development (R&D).  This would boost firms’ local innovation activities and facilitate that higher value-added activities can also take place in Mexico.
  4. Improve the rule of law and the business environment.  This is essential for attracting foreign investment and encourage domestic entrepreneurship, as it reduces risks, uncertainties and costs associated with cross-border transactions.
  5. Increase female labour participation and enhance educational outcomes. Higher female labour market participation increases the pool of available talent and skills, allowing firms to tap into a more diverse workforce. This diversity can lead to a wider range of perspective and ideas, boosting firms’ innovation and adaptability and their ability to move to more sophisticated sectors and activities. By having a larger workforce equipped with relevant skills, companies can better manage risks associated with labour shortages or disruptions, enhancing the resilience of supply chains.

References:

OECD (2024), OECD Economic Surveys: Mexico 2024, OECD Publishing, Paris, https://doi.org/10.1787/b8d974db-en.

González Pandiella, A. and A. Maravalle (2024), “Harnessing nearshoring opportunities in Mexico by boosting productivity and fighting climate change”, OECD Economics Department Working Papers, No. 1799, OECD Publishing, Paris, https://doi.org/10.1787/0ca7fc0a-en.

Vidal, E. and A. González Pandiella (2024), “A review of Mexico’s participation in global value chains”, OECD Economics Department Working Papers, No. 1802, OECD Publishing, Paris, https://doi.org/10.1787/1ab1e52e-en.


Shifting sands: trade partner patterns since 2018

by Seung-Hee Koh, Catherine MacLeod and Elena Rusticelli

Global trade policy is undergoing a sea-change. The share of global merchandise imports subject to trade restrictions has risen particularly rapidly since 2018, initially due to a sharp increase in tariffs on bilateral trade between the United States and China. Since then, trade policy choices have steadily become more harmful to global trade in goods (Figure 1, Panel A). Trade policy uncertainty has also increased, alongside policy discussions about the re-location of value chains and ongoing changes in the design of national industrial policies. The latest OECD Economic Outlook (OECD, 2023) analyses trends in imports of manufactured goods across major OECD economies to understand what impact this has had on trade patterns.

So far, the increasing use of trade policies has coincided with a period of subdued world trade growth, but has not reduced global merchandise trade intensity (the ratio of trade in manufactures and commodities to GDP in volume terms). Nonetheless, since the global financial crisis, global trade intensity has risen only marginally, following a period of very sharp rises in the 1990s and early 2000s. The COVID crisis saw a shallower decline and faster rebound in merchandise trade intensity than the global financial crisis (Figure 1, Panel B). In 2022, global trade in goods was 22% of global GDP in volume terms, marginally higher than 2018.

The recent resilience of trade in volume terms may be linked to the huge increase in demand for goods during the COVID pandemic, as well as strong policy support during the pandemic and energy crises. Merchandise trade as a share of GDP generally rose in OECD countries between 2018 and 2022, including in Europe and Japan, offsetting a decline in Chinese merchandise trade intensity. However, merchandise trade intensity was relatively unchanged in the United States, where weak export growth offset a rise in import intensity.

Underneath the general rise in the value and volume of trade, imported manufactured goods at a country-level reveal important and differing shifts in the composition of manufactured goods imports since 2018 in the major economies (Figure 2). A particular issue of policy interest is the evolution of trade with geographically distant partners for key inputs (far-shoring) compared to trade with geographically closer trade partners (near-shoring).   

  • Shifting far-shoring: In the US, there have been sharp declines in China’s share of manufactured imports since 2018 – which have typically coincided with rising import shares from dynamic Asian economies. This includes goods where the 2018 tariffs are still applied. Evidence of near-shoring is limited, with Mexico and Canada’s share of imports rarely rising in the same categories where China’s share has fallen.
  • Expanding far-shoring: in the EU, China’s weight in manufactured imports has continued to grow steadily. In contrast to the US, this has been alongside rising import shares for dynamic Asian economies. As for the US, there is limited evidence of near-shoring: the share of imports from other OECD countries in Europe has fallen, largely driven by changes in import shares from the United Kingdom.
  • Changes at the margin: In Japan, the shifts in import shares have been much smaller than in the US or Europe. Its trade with the wider Asian region has increased steadily, although increases have been larger for dynamic Asia than China. As in Europe, this has been accompanied by a decline in the share of imports from other advanced economies.

So far, these shifts in trade patterns have occurred whilst aggregate trade has continued to expand broadly in line with global activity. However, in a global economy with slowing long-term growth prospects the economic costs of more harmful trade policies may become more evident over time.


References:

OECD (2023), OECD Economic Outlook, Volume 2023 Issue 1, OECD Publishing, Paris, https://doi.org/10.1787/ce188438-en.


Will the inflation genie escape the bottle? New evidence on globalisation, competition and inflation

By Dan Andrews, Peter Gal and William Witheridge, Economics Department

Markets and commentators are speculating that there may be a sustained pick-up in inflation in the United States, after years of subdued price pressures. Along with continued solid US jobs growth and low unemployment, there are tentative signs of higher wage growth and the fiscal stimulus will also boost short-term growth. Global growth is also getting stronger (OECD, 2018a).

As well as these recent developments, longer-term worldwide trends which have kept inflation generally low since the mid-1990s may also be reversing. In particular, globalisation appears to have stalled since the crisis, aggregate demand in strengthening and output gaps have closed or are generally close to zero in most major countries. Moreover, there is mounting evidence of rising market power in services sectors. Together, these trends risk letting the inflation genie out of the bottle.

Declining inflation in many countries over the past few decades at the same time as rising global competition has led to a debate on the importance of globalisation for domestic inflation. Auer, Borio and Filardo (2017) at the BIS have argued that rising GVC integration has accentuated the importance of global factors – particularly global economic slack – for domestic inflation. However, recent research at the ECB (Tagliabracci, Osbat and Koester, forthcoming) and at the US Federal Reserve (Yellen, 2017) has disputed this conjecture.

Figure 1 shows that global value chain (GVC) integration expanded significantly from 1995 until the crisis, while inflation remained relatively subdued. In the post-crisis period, GVCs flattened off and remained around the pre-crisis peak, while producer price inflation has fallen dramatically and remains very low on average across industries for our sample of countries.*

Figure 1

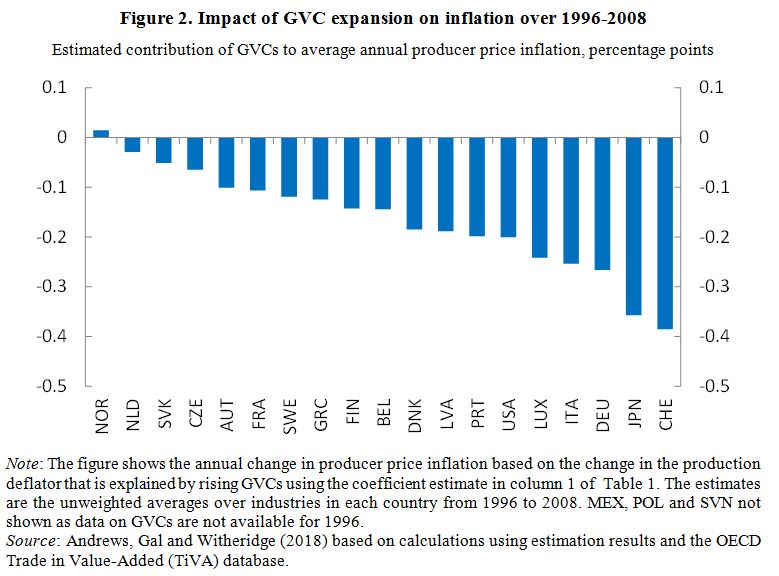
Motivated by this pattern, our new analysis of prices and globalisation (Andrews, Gal and Witheridge, 2018) goes beyond existing research by using recently released cross-country OECD data on prices and GVCs by industry, rather than at the country level, which allow us to control for time-varying country-specific and global shocks. We find that stronger Backward GVC Participation – that is, domestic producers relying more on foreign value added content – is associated with lower producer price inflation at the industry level. For example, we estimate that the rise in GVCs from the mid-1990s up to the crisis reduced annual producer price inflation by 0.15 percentage points on average, but this effect is more than double in some OECD countries (Figure 2).

Figure 2.JPG

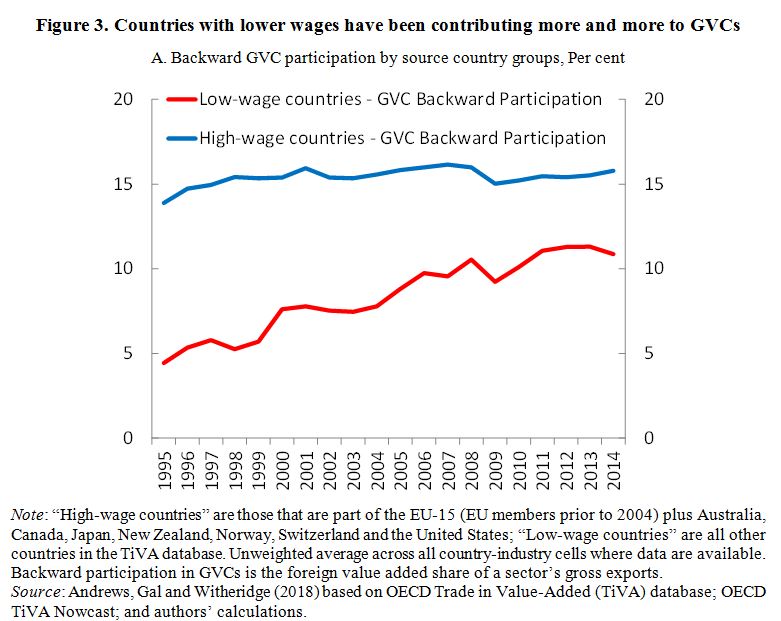
Confirming the existence of a cost-reduction and wage moderation channel, we also show that higher backward GVC participation is associated with lower wages and rising productivity in the importing countries and industries, especially when low-wage countries are integrated in their supply chains. This channel is likely to have contributed to lower inflation in recent years as the structure of the source (i.e. supplying) countries in GVCs has moved increasingly towards low-wage countries (Figure 3), despite a stall in the overall level of GVC integration (Figure 1). Therefore, inflation in advanced economies could remain low if the composition of GVCs continues to shift towards low-wage countries.

Figure 3.JPG

Moreover, we find that a high level of GVC integration can also dampen producer price inflation by accentuating the impact of global economic slack on domestic inflation. This provides new industry-level evidence to support the finding of Auer et al (2017) who use aggregate data covering the pre-crisis period. We show this by using a similar approach combining bilateral industry-level GVC and national output gap data to measure changes in global slack over time.

This implies that weak global demand has a larger disinflationary impact when GVC participation is higher. For example, given our sample of countries facing an average global output gap of -1.5 per cent in 2014, we estimate that annual producer price inflation was on average 0.25 percentage points lower in 2014 than for 1996 GVC levels. This figure is more than 0.5 percentage points, however, for countries that experienced a particularly large rise in GVC participation. But with slowing expansion of GVCs since the crisis, coupled with stronger aggregate demand and output gaps closing in most countries, this could lead to greater inflationary pressures in the medium term.

The third longer-term trend posing an upside risk to inflation is declining competition and market contestability. We exploit harmonised cross-country firm-level data to show an increasing trend in mark-ups, which suggests rising market power in services sectors (Figure 4). This upward trend in mark-ups is consistent with other estimates for the United States (De Loecker and Eeckhout, 2017) and other OECD countries (Calligaris et al, 2018). In turn, in these market services sectors we find a significant positive correlation between producer price inflation and mark-ups within industries since the early 2000s. This leads us to conjecture that if market power continues to rise it may pose a further risk to letting the inflation genie out of the bottle.

Figure 4.JPG
This analysis suggests that the expansion of GVCs facilitated by trade liberalisation and advances in technology has put downward pressure on producer prices, with potential implications for monetary policy. Looking forward, a continuation of the stalling globalisation observed since the crisis poses an upside risk to future inflation. This provides a further reason to resist the rising threat of trade protectionism in the global economy.

In addition, if more intense competition in product and labour markets contributed to global disinflation in over recent decades (Rogoff, 2003), then it follows that waning structural reform ambition (OECD, 2018b) – against the backdrop of strengthening global growth – could lead to inflationary pressures. Given the growing importance of ICT-based activities in the economy, as well as evidence of increasing market power in those industries, policy efforts to adapt anti-trust and pro-competitive market regulations to the digital age will not only bring benefits to long-run productivity growth but will also be desirable from a monetary policy perspective.

References:

Andrews, D.,  P. Gal and W. Witheridge (2018), “A Genie in a Bottle? Globalisation, Competition and Inflation”, OECD Economics Department Working Papers, No. 1462.

Auer, R., C. Borio and A. Filardo (2017), “The globalisation of inflation: The growing importance of global value chains”, BIS Working Papers, No. 602, January.

Calligaris, S., C. Criscuolo and L. Marcolini (2018), “Digital and market transformations”, OECD Science, technology and industry working papers, forthcoming.

De Loecker, J. and J. Eeckhout (2017), “The Rise of Market Power and the Macroeconomic Implications”, NBER Working Papers No. 23687.

* The sample of countries are: Austria, Belgium, Czech Republic, Denmark, Finland, France, Germany, Greece, Italy, Japan, Luxembourg, Latvia, Mexico, Netherlands, Norway, Poland, Portugal, Slovenia, Slovak Republic, Sweden, Switzerland and the United States.