The key role of food and energy inflation in shaping consumer confidence

By Patrice Ollivaud and Ben Westmore.

Consumption growth remains weak in OECD economies, despite buoyant real disposable income growth over the past two years (Figure 1, Panel A). Households in many countries are opting to save a greater proportion of their income and this accords with their lingering concerns regarding the economic environment. While consumer confidence is gradually recovering, it remains below long-term average levels in most economies (Figure 1, Panel B). So what have been the factors shaping consumer moods and can we expect their outlook to brighten in the near-term?

Figure 1. Private consumption has been sluggish despite strong real income gains
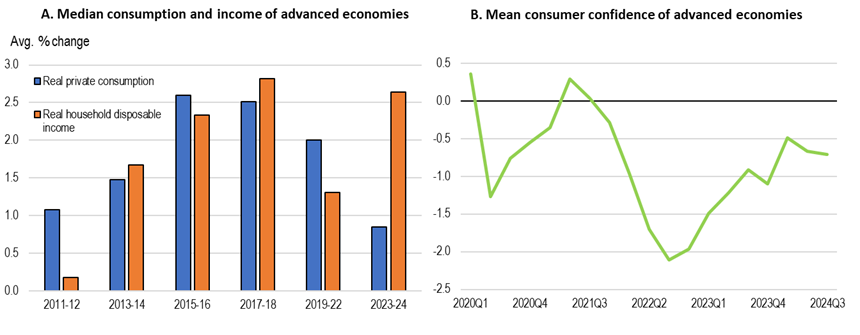
Note: Based on 28 advanced economies. In Panel A, median real disposable income and private consumption growth are based on the cross-country year-on-year growth rates of household disposable income and private consumption, respectively, deflated by the personal consumption deflator. In Panels B, consumer confidence data are standardised so that the long-term average and standard deviation are zero and one, respectively. The mean refers to a weighted mean using GDP in PPP as weights.
Source: OECD Economic Outlook 116 database; OECD Consumer Opinion Surveys database; and OECD calculations.

In the latest OECD Economic Outlook, this question is explored by estimating a panel model for seven OECD countries (France, Germany, Italy, Japan, Spain, the United Kingdom and the United States) over 2001-2024. The results highlight the extent to which consumer confidence is affected by inflation, along with several other aspects of economic conditions, including economic growth (proxied by the composite Purchasing Managers’ Index), the unemployment rate, interest rates and stock market values. In most of the countries in the sample, the model explains a significant proportion of changes in consumer confidence over the recent period.

However, the analysis suggests that not all types of inflation are equal in their impact on consumer sentiment. Food and energy inflation are found to have a particularly significant effect: the rise in food and energy inflation is estimated to explain three quarters of the decline in consumer confidence through the 2021-22 period in the average country in the sample. This accords with past findings that households can be more sensitive to price changes of frequently purchased items, such as groceries and energy (Anesti et. al. 2024; Binder and Makridis, 2022).

An implication of the empirical results is that a further decline in food and energy inflation could have a marked impact on consumer confidence and willingness to spend. Despite a recent decline in food and energy inflation, the level of food and energy prices relative to core consumer prices (excluding food and energy) still remains high compared with the pre‑pandemic period in the sampled countries (Figure 2, Panel A). For example, the ratio of food and energy prices to core prices in Germany in September 2024 was 16 percentage points above the level in December 2019.

An alternative model that seeks to explain the level of consumer confidence by developments in this price ratio, along with the other important economic variables from the above specification, finds the price ratio to be statistically significant (Ollivaud and Westmore, 2025). This allows a calculation of the estimated increase in consumer confidence if the price of food and energy relative to core consumer prices were to return to the pre-pandemic level. In Germany and France, such a decline could return standardised consumer confidence to around its long-run average level (Figure 2, Panel B). In contrast, the same scenario is estimated to push consumer confidence substantially above its long-run average in Italy and Spain. This reflects the comparatively high level of confidence in these countries already, helped by recent declines in their unemployment rates, larger falls in long-term interest rates over the past year and, for Spain, relatively strong economic growth. For the United States, the positive impact on consumer confidence of a retracing of the ratio of food and energy prices relative to core consumer prices is estimated to be more muted, owing to the comparatively low starting point of the price ratio in that country. Nonetheless, the results overall suggest consumer moods in many countries could brighten significantly if further falls in food and energy price inflation were to occur.

Figure 2. Further declines in the price of energy and food relative to core items would boost consumer confidence
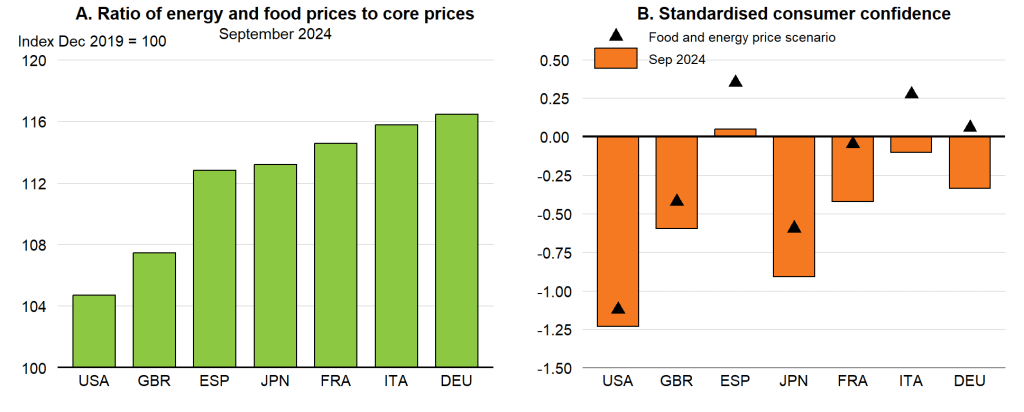
Note: The ratio of (energy and food)/core prices is based on the personal consumption expenditure price index for the United States, harmonised index of consumer prices for euro area member states and the United Kingdom, and national consumer price indices for Japan. In Panel B, consumer confidence data are standardised so that the long-term average and standard deviation are zero and one, respectively. The “food and energy price scenario” assumes that the ratio of (energy and food)/core prices reverts to its level in December 2019, with the estimates based on coefficient estimates from a model that regresses the level of standardised consumer confidence on a lagged dependent variable, the ratio of food and energy prices to core prices, the composite PMI, long-term interest rates, the unemployment rate and the COVID Stringency Index. All variables are estimated to be statistically significant with the expected sign under this specification.
Source: Bureau of Economic Analysis; Eurostat; Statistics Bureau of Japan; OECD Consumer Opinion Surveys database; and OECD calculations.

References

Anesti, N. et. al. (2024), “Food prices matter most: sensitive household inflation expectations”, CFM Discussion Paper, No. CFM-DP2024-34, London School of Economics.

Binder, C. and C. Makridis (2022), “Stuck in the Seventies: Gas Prices and Consumer Sentiment”, Review of Economics and Statistics, Vol. 104, No. 2.

OECD (2024a), OECD Economic Outlook, Volume 2, December 2024: Resilience in Uncertain Times, OECD Publishing, Paris.

OECD (2024b), OECD Economic Outlook, Interim Report September 2024: Turning the Corner, OECD Publishing, Paris.

Ollivaud, P. and B. Westmore (2025), “Decomposing the Vibe: Exploring the Recent Drivers of Consumer Confidence”, OECD Economics Department Working Papers, forthcoming.



Restoring growth

Economic Outlook November 2023 cover image

by Clare Lombardelli, OECD Chief Economist

Inflation is easing, but growth is slowing. The tightening of monetary policy needed to tackle inflation is taking effect. Despite stronger-than-expected GDP growth in 2023, tightening financial conditions, weak trade, and subdued confidence are taking a toll. Housing markets and bank-dependent economies, particularly in Europe, are feeling the impact.

The pace of growth is uneven. Emerging markets are generally faring better than advanced economies. Europe’s growth lags behind North America and major Asian economies. Inflation, while easing, remains a concern.

We are projecting a soft landing for advanced economies, but this is far from guaranteed. The relationship between inflation, activity and labour markets has changed, making the full impact of monetary policy tightening hard to judge. In the United States, the economy is demonstrating more strength than expected, and there is a risk that inflation proves to be persistent. In the euro area, the full impact of tighter monetary policy is still to appear and activity may be hit more strongly than we expect.

Many emerging markets have shown considerable resilience over the past year, but countries characterised by structural debt vulnerabilities have come under market scrutiny.

Global trade is weak. Not only cyclical, but also structural factors are causing a slowdown in the rate at which value chains are integrating across countries. Opportunities for growth, particularly from greater services trade, are being missed. We must revive global trade. Resilience in global value chains is best delivered by diversification, not by protectionism and inward-looking policies.

In many countries, fiscal pressures are mounting. Demographic changes, decarbonisation, and a combination of rising interest payments and slow growth mean countries face a challenging fiscal outlook. Governments need to take bold action to reduce such pressures and give a greater focus to growth in their policy making. That means reforming labour market and pensions policies, increasing competition, and using fiscal levers to increase human capital and productivity enhancing investment, including the investment needed to deliver the green transition.

In summary, the global economy is grappling with inflation, slowing growth, and mounting fiscal pressures. Policymakers must prioritise macroeconomic stability, structural reforms, smart fiscal policies and international cooperation to foster sustainable and inclusive growth.

For more info and data visit: www.oecd.org/economic-outlook/november-2023/

References

OECD (2023), OECD Economic Outlook, November 2023: Restoring Growth, OECD Publishing, Paris


Rétablir la croissance

Economic Outlook November 2023 cover image

Clare Lombardelli, Cheffe économiste de l’OCDE

L’inflation s’atténue, mais la croissance ralentit. Le resserrement des politiques monétaires nécessaire pour lutter contre l’inflation produit ses effets. Malgré une croissance du PIB plus forte que prévu en 2023, le durcissement des conditions financières, la faiblesse des échanges et la confiance en berne pèsent sur l’activité. Les marchés du logement et les économies tributaires des banques, notamment en Europe, en ressentent les effets.

Le rythme de la croissance est inégal. Les économies de marché émergentes connaissent globalement une situation plus favorable que les économies avancées. La croissance est moins rapide en Europe qu’en Amérique du Nord et dans les grandes économies d’Asie. L’inflation, bien qu’en recul, reste préoccupante.

Nous prévoyons un atterrissage en douceur pour les économies avancées, mais cette issue est loin d’être garantie. La relation entre l’inflation, l’activité et les marchés du travail a changé, si bien qu’il est difficile d’évaluer pleinement l’impact du resserrement des politiques monétaires. Aux États-Unis, l’économie se révèle plus dynamique que prévu, et il existe un risque que l’inflation s’avère persistante. Dans la zone euro, les effets du durcissement de la politique monétaire ne se sont pas encore pleinement matérialisés, et l’activité pourrait être plus fortement touchée qu’on ne l’anticipe.

Nombre d’économies de marché émergentes ont fait preuve d’une résilience considérable au cours de l’année écoulée, mais les pays présentant des vulnérabilités liées à leur endettement structurel sont maintenant surveillés de près par les marchés.

Les échanges mondiaux manquent de dynamisme. Des facteurs non seulement conjoncturels, mais aussi structurels entraînent un ralentissement de l’intégration des chaînes de valeur entre pays. Des opportunités de croissance, liées en particulier à une augmentation des échanges de services, sont inexploitées. Nous devons relancer le commerce mondial. Pour développer la résilience des chaînes de valeur mondiales, il s’agit de promouvoir plutôt la diversification que le protectionnisme ou des politiques de repli sur soi.

Graph showing trade growth has stalled

Les tensions budgétaires s’accentuent dans de nombreux pays. Compte tenu des évolutions démographiques, de la décarbonation ainsi que de la combinaison d’un alourdissement des charges d’intérêts et d’une croissance lente, les pays sont confrontés à des perspectives budgétaires difficiles. Les gouvernements doivent prendre des mesures audacieuses pour réduire ces pressions et mettre l’accent davantage sur la croissance dans l’élaboration de leurs politiques. Cela signifie qu’il faut réformer les politiques du marché du travail et les systèmes de retraite, intensifier la concurrence et actionner les leviers budgétaires pour accroître les investissements susceptibles de renforcer le capital humain et la productivité, notamment les investissements nécessaires à la transition écologique.

En résumé, l’économie mondiale est aux prises avec l’inflation, le ralentissement de la croissance et la montée des tensions budgétaires. Les décideurs publics doivent donner la priorité à la stabilité macroéconomique, aux réformes structurelles, aux politiques budgétaires intelligentes et à la coopération internationale, pour favoriser une croissance durable et inclusive.

Pour plus d’infos et de données: https://oe.cd/PE-nov23

References

OECD (2023), Perspectives économiques de l’OCDE, Volume 2023 Numéro 2, OECD Publishing, Paris,OECD


On the path to the top league: sustaining Croatia’s convergence

By Tim Bulman, OECD Economics Department

Croatia, with a population of four million and independent as of three decades ago out-performs in many fields. The successes of its sports teams and of its leading athletes, and the beauty of its natural landscapes and the cities and islands along its sparkling coastline are well known. It is now aiming to achieve similar renown for its economy and quality of life.

An ambitious programme of reforms and investments over the past decade are bearing fruit and Croatia is advancing up the league tables. The economy is expanding and diversifying, generating jobs and raising incomes, and making poverty increasingly rare. The country navigated the COVID-19 and energy price shocks well, achieving robust rebounds in output and employment. The quality of the environment and of public services has improved, contributing to a markedly more optimistic outlook among younger generations. The country is also becoming increasingly attractive to immigrants. Croatia’s integration into the euro- and Schengen areas at the start of 2023 is recognition of these changes and strengthens the base for continued progress.

Indeed, strong progress will need to continue if Croatia’s is to move to the top of the league tables. For future generations to enjoy the incomes of the average OECD country, the economy will need to expand by 3% annually on average for the next thirty years, at the same time as it addresses the twin challenges of climate change and population ageing. The 2023 Economic Survey of Croatia, the first prepared by the OECD and which is being launched in the context of Croatia’s accession process to the OECD, identifies three groups of policy actions that can enable Croatia to build its form.

Robust growth will need to continue for Croatia to converge with OECD incomes

GDP per capita, 2015 prices and PPPs, thousand USD                                  


Made with Flourish

Note: ‘Peers’ is the unweighted average of Czech Republic, Hungary, Slovak Republic, and Slovenia.
Source: OECD Annual National Accounts (database).

Ensure public finances and prudential supervision support sustainable growth

Inflation is abating only gradually from its surge in 2022, when it peaked at 13.0% year-on-year in November, the highest rate since the 2000s. The labour market is tight, and employers report growing recruitment challenges. Meanwhile integration into the euro- and Schengen-areas are adding to demand from exports and investment, while banks have increased lending capacity. The government plans to shift the budget from a modest surplus in 2022 to a small deficit in 2023 and a larger deficit in 2024, further adding to demand pressures.

Avoiding fiscal stimulus while inflation remains high would ensure fiscal policy is counter-cyclical, and help inflation in Croatia return to the level of its peers. Vigilantly monitoring banks’ new lending can support macroeconomic stability.

Consumer prices are still rising faster than in the euro area

Consumer price inflation, year-on-year


Made with Flourish

Note: ‘Peers’ is the unweighted average of Czech Republic, Hungary, Slovak Republic, and Slovenia.
Source: OECD Price Statistics database.

Support a more dynamic business environment where productive firms can grow

Croatia has a lively start-up scene, and many new firms are relatively productive. But they grow less than in other countries. Instead, entrenched, lower-productivity firms dominate much of the business sector. Many firms’ lagging productivity reflects low investment, especially foreign direct investment that brings new technologies, and investment in digitalisation and more innovative management.

Firms identify the time and resources spent on complying with regulations as a major constraint. Continuing to review, streamline and simplify regulations, and closely monitoring whether regulatory burdens are indeed diminishing can ensure progress.

In practice, businesses report that complying with regulations is burdensome


Made with Flourish

Many legal disputes remain slow to resolve, despite some recent gains, and many businesses report a lack of confidence in the legal system. Efforts to develop alternative dispute resolution, digitalise legal processes and better communicate legal decisions can help.

State-owned enterprises (SOEs) continue to play an over-sized role in Croatia’s economy, but many under-perform in how well they use their assets and workers and in the quality of the goods and services they deliver. Making SOE governance, arms-length from the government and more transparent about performance and returns can help. Listing state-owned enterprises where there is not a core justification for government ownership can also boost the firms’ performance and the dynamism of Croatia’s economy.

Strengthen skills and activate those out of the workforce to raise incomes and inclusiveness

Croatia’s growing and increasingly diverse economy requires ever higher levels of workforce skills. Many workers have solid intermediate skills, but investors report difficulties hiring higher-level skills. A big push to improve adult education can help. The strong take-up of a new adult education voucher scheme demonstrates that demand exists for a well-designed system, i.e. one that identifies workers’ skill needs, adapts to their schedules and circumstances, and is affordable.  Better connecting school and vocational education with employers’ current and future needs would better prepare students for a dynamic economy.

Addressing barriers to adult education can raise participation


Made with Flourish

Alongside raising skills, a relatively large share of Croatia’s younger and older adults is not in the labour force. These people are among those most at risk of poverty. Many have few skills and little experience of working formally. Tailored activation services that develop skills and offer work experience can enable them to move into lasting jobs. Lagging areas with few opportunities are likely to need extra policy attention. Assisting older adults stay in work longer would help ensure they can enjoy adequate incomes and quality of life in retirement.

Croatia’s reform and investment programme reflects its ambitions. Full implementing these efforts will take ongoing effort and energy. The benefits of graduating to the top league will be well worth the effort.


How widespread has the rise in unit profits been?

Compass pointing to profits

By Geoff Barnard and Patrice OllivaudOECD Economics Department

In an earlier post on this blog, the decomposition of GDP inflation (year-on-year increases in the GDP deflator) into contributions from unit profits, unit labour costs and unit net taxes across a range of OECD economies was discussed, drawing on an exercise described in the most recent OECD Economic Outlook (OECD, 2023). While informative, the economy-wide picture of unit profits leaves open the policy-relevant question of whether the increase in profits has been widespread across the economy or concentrated in only a few industries.

To get insights about where and by how much profit margins may have increased as inflation rose, information is needed on how an economy-wide increase in profits is distributed across firms. One approach is to use firm-level data. The evidence from this work is mixed. Colonna et al. (2023) find that margins rose in the United States and in non-tradeable sectors in Germany, and returned to pre-pandemic levels in Italy after an earlier decline. Weber and Wasner (2023), using US firm-level data, argue that rising prices after the first phase of the COVID-19 pandemic were mainly the result of market power and implicit agreements between large firms. In contrast, Glover et al. (2023) suggest that the rise of mark-ups in the United States during 2021-22 was due to firms anticipating future cost increases rather than an increase in monopoly power or higher demand. And Bijnens et al. (2023) find no evidence of a widespread opportunistic raising of profit margins in 2022 among firms in Belgium.

Another possible angle is to look at profits by sector. Doing this for the 13 OECD commodity-importing economies that produce timely data on a comparable basis, and computing unit profit as value added minus labour compensation, suggests that a disproportionate part of the observed increase of unit profits in 2022 came from mining and utilities: that is, mining and quarrying together with electricity, gas and water supply (Figure 1, Panel A). This sector accounts for only about 4% of the average economy but more than 40% of the rise of unit profits in 2022 as a whole in this group of commodity-importing countries. For these countries, this likely corresponds mainly to electricity and gas supply, including renewable electricity producers, who did not suffer from higher costs as fossil fuel prices soared, but benefited from higher retail prices. On the other hand, this effect was far from uniform across countries. Neither Germany nor France (Panels C and D of Figure 1) had a large increase in mining and utilities unit profits until late in 2022 or early 2023, when fossil fuel prices were turning down. In the case of the United Kingdom (Panel F), most of the increase in unit profits’ contribution to GDP inflation from negative values in early 2021 to above 5% in the fourth quarter of 2022 corresponded to a swing in unit profits in services, although other sectors, including mining and utilities, also contributed.

Figure 1. Mining and utilities account for a substantial share in the increase in unit profits

Contribution of unit profits to year-on-year GDP inflation

Note: Unit profits based on estimated sectoral gross operating surplus in current values. The latter is computed as sectoral output minus sectoral compensation and an estimate of unit taxes (based on the value at the macroeconomic level in percent of GDP applied to sectoral GDP) and reconciled so that the sum across sectors equals the macroeconomic level. OECD commodity importers correspond to a simple average of Austria, Belgium, Denmark, Finland, France, Germany, Greece, Ireland, Italy, the Netherlands, Spain, Sweden and the United Kingdom.

Source: OECD Quarterly National Accounts database; and OECD calculations.


On a quarterly basis, the contribution of other sectors to the rise of unit profits in the group of commodity-importing countries as a whole gradually increased through 2022 and into the first quarter of 2023, with stronger effects from both services and (through end-2022) manufacturing. Considering the small share of agriculture in the economy (less than 2% for the euro area), the contribution of unit profits in this sector to the overall unit profit contribution to GDP inflation is also notable. Thus, while the increase in unit profits (and thus the contribution to inflation) has been widespread across sectors in commodity-importing OECD economies, and while the details vary significantly across individual countries, the disproportionate rises in mining, utilities and  agriculture suggest some strong sector-specific effects.

Among OECD commodity exporters, there is only one country, Norway, with the necessary sector data on a comparable basis, so this is the only source of information on sectoral developments of unit profits for this group of countries. As expected, the bulk of the large increase in unit profits in Norway in 2022 came from mining and utilities (Figure 1, Panel B), with the contribution of unit profits to GDP inflation plummeting from 2022Q4 because of the global fall in energy prices.

Overall, there is evidence from available cross-country sectoral profit data that the surge in energy prices and the associated increase in the profits of energy and utility providers over 2021-22 played an important role in the widespread rise in the aggregate contribution of unit profits to GDP inflation. The strong rise in international food commodity prices also appears to have helped push up unit profits in agriculture in many countries, although the small size of that sector means that the impact on economy-wide profits was generally limited. The sectoral data indicate, however, that the size, timing and distribution of the increase in unit profits, and thus of their contribution to GDP inflation, varied quite widely across OECD economies – no single story fits all countries.

References

Bijnens, G., C. Duprez and J. Jonckheere (2023), “Are price hikes in Belgium being driven by greed?”, National Bank of Belgium blog, 26 June 2023.

Colonna, F., R. Torrini and E. Viviano (2023), “The Profit Share and Firm Mark-up: How to Interpret Them?”, Occasional Papers, Banca d’Italia, No. 770.

Glover, A., J. Mustre-del-Rìo and A. von Ende-Becker (2023), “How Much Have Record Corporate Profits Contributed to Recent Inflation?”, Economic Review, Federal Reserve Bank of Kansas City.

OECD (2023), OECD Economic Outlook, Volume 2023 Issue 1, OECD Publishing, Paris.

Weber, I. and E. Wasner (2023), “Sellers’ Inflation, Profits and Conflict: Why can Large Firms Hike Prices in an Emergency?”, Economics Department Working Paper Series, University of Massachusetts Amherst.


Inflation factors: how returns to capital and labour have contributed to domestic inflation pressures

By Geoff Barnard and Patrice Ollivaud, OECD Economics Department

With the upsurge in inflation in 2021-22 in many countries creating a cost-of-living crisis, there has been much interest in whether this is mainly attributable to firms securing higher profits, to higher wages (pushing up unit labour costs), or to some combination of the two (OECD, 2023).

The data needed to estimate the impact of changes in unit profits, unit labour costs and unit taxes on consumer price indices are not generally available directly, although attempts to get around this constraint have been made for some countries (e.g. Diev et al. (2019), for core CPI inflation, Haskel (2023) for headline CPI inflation and Hansen et al. (2023) for the consumption deflator). The breakdown can, however, be directly calculated for GDP inflation (i.e. changes in the GDP deflator). This is not the same as consumer price inflation, as the composition of household consumption differs from that of domestic output. Many OECD economies are net importers of fossil fuels and food, and energy and food prices increased dramatically in 2021-22. In these countries, consumer prices increased by much more than the GDP deflator over that period. Conversely, for oil and gas exporters, the prices of goods produced domestically and then exported rose rapidly, pushing GDP inflation above headline consumer price inflation. A decomposition of GDP inflation thus gives only a partial picture of the contribution of profits and labour costs to headline consumer price inflation. Nevertheless, GDP inflation is an indicator of domestically generated inflation, and can shed light on the extent to which headline inflation is domestically generated or imported.

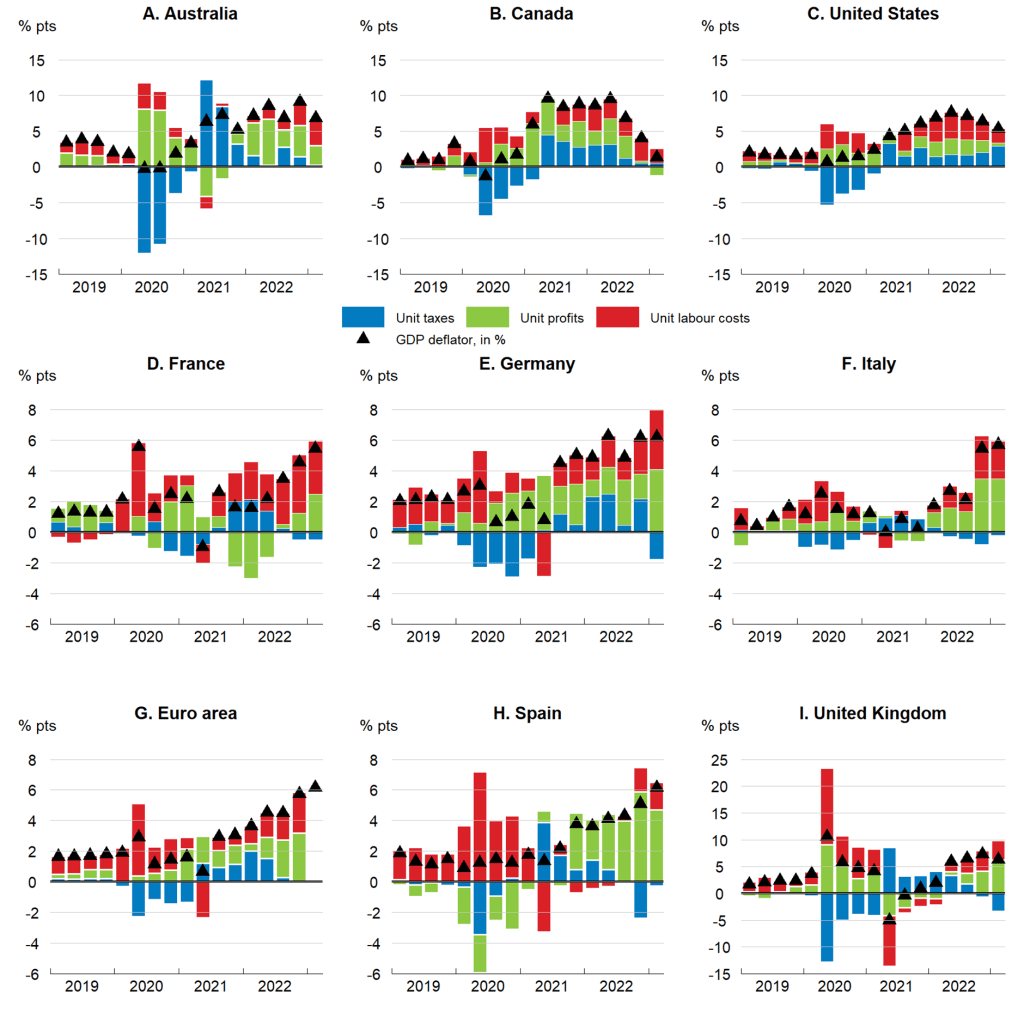
The decomposition of GDP inflation since 2019 for three commodity-exporting OECD economies (Australia, Canada and the United States) and six commodity importers is shown in Figure 1. As expected, the commodity exporters experienced higher GDP inflation over 2021-22 than the commodity importers. A number of facts emerge from the decomposition exercise:

  • In the United States and Canada, the contribution from unit profits widened during most of 2021-22 as GDP inflation was rising but has fallen back as GDP inflation waned in late 2022 and the beginning of 2023. In Canada the contribution of unit profits turned negative in Q1 2023.
  • For most of the large European economies, by contrast, GDP inflation was still rising into 2023, and the contribution of unit profits also increased in Q1 2023.
  • The contribution from unit labour costs has recently risen in Australia, the euro area (including France, Germany and Italy) and the United Kingdom, whereas it was moderating in the United States and Canada in the first part of 2023.
  • While it is usually stable and small, the contribution from unit taxes was particularly volatile following the COVID-19 shock, reflecting pandemic-related subsidies that have subsequently been phased out and changes in the composition of expenditure, particularly household consumption.

Figure 1. The contribution to inflation from both unit profits and unit labour costs has increased recently in many countries

Contribution to year-on-year GDP inflation

Note: A small statistical discrepancy between the sum of the components and the GDP deflator is not shown. Unit taxes correspond to taxes on production net of subsidies per unit of real GDP; unit profits to gross operating surplus per unit of real GDP; and unit labour costs to compensation of employees per unit of real GDP. The published gross operating surplus data include mixed income, which incorporates the income of the self-employed. The calculations in this figure adjust the published gross operating surplus data by allocating part of self-employment incomes to unit labour costs, based on the assumption that the self-employed receive on average the same compensation per head as employees. For the euro area, the data necessary for calculating the contribution of unit profits, unit labour costs and unit net taxes to GDP inflation were not yet in the OECD Quarterly National Accounts database when this post was written.

Source: OECD Economic Outlook 113 database; OECD Quarterly National Accounts database; and OECD calculations.

The combination of rising unit labour costs and rising unit profits seen in 2021-22 for many economies is relatively unusual. Over the two decades prior to the pandemic, there was typically a negative relationship between unit profits and unit labour costs, with increases in one being partially absorbed by falls in the other. This relationship has weakened of late, with the median correlation amongst 17 OECD countries shrinking from -0.6 over the period 2000-19 (using quarterly data) to -0.2 during 2021-22, similar to the value for the decade 1971-81, another period characterised by large energy and food price shocks. This suggests that a period of rising input cost inflation may be conducive to unit profits and unit labour costs rising together, at least in nominal terms.

The decomposition of GDP inflation does not allow definitive conclusions to be drawn about firms’ profit margins or changes in market power, which have been the focus of much of the debate about what has driven the rise in inflation. An increase in unit profits (profits per unit of value added) does not necessarily entail higher profit margins (profits as a proportion of sales) as the increase of input costs (including intermediate consumption) can result in profits per unit of value-added moving differently to profits on gross sales (Colonna et al., 2023). And an economy-wide increase in unit profits does not provide any information about how that increase is distributed across sectors or firms.[1]

The evolution of the share of profits in GDP does, however, offer some indirect evidence that aggregate profitability has risen over the past few years. In most advanced economies, the ratio of the gross operating surplus to GDP in 2022 was higher than in 2019 (Figure 2), implying that unit profits rose faster than GDP inflation over this period.

Figure 2. The share of profits in GDP increased in most countries between 2019 and 2022

Gross operating surplus

Note: The calculations in this figure adjust the published gross operating surplus data by removing the part of self-employment incomes that is estimated to reflect labour compensation rather than profits. This is done using the assumption that the self-employed receive on average the same labour compensation per head as employees.

Source: OECD Economic Outlook 113 database; OECD Quarterly National Accounts database; and OECD calculations.

For most OECD economies, projections in the June 2023 Economic Outlook imply that the qualitative pattern that characterised the upsurge in inflation in 2021-22 will be reversed over the next 18 months: real wages will begin to recover – they are projected to be higher in the final quarter of 2024 than in the corresponding quarter of 2022 in all the G7 economies – and labour’s share of national income will rise even as inflation falls back: both headline and core inflation are expected to ease in 2024 in all G7 economies. Implicitly, part of the increase in labour income is being met from profits, with the non-labour share of national income declining.

References

Diev, P., Y. Kalantzis and A. Lalliard (2019), “Why Have Strong Wage Dynamics Not Pushed Up Inflation in the Euro Area?”, Bulletin de la Banque de France, 225/6, September-October.

Hansen, N., F. Toscani and J. Zhou (2023), “Euro Area Inflation after the Pandemic and Energy Shock: Import Prices, Profits and Wages”, IMF Working Papers, No. 2023/131.

Haskel J. (2023), “What’s Driving Inflation: Wages, Profits, or Energy Prices?”, Bank of England, Speech given at Peterson Institute for International Economics, Washington DC, 25 May.

OECD (2023), OECD Economic Outlook, Volume 2023 Issue 1, OECD Publishing, Paris.


[1] A subsequent ECOSCOPE post will discuss evidence on the sectoral breakdown of unit profit contributions to GDP inflation.


What is driving the spike in inflation dispersion in the euro area and how should policy react?

By Pierre Beynet and Antoine Goujard, OECD Economics Department

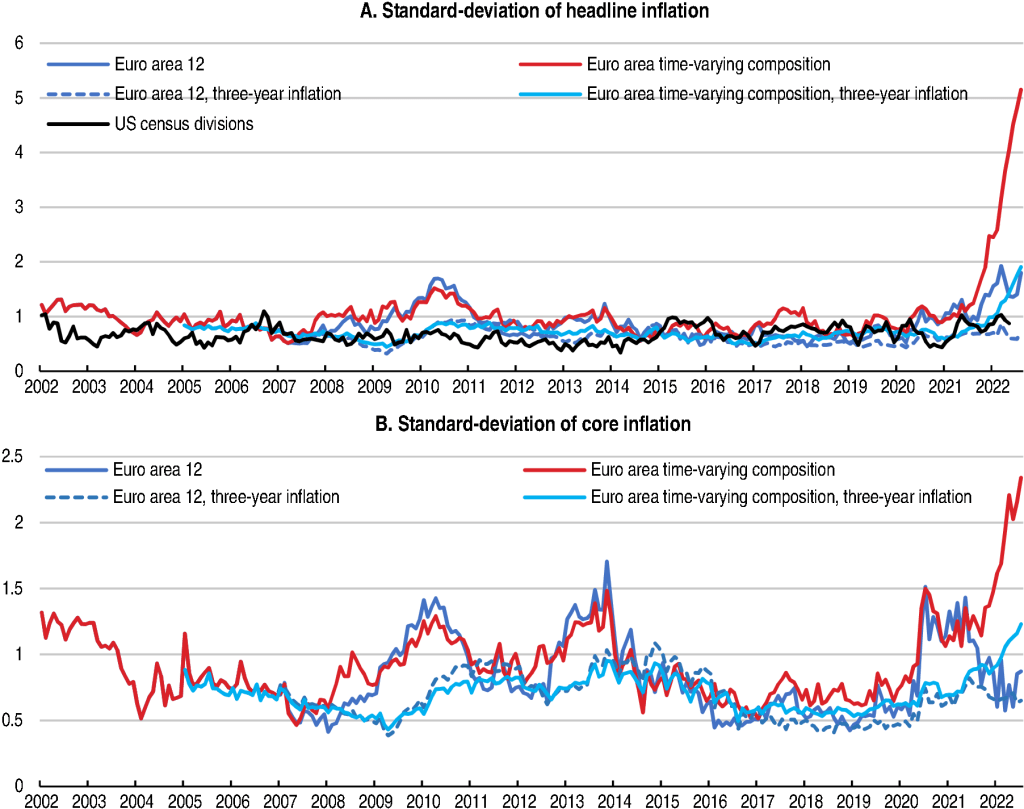
Inflation in the euro area has kept surprising on the upside, creating a significant challenge for macro-economic policy in a context of weakening growth prospects. In addition, the dispersion of inflation is at an all-time high. In August 2022, headline inflation ranged from 6.5% in France to 25.2% in Estonia (Eurostat, 2022). Inflation spreads had already been widening since the start of the COVID-19 pandemic and the asymmetric impact of the surge in energy, commodity and food prices is further adding to this dispersion (Figures 1 and 2).

Inflation dispersion will make it even more difficult to ensure an efficient transmission of monetary policy across member states and to guarantee an effective coordination between monetary and fiscal policies. Combined with the asymmetric impact of potential shocks, such as further energy and commodity price hikes, this could lead to diverging economic trajectories if monetary policy, which is set at the euro area level, remains too loose for countries with very high inflation while it becomes too tight for countries with relatively low inflation rates (see for example Aksoy et al., 2002). In contrast, until 2019, inflation differentials had been relatively small across euro area countries and roughly in line with those across US census divisions or metropolitan areas (Figure 2; ECB, 2021; Darvas and Wolff, 2014).

Figure 1. Headline inflation in the euro area, July 2022

Note: Contributions to year-on-year harmonised price inflation are calculated as described in OECD (2022) using national price inflation indices.
Source: Eurostat and OECD calculations; OECD (2022), OECD calculation of contributions to overall annual inflation.

A first reason for these divergences in inflation rates is the differentiated impact of the COVID-19 crisis. The peak of the pandemic in 2020 resulted in very low prices that varied greatly across countries, leading to strong base effects when prices started to increase again. The different speeds of the reopening of European economies after various lockdowns triggered by the pandemic have also mechanically increased the spread of inflation rates over 2021-22. Looking at the 3-year annualised change instead of the usual 1-year change, the recent increase in the standard deviation appears less striking (Figure 2).

A second reason is the diverging effects of energy and commodity price spikes (Figure 1) (Boone and Elgouacem, 2021; Blake and Bulman, 2022; EC, 2022). Retail energy prices increased by close to 40% over the year from August 2021 to August 2022 in the euro area. The share of energy in each country’s harmonised price index ranges from 6.7% in Malta to 16.2% in Latvia, with typically larger shares in Baltic and Eastern European countries. Similar differences exist for food. Moreover, the energy mix differs across countries, as does the extent of emergency price policies in reaction to the price spikes (Bethuyne et al., 2022).

Third, the current elevated level of dispersion reflects widening spreads in core inflation (Figure 2). While the standard deviation of core inflation rates across the euro area is broadly in line with its 2005-19 average for the initial EA-12 countries in July 2022, it was 156% above once Baltic and Eastern European countries are included. This is due to the different behaviours of both services’ and industrial goods’ prices (Figure 3), reflecting different impacts from supply disruptions and national labour markets.

Figure 2. Dispersion of headline and core inflation in the euro area

Note: Euro area 12 is the standard deviation across the 12 initial euro area countries. The time-varying composition is the standard deviation across (time-varying) euro area countries. The standard deviations are unweighted. For the USA, the series represents the unweighted standard deviation across the nine US census divisions in 2019-22, back casted over 2002-18 using the standard deviation across the four census regions.
Source: Eurostat, BLS and OECD calculations.

Figure 3. Core inflation in the euro area, July 2022

Note: Contributions to harmonised price inflation are calculated as described in OECD (2022) using national price inflation indices.
Source: Eurostat and OECD calculations; OECD (2022), OECD calculation of contributions to overall annual inflation.

Persistent or stronger-than-expected commodity and energy price shocks could further raise inflation differentials. Based on the NiGEM macroeconomic model, the OECD June Economic Outlook estimated that a European embargo on Russian gas imports could add up to 1.1 percentage points to European inflation in 2023 (OECD, 2022a).

Yet, this impact would likely be highly unequal. To shed light on the magnitude of this mechanism, an illustrative calculation assumes a 40% increase in wholesale gas prices and a 20% increase in wholesale oil prices with a pass-through to retail prices of 40% for oil, 13% for gas and heating and 4% for electricity (Figure 4; EC, 2022). Also, as the pass-through is likely higher when commodity prices are already high (and the capacity of firms to further reduce margins is smaller), an alternative simulation assumes a higher pass-through to retail prices of 50% for oil, 26% for gas and heating and 8% for electricity. In both scenarios, cross-country differences only stem from the different weights of energy items in national consumption baskets. All things equal, the simulated national impacts of these global commodity price shocks appear to increase the standard deviation of headline inflation by around 2% (and 3% in the high pass-through alternative), compared to its historically-high August 2022 level.

Figure 4.  Illustrative direct effects of a hike in wholesale energy prices on harmonised inflation after one year

Effects of a 40% increase in wholesale gas prices and a 20% increase in oil prices, percentage points

Note: The calculation assume a 20% increase in wholesale oil prices and a 40% hike for wholesale gas prices. The pass-through to retail prices of oil and gas is assumed constant across euro area economies at the median estimates of the EC (2022): 40% for oil, 13% for gas and heating and 4% for electricity. To gauge the uncertainty around this scenario, an alternative scenario assuming a higher pass-through is simulated using the median pass-through estimates plus the interquartile ranges of the EC (2022): 50% for oil, 26% for gas and heating and 8% for electricity.
Source: Eurostat; EC (2022) and OECD calculations.

Based on the analysis above, divergences in inflation rates seem mainly driven by the differentiated impact of the coronavirus crisis and energy shocks so far. As those factors are expected to be mostly temporary, and as long as the divergence in core inflation remains moderate, differences in inflation should come down eventually. This would facilitate the conduct of monetary policy, and reduce the risk that the tightening euro area monetary stance exacerbates financial fragmentation amongst member states.

Second-round effects from the burst of inflation may also differ across countries and be a further source of inflation dispersion. Inflation differences can become more entrenched via expectations, but also depending on the functioning of labour markets (e.g. wage-price indexation mechanisms), as well as how rents, social benefits, regulated prices and taxes are linked to inflation. In countries where inflation is particularly high and there are signs of excess demand, such as in the Baltic States and several Eastern European economies, a tighter fiscal stance should play a role in countering demand pressures, since area-wide monetary policy alone is unlikely to be sufficient.

Fiscal policy should also tackle the adverse distributional impacts of higher energy prices. Temporary fiscal measures can help moderate inflation pressures and may thus help anchor inflation expectations (OECD, 2022a). However, as levels of public debt are already high and so as to not fuel inflation further, policy action to help cushion the impact of higher energy prices should be well targeted. Means-tested transfers to households generally meet these criteria, even though finer targeting mechanisms that go beyond income, for example based on housing location and quality, should be developed (OECD, 2022b). Also, fiscal support should not outlast the period of exceptional price pressures to avoid weakening longer-term price signals, which are critical for the energy transition.

Fiscal policy choices should ideally take into account potential spillovers to other member states, and the possible interactions with monetary policy. Fiscal and price-control measures are not equally well designed and targeted across the euro area, which might reduce their effectiveness and possibly create distortions in competition. Common European guidelines can help avoid this.

A more long-term structural source of inflation divergence is the heterogeneous national economic structures that lead to asymmetric country-specific shocks (OECD, 2021). Structural policies should help make the euro area more resilient to price shocks. Investment to improve the interconnection among national electricity grids would reduce energy costs and improve security. Improved storage capacity and diversification of energy sources would also limit volatility in oil and gas markets, including during the energy transition (OECD, 2022a). More generally, Europe should implement reforms that aim for stronger cross-country convergence, notably in three main avenues: the resilience of labour markets, the strength of the single capital market, as well as fiscal integration (OECD, 2021).

In conclusion, while at their highest levels since 2002, divergences in inflation rates have so far been mostly driven by temporary factors until now. The main immediate challenge for an even transmission of monetary policy is not diverging inflation, but diverging bond yields. However, this optimistic scenario could be put at risk if inflation divergences become more entrenched. To avoid this, fiscal policy will need to be tightened appropriately in countries with excess demand while structural reforms need to be implemented more generally to facilitate cyclical convergence across member states.

References

Aksoy, Y, P. De Grauwe and H. Dewachter (2022), “Do asymmetries matter for European monetary policy?”, European Economic Review 46 (2022).

Blake, H. and T. Bulman (2022), Surging energy prices are hitting everyone, but which households are more exposed?, ECOSCOPE https://oecdecoscope.blog/2022/05/10/surging-energy-prices-are-hitting-everyone-but-which-households-are-more-exposed/

Bethuyne et al. (2022), Targeted income support is the most social and climate-friendly measure for mitigating the impact of high energy prices, VoxEU.org, 6 June 2022.

Boone, L. and A. Elgouacem (2021), At the cross-roads of a low-carbon transition: what can we learn from the current energy crisis?, ECOSCOPE, https://oecdecoscope.blog/2021/10/22/at-the-cross-roads-of-a-low-carbon-transition-what-can-we-learn-from-the-current-energy-crisis/.

Darvas and Wolff (2014), So far apart and yet so close: should the ECB care about inflation differentials?

EC (2022), Box 1.2: An update on energy price developments: pass-through from wholesale to retail, https://ec.europa.eu/info/sites/default/files/economy-finance/ecfin_forecast_winter_2022_box-1-2_en.pdf

ECB (2021), The need for an inflation buffer in the ECB’s price stability objective – the role of nominal rigidities and inflation differentials, ECB Occasional Paper Series, No. 279, September 2021.

Eurostat (2022), https://ec.europa.eu/eurostat/documents/2995521/14675409/2-31082022-AP-EN.pdf/e4217618-3fbe-4f54-2a3a-21c72be44c53?t=1661863346094

OECD (2021), OECD Economic Surveys: Euro Area 2021, OECD Publishing, Paris. https://doi.org/10.1787/214e9f0a-en

OECD (2022a), OECD Economic Outlook, Volume 2022 Issue 1: Preliminary version, OECD Publishing, Paris.

OECD (2022b), As Energy Price Hikes Persist, Better Targeting of Support Becomes Imperative, OECD Publishing, Paris, forthcoming.


Structural reforms to help address the cost of living crisis

By David Turner, Balázs Egert and Jarka Botev, OECD Economics Department.

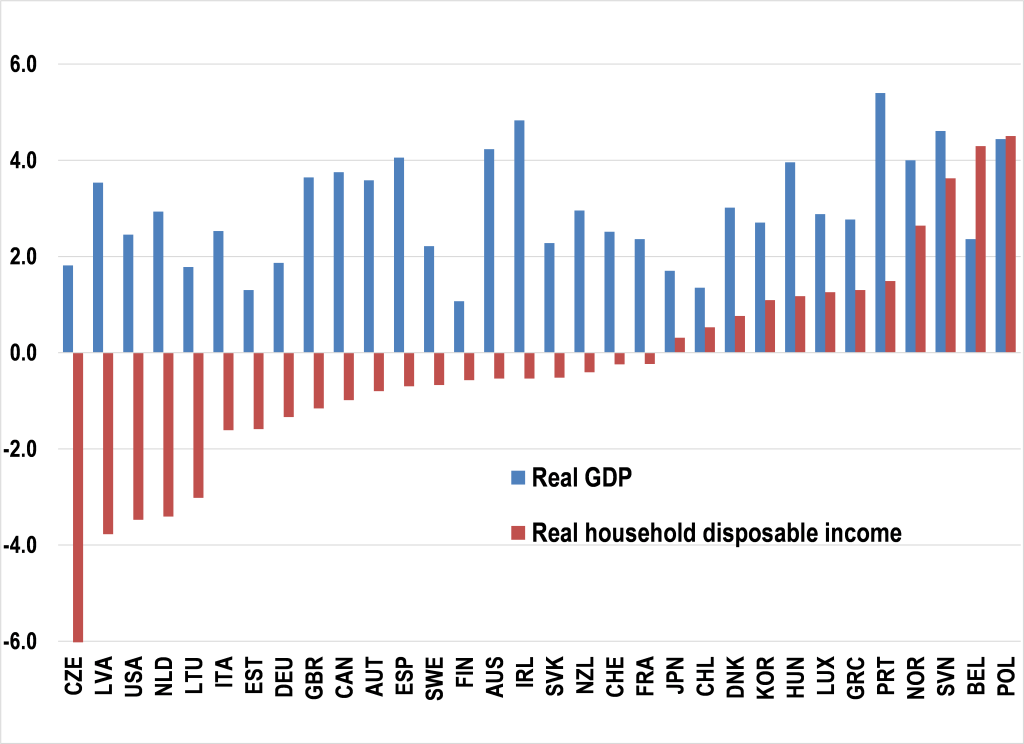
In the latest forecasts published by the OECD, the growth rate of GDP expected this year is positive for every OECD country, but the growth rate of real household disposable income is consistently lower and is negative for a majority of them (Figure 1). Moreover, the magnitude of this differential has not been experienced in some countries since at least the 1970s, leading to what is often referred to as a ‘cost of living crisis’. This difference is all the more important given the long-standing argument that income measures based around household disposable income provide a superior measure of welfare to GDP; adjusted household disposable income1 is used as an alternative income measure to GDP in the OECD flagship publication “How’s Life: Measuring Well-being”, is a component of the OECD Better Life Index and is more consistent with the recommendations of the Stiglitz-Sen-Fitoussi Commission on Measuring Economic Performance and Social Progress to focus on household income and consumption rather than output (Stiglitz et al, 2009).  

Figure 1. Comparing projections of GDP and household disposable income

% growth pa in 2022

Note: The chart compares recent OECD projections for 2022 of growth in real GDP and real household disposable income. Only OECD countries for which national accounts data on real household disposable income is readily available are shown.
Source: OECD Economic Outlook, June 2022.

In response to the cost of living crisis, governments are rolling out temporary, timely and well-targeted fiscal support to vulnerable households. Such policies might be contrasted with structural reform measures, which are typically more permanent in nature and usually take many years to raise the supply-side potential of the economy. However, just-published OECD research considers the differential impact of a range of structural reforms on adjusted household disposable income as compared to GDP and finds that some structural reforms — including family in-kind benefits, family cash benefits and cuts in the income tax wedge — have a disproportionately large effect on household disposable income compared to GDP (Botev et al, 2022).

In addressing the cost of living crisis, these results provide a particularly strong case for increasing support to early childhood education and childcare, which represents over 70% of family in-kind benefit payments across OECD countries. Not only would such policies boost long-run employment, especially for women, and have a rapid and magnified effect on household disposable incomes, but even prior to the current episode they were identified as being among the top structural reform priorities in no fewer than 22 OECD countries, including all G7 countries (Botev et al, 2022; OECD, 2021). Government spending on family in-kind benefits varies widely across OECD countries (Figure 2), with Nordic countries spending as a share of GDP more than double the OECD median. While there may be diminishing returns to additional such spending at higher initial levels, this still leaves substantial scope to increase spending in the majority of OECD countries. Finally, it should also be noted that there may an additional long-run supply-side benefit from boosting spending on early childhood education via a long-run improvement in human capital and total factor productivity (Égert et al, 2022).

Figure 2. Public spending on family in-kind benefits

Percent of GDP, 2019 or nearest year available

Source: OECD Social Expenditure Database.

References

Botev, J., B. Égert and D. Turner (2022), “The effect of structural reforms: Do they differ between GDP and adjusted household disposable income?”, OECD Economics Department Working Papers, No. 1718, OECD Publishing, Paris, https://doi.org/10.1787/def775b1-en.

Égert, B., C. de la Maisonneuve and D. Turner (2022), “A new macroeconomic measure of human capital exploiting PISA and PIAAC: Linking education policies to productivity”, OECD Economics Department Working Papers, No. 1709, OECD Publishing, Paris, https://doi.org/10.1787/a1046e2e-en.

OECD (2020), How’s Life? 2020: Measuring Well-being, OECD Publishing, Paris.

OECD (2021), Going for Growth, OECD Publishing, Paris.

OECD (2022), OECD Economic Outlook, June, OECD Publishing, Paris.

Stiglitz, J., A. Sen and J.-P. Fitoussi (2009), “Measurement of Economic Performance and Social Progress”, Report by the Commission on the Measurement of Economic Performance and Social Progress.


[1] The adjustment in ‘adjusted’ household disposable income reflects an imputed value from public services such as education and health that provides a better basis to compare performance across countries.


Surging energy prices are hitting everyone, but which households are more exposed?

By Hélène Blake and Tim Bulman, OECD Economics Department.

In the 12 months leading to March 2022, average home energy costs jumped by 41% in the European Union, and the price of fuels for private transport by 38%. These rises have strongly contributed to the return of inflation after more than two decades of subdued price growth across EU countries. The cost of the average consumption basket rose by between 4.5% to 15.6% across EU countries in the year to March 2022, and available data for April suggest that stronger price growth has continued.

While everyone is experiencing rising living costs, energy makes up a larger share of some households’ budgets than others, so this shock risks amplifying existing inequalities. As governments across the OECD introduce measures to buttress households from this price shock (Boone and Elgouacem, 2021), it is important to understand which households are most exposed.

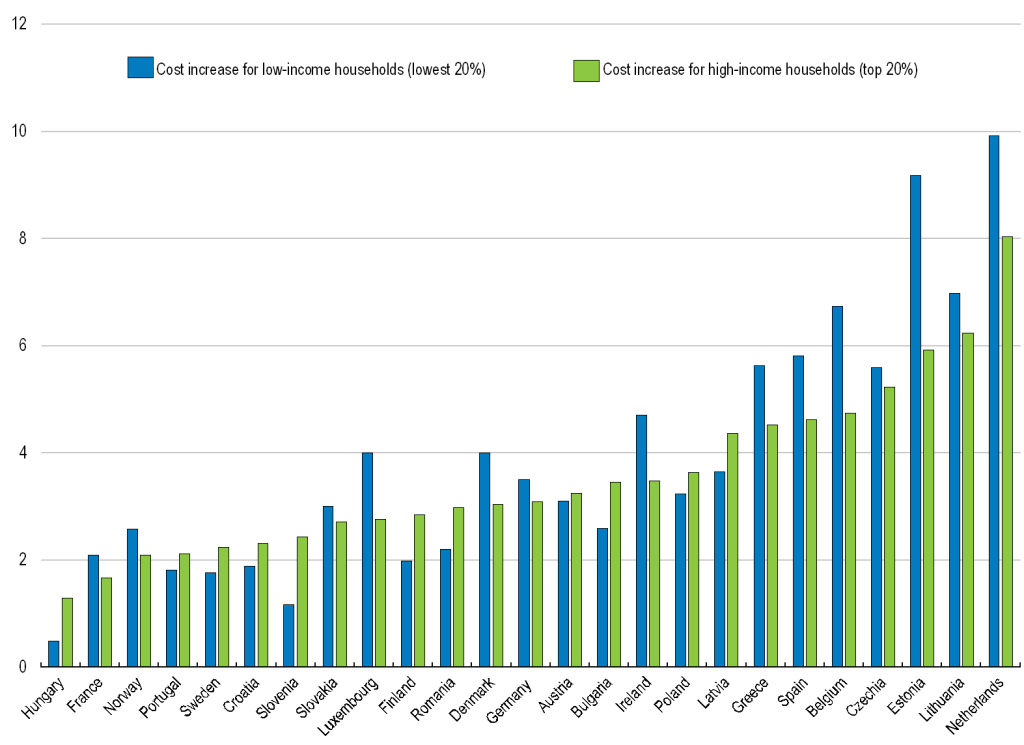
Analysing household budget surveys across the EU shows marked differences in spending on energy between countries and across households. Interestingly, low-income households are not systematically the hardest hit (Figure 1).

Figure 1. The impact of the recent energy price surge on household budgets differs between countries and income groups

Impact of the increase in energy prices on households’ budget for rural and urban households (as a % of total spending)

Note: March 2021- March 2022 increase.
Source: Eurostat; HBS 2015, HICP, author’s calculation.

Which households experience the largest losses in real incomes depends on the type of energy consumed, the price increases of different types of energy, and the share of energy in overall consumption. Home energy prices affect the poorest 20% of households more than higher income households in each country across the EU (Figure 2). For transport costs, the picture is less clear-cut, with increasing transport costs affecting high-income more than low-income households in several countries (Figure 3). Indeed, in a third of European countries higher income households spend larger shares of their income on running their car than lower income households, generally reflecting car ownership that is less common and is concentrated among higher-income households in these countries (Figure 3).

Figure 2. Across the EU, lower income households spend a larger share of their budgets on home energy, higher income households a larger share on transport costs, and remoter households spend larger shares on both

Average share of home energy and transport costs as a % of total spending, across income and geographical groups, EU average (2015)

Source: Household Budget Survey (2015).

Higher energy prices also exacerbate inequalities between urban and rural areas. Households in rural areas and small towns spend 10% to 80% larger shares of their overall budget on home energy and transport costs than their urban counterparts (Figure 4). In some EU countries (e.g. Bulgaria, Hungary or Spain), households in rural areas and small towns are more likely to have low incomes than urban households, exacerbating their loss of purchasing power from rising energy prices.

Figure 3. Higher transport costs have a larger impact on high-income households in countries where car ownership is less common

Share of budget spent on running cars by households with highest 20% of incomes relative to lowest 20% of incomes (2015)

Note: The graphic shows the ratio of income spent on transport of the 20% highest income to the 20% lowest income households. 100 indicates both groups spend equal shares of their budgets. For example, in Bulgaria, the share of income dedicated to transport costs by the 20% richest households is 280% the share of the 20% of households with the lowest incomes.
Source: Household Budget Survey (2015).

The distributional analysis can help governments respond to the recent price rises with measures that target the most exposed and vulnerable households, while limiting the cost of these measures to public finances and sustainability. Means-tested cash transfers are the most cost-efficient tool to reduce inequalities in the loss of purchasing power between income groups. Austria, for instance, gave a lump-sum support to the beneficiaries of social transfers, while Ireland increased the mean-tested payment helping households on their energy bill. Other countries are providing a mean-tested voucher for energy expenses (for example, France and Italy). By not distorting the price signal, such support measures also have the advantage that they do not discourage households from saving energy. Accelerating support to vulnerable households to improve their energy efficiency and to rely less on fossil fuel could bring the greatest and longest-lasting benefits, such as Greece’s support for insulating housing and to develop new photovoltaic stations to provide power for vulnerable households (Bruegel, 2022).

By contrast, price subsidies and tax expenditures (such as cuts to excise taxes) reduce households’ incentives to save energy (Pototschnig, A. et al., 2022). Moreover, price support for transport fuels risks supporting the highest income households the most.

Figure 4. Higher home energy and transport prices disproportionately affect rural households in all countries

Impact of the increase in energy prices on households’ budget for rural and urban households (as a % of total spending)

 Note: Change between March 2021- and March 2022.
Source: Eurostat; HBS 2015, HICP, author’s calculation

References

Boone, L. and A. Elgouacem (2021), At the cross-roads of a low-carbon transition: what can we learn from the current energy crisis?, ECOSCOPE, https://oecdecoscope.blog/2021/10/22/at-the-cross-roads-of-a-low-carbon-transition-what-can-we-learn-from-the-current-energy-crisis/ (accessed on 14 April 2022).

Bruegel (2022), National policies to shield consumers from rising energy prices, https://www.bruegel.org/publications/datasets/national-policies-to-shield-consumers-from-rising-energy-prices/ (accessed on 11 April 2022).

Pototschnig, A. et al. (2022), “Consumer protection mechanisms during the current and future periods of high and volatile energy prices | Florence School of Regulation”, EUI Policy Brief, https://fsr.eui.eu/publications/?handle=1814/74376 (accessed on 11 April 2022).


Inflation with all the trimmings – using trimmed means to compare underlying inflation in major OECD economies

By Patrice Ollivaud and Geoff Barnard, OECD Economics Department

A major challenge for policy makers is understanding whether, in the absence of a faster tightening of monetary policy, recent consumer price inflation pressures are likely to dissipate or to persist and even intensify. Looking at statistical measures of underlying inflation is one way to help answer that crucial question.

Headline inflation is the aggregation of price changes for hundreds of components of household consumption expenditure. One approach to estimating underlying inflation is to exclude some subset of price changes so as to come up with a measure that is less volatile than headline inflation, unbiased (neither over- nor underestimating headline inflation over the cycle), and indicative of the trend, so that headline will tend to adjust towards underlying inflation (Roberts, 2005).

One widely used estimate of underlying inflation is core inflation, which removes energy and food-related items. This works well when commodity prices are the main source of volatility in inflation, but can give a flawed picture if extreme price movements are coming from other items. Trimmed-mean inflation is an alternative statistical measure of underlying inflation pressures which addresses this drawback by removing the most extreme price changes on both sides of the distribution each month and then computing mean inflation from the remaining items. This means that the items excluded can vary over time. An extreme form of the trimmed-mean approach is median inflation, which excludes all price movements other than the median.

There are trade-offs in deciding how much to trim: removing too few items could leave excessive volatility, while removing too many could push trimmed-mean inflation away from the (unobserved) trend in inflation (Dolmas and Koenig, 2019). Trimmed-mean measures are used widely, but there is no consensus on the optimal degree of trimming. For example, the Federal Reserve Bank of Dallas (2021) trims US price changes extensively and asymmetrically, removing 24% from the lower tail and 31% from the upper tail, while the European Central Bank (ECB) has recently used a measure trimming just 7.5% from each end of the euro area distribution of price changes (ECB, 2021).

The latest OECD Economic Outlook (OECD, 2021, Box 1.4) reports on an exercise to facilitate comparisons across countries by constructing, for four major OECD economies, a measure involving a symmetric 10% trimming. This tracks 36-month average inflation (a proxy for trend inflation) reasonably well across a range of countries, although it is not necessarily the optimal trimming for any of the countries individually. The results are compared with headline and core inflation.

Both this trimmed-mean measure and core inflation are less volatile than headline inflation (Figure 1). When, as is often the case, food and energy products exhibit the most price volatility, they behave similarly. At times, however, they are found to diverge, for example during the first phase of the pandemic in the United States, when substantial price declines for a limited number of non-food, non-energy items meant that core inflation fell along with headline while trimmed-mean inflation (which excluded these items) barely moved. Similarly, in Japan all three measures have remained low, but trimmed-mean inflation has diverged more from core inflation than elsewhere, reflecting the fact that price declines for a few components outside of food and energy – above all, mobile phone charges – have held down core (as well as headline) inflation.

Figure 1. Indicators of underlying inflation pressures are now rising

Year-on-year percentage changes

Note: Data are for the personal consumption expenditures deflator for the United States; consumer price inflation for Japan; and harmonised consumer price inflation for the euro area and the United Kingdom. Trimmed-mean inflation trims 10% in terms of weights at the top and bottom of the distribution of the year-on-year growth of prices. Core inflation excludes energy and food-related products.
Source: Bureau of Economic Analysis; Japan Statistics Bureau; Eurostat; Office for National Statistics; OECD Economic Outlook 110 database; and OECD calculations.

Trimmed-mean measures suggest that underlying inflation pressures are now rising in all four economies, but to varying degrees. Underlying inflation, on the measure shown, has risen particularly sharply in the United States to around 4% at present, and in the United Kingdom. In contrast underlying inflation, although increasing, remains low in Japan and close to 2% in the euro area (especially taking into account known one-off factors such as the reversal of the 2020 VAT cut in Germany).

The trimmed-mean and core inflation measures both point to stronger inflation pressures, but this does not necessarily mean that inflation will continue to rise. If, as argued in the Economic Outlook, a large part of upward price pressures has reflected supply restrictions associated with the pandemic, those pressures can be expected to ease when pandemic-related effects fade. On the other hand, whatever the uncertainty about the duration of inflationary pressures, the broadening of price increases, even in Japan and the euro area, is at least indicating that such pressures are not just a matter of spikes in a few consumer prices.

References

Dolmas, J. and E. Koenig (2019), “Two Measures of Core Inflation: A Comparison”, Working Paper, No. 1903, Federal Reserve Bank of Dallas.

ECB (2021), “Comparing Recent Inflation Developments in the United States and the euro area”, ECB Economic Bulletin, Issue 6/2021.

Federal Reserve of Dallas (2021), Trimmed Mean PCE Inflation Rate website.

OECD (2021),OECD Economic Outlook, Volume 2021 Issue 2, OECD Publishing, Paris.

Roberts, I. (2005) “Underlying Inflation: Concepts, Measurement and Performance”, Research Discussion Paper, No.5, Reserve Bank of Australia.