Towards net zero emissions in Denmark

By Andrew Barker, Hélène Blake and Patrick Lenain, OECD Economics Department

Denmark has embarked on an impressive climate policy agenda with ambitous emissions targets, carbon pricing, innovation, public investment and regulatory policies. The share of renewables in electricity generation has grown from less than 10% in the mid-1990s to over 80% in 2020. This has been the key driver behind the sharp cuts in greenhouse gas emissions by 36% between 1990 and 2019, making Denmark one of the least carbon-intensive countries in the OECD. Emission cuts have been achieved without compromising economic or jobs growth, with progress in wind generation in particular contributing to the development of an important export industry.

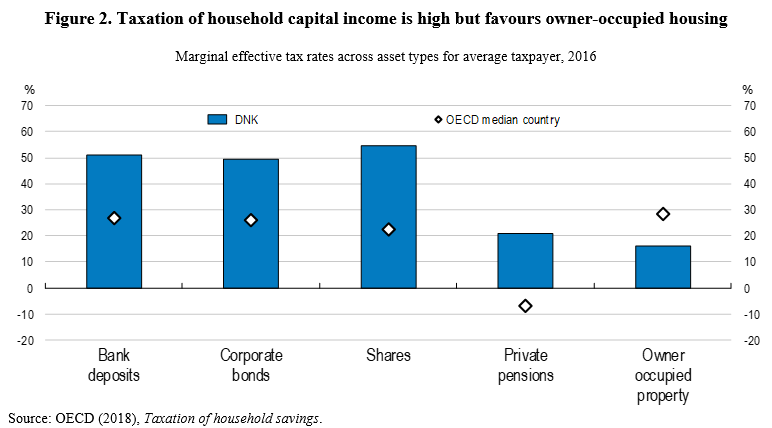
Denmark intends to go further with a a legally-binding commitment to cut emissions by 70% by 2030 from 1990 (Figure 1). This will require halving emissions from 2019 levels – a similar reduction in the next decade as has been achieved in the past 30 years. Cutting emissions at such a fast pace will be challenging, with substantial disruptions and socioeconomic challenges. Radical technological changes and vast resource reallocation will take place throughout the economy, similar to the transformational change in the Danish electricity sector since the mid-1990s. Greater certainty on policy measures to meet these targets will be important to send strong signals to investors. Additional investment in the order of 1% to 2% of GDP will be needed, which could largely come from the private sector with the right incentives.

Job losses to date in high-carbon activities have been offset by new opportunities in green industries – workers with skills in offshore oil and gas have for instance retrained to work in offshore wind. The succesful Danish “flexicurity” system, which combines a safety net with support for skill building and job search, will continue to play a key role to facilitate this sizeable transformation.

Figure 1. Meeting targets will require further progress in all sectors

Source: UNFCCC GHG Data Interface; Danish Climate Law.

The energy sector must continue its transition towards renewable sources. Scarce supplies of sustainable woody biomass, on which Denmark has relied for low-emissions district heating, will need to be freed up for the difficult-to-decarbonise sectors, while continuing to protect security of supply as wind generation expands. A low-carbon economy will rely heavily on renewable energy, which can be promoted by further decreases in taxes on renewable electricity, as well as technological breakthroughs allowing large-scale conversion of electricity into sustainable fuels such as hydrogen, methane or ammonia.

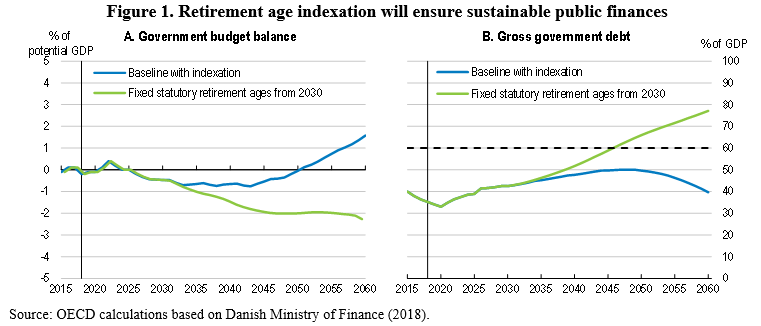
Progress in reducing transport emissions has been slow to date, despite more environmentally-friendly vehicles, as the number of cars has continued to increase as well as the reliance on road transport (Figure 2). Agriculture is also a major and growing source of greenhouse gases. Low-hanging fruit such as rewetting of peatlands and improved manure management are available to cut emissions with limited impact on activity, while also reducing other environmental damages. Denmark needs to work with other EU member states towards further reform to green the Common Agriculture Policy, as agriculture is highly exposed to international trade and emissions could increase elsewhere if Denmark proceeds without international cooperation.

Figure 2. Increasing car use has pushed up transport emissions despite greener vehicles

Source: OECD estimation based on EEA; Statistics Denmark; ITF.

The Danish government has made substantial progress to overcome many of the challenges linked to deep emission cuts. In the past year and a half, for example, the government has removed restrictions in district heating to support a move away from biomass, agreed measures to reduce greenhouse gas emissions in agriculture, and increased support for green vehicles and electric charging infrastructure. Further policy actions are being discussed among various stakeholders, including more uniform emission pricing. Denmark’s past and planned efforts to decarbonise quickly and achieve net zero in 2050 are an inspiring example for other countries, as highlighted in the 2021 OECD Economic Survey of Denmark.  


Does Denmark need yet another tax reform?

By Mikkel Hermansen and Valentine Millot, OECD Economics Department

The answer is yes according to the recent OECD Economic Survey of Denmark. The ratio of tax revenue to GDP in Denmark is 46%, very close to the highest country (France: 46.2%) and well above the OECD average (34.2%). Past reforms have made considerable progress in shifting taxation away from labour income to other sources such as environmental taxes. Nevertheless, Denmark should continue to reform taxes so as to promote investment in innovation, higher education and entrepreneurship, which would help to revive Denmark’s slow productivity growth.  

High marginal tax rates on labour and capital income are particularly harmful for productivity and should be kept at reasonable levels. At 55% these rates are among the highest in OECD countries (Figure 1). For corporate income taxation, it is recommended to introduce an allowance for corporate equity (ACE), as done in Belgium, Italy and Portugal. This would reduce the incentive to finance investment by debt, rather than equity, and would help to boost labour productivity and wages. It is also recommended to cancel the lower inheritance taxation for family-owned businesses. Evidence suggests that this is detrimental to productivity since the family successor tend to underperform compared to non-family managers.

Another key reform would be to reduce the personal income tax deduction of interest expenses. Denmark has one of the most generous tax incentives for interest expenses in the OECD (OECD, 2018). It is not surprising therefore, that Danish households hold the highest gross debt to income ratio in OECD countries, which poses risks to financial stability in case of sharp rise of interest rates. By contrast, personal investment in more productive assets, such as company shares, is discouraged by the tax system (Figure 2). With interest rates at historically low levels, now would be a good time to reform.

References

OECD (2019), OECD Economic Surveys: Denmark 2019, OECD Publishing, Paris, http://dx.doi.org/10.1787/eco_surveys-dnk-2019-en.

OECD (2018), Taxation of Household Savings, OECD Publishing, Paris, https://doi.org/10.1787/9789264289536-en


Ambitious retirement age indexation ensures sustainable public finances in Denmark

By Mikkel Hermansen, Denmark desk, OECD Economics Department

Denmark has a long tradition of reforms delivering sound public finances and strengthening economic growth. One foundation of long-term fiscal sustainability was the decision taken in 2006 to index statutory and early retirement ages to life expectancy. Projections of public finances suggest that in this case (the baseline scenario) the government budget will remain close to balance and debt stay well below 60% of GDP (Figure 1). However, if indexation where to be stopped from 2030, persistent deficits and fast rising debt are projected. 

The indexation mechanism works by raising the statutory retirement
age by up to one year every five years to keep the expected number of years in
retirement constant (Figure 2, Panel A). Experience from the first adjustment
of the early retirement age starting in 2014 has been encouraging. Many seniors
have chosen to stay in their job, which has supported a significant rise in the
employment rate among 55-64 year olds (Figure 2, Panel B). There is still scope
for improvement as the senior employment rate in Denmark remains below those of
Norway and Sweden. 

In the coming years the statutory retirement age will be
increased from 65 to 67 years. Assessing whether the affected workers remain
active will provide another indication of whether the long-term fiscal strategy
is on track. Current projections indicate that the statutory retirement age
will reach 73 by 2060. This is an ambitious path and the highest planned
retirement age across OECD countries. Still, since additional years lived are
generally in good health such a rise is achievable, but requires policies to
retain seniors in the labour market. 

The recent OECD Economic Survey of Denmark commends Denmark for its impressive reform track record and sound public finances. The indexation of retirement ages to life expectancy should become a pillar of the economic policy framework and useful guide for other countries undertaking their own reforms. Nonetheless, successful reform requires full implementation and more could be done to ensure the functioning of the labour market does not discriminate against seniors as well as helping those with reduced work capacities to remain in employment (OECD, 2015).  


References

Danish Government (2018), Denmark’s Convergence Programme
2018
, Copenhagen.

Danish Ministry of Finance (2018), Opdateret 2025-forløb:
Grundlag for udgiftslofter 2022 (Updated 2025 projection: Basis for expenditure
ceilings 2022)
, Copenhagen.

OECD (2019), OECD Economic Surveys: Denmark 2019, OECD Publishing, Paris, http://dx.doi.org/10.1787/eco_surveys-dnk-2019-en.

OECD (2015), Ageing and Employment Policies: Denmark 2015:
Working Better with Age, OECD Publishing, Paris, http://dx.doi.org/10.1787/9789264235335-en


A balancing act: Why inequality increased in the Nordics

Mr. Jon Pareliussen, Economist, Sweden/Finland desk, Economics Department

The Nordics are rightly renowned for being inclusive societies with low inequality compared to other OECD countries. However, some of the largest inequality increases over the past few decades took place in Sweden, Finland and Denmark. A newly released article  building on previous OECD work discusses how market forces, demographic trends and redistribution together shaped the income distribution of the Nordics.

It may seem like a paradox that the Nordics, which are very open economies, heavily integrated in global value chains and front-runners in the use of new technologies, have not seen even more widening distributions of market incomes. However, the extent to which skill-biased technological change and other forces widening the earnings distribution of workers will actually drive up inequality depends on a number of factors, and key policies and institutions in the Nordics play a dampening role. First, institutions such as unions and collective bargaining, employment protection legislation and minimum wages dampen the direct effect of market trends on earnings. Second, higher demand for skills are met by publicly-funded higher education, increasing the supply of skilled workers and thus holding back skills premiums. Third, a widening earnings distribution among workers coincided with increasing employment, limiting the overall effect on inequality.

Nordic1.JPG

With a relatively modest overall impact from market forces, explanations for increasing inequality must be sought elsewhere:

  • Demographic trends have been relatively strong drivers of inequality in the Nordics. Household structure, with more single-headed households has widened income dispersion in Denmark, Finland, Norway and Sweden. Ageing has increased inequality significantly in Finland, and immigration has increased inequality in Norway, Denmark and Sweden.
  • Redistribution through taxes and transfers has weakened significantly in Denmark, Finland and Sweden, notably due to less insurance transfers (i.e. unemployment, sickness, disability insurance) and only partially offset by more assistance (i.e. means-tested) transfers. Income taxes have played a less important and more heroegneous role, as progressivity increased in Sweden while it decreased in Denmark and Iceland.

Technological and demographic pressures are set to continue going forward, and these challenges need to be embraced. Continued flexibility and constructiveness of the social dialogue and improvements to education are essential to seize opportunities from technological change and avoid a widening wage distribution. Making social insurance and welfare transfers more flexible and agile would improve workers’ protection in a rapidly changing world of work. Improving benefit system design so that work always pays, notably in Denmark and Finland, and linking benefits to real-time income registries are important steps to this end.

The Nordics demonstrate that equity and efficiency can be compatible if incentives are right. Low inequality and strong safety nets can even be an advantage in today’s globalised world, which requires constant adaptation. Reaping the full benefits from globalisation and technological progress requires broad support, which is easier to muster when the social dialogue is constructive and representative, when everyone is given opportunities to fulfil their potential, risks are shared and losers compensated.

References:
Pareliussen, J. K., Hermansen, M., André, C. and Causa, O. (2018), Income Inequality in the Nordics from an OECD perspective, Nordic Economic Policy Review 2018.


Inequality in Denmark through the looking glass

By Mikkel Hermansen, Structural Surveillance Division, OECD Economics Department

Although Denmark is one of the least unequal countries in the world, it has like many other OECD countries experienced a rise in income inequality. But by exactly how much has the Gini coefficient risen over the last decades? There is significant disagreement between various official sources (Figure 1): The Danish government and Statistics Denmark report a substantial increase, of 5.7 Gini points, since 1990, whereas the OECD figures only convey a rise of 3.1 Gini points (close to the OECD average; see OECD, 2015). And while national sources agree on the trend, they diverge on the level by almost 2 Gini points (26.2 for Danish government vs 27.9 for Statistics Denmark in 2013). While such measurement muddle may seem uninteresting, it emphasises how crucial methodological choices can be for inequality assessments. In this respect, Denmark is an interesting laboratory due to high-quality administrative data and almost full population coverage. In Causa et al. (2016) we therefore uncover the methodological differences behind the development illustrated in Figure 1.

gini-denmark

The differences between inequality trends reported by international and national sources are mainly due to differences in the treatment of:

  • Negative income elements: e.g. from indebted households paying interest expenses and from self-employed experiencing transitory income losses. Negative income elements are set to zero by the OECD to ensure cross-country comparability, which significantly raises the inequality level compared to the Danish government in the 1990s and early 2000s. One can think of individuals with high interest expenses, who typically also have high incomes from employment and therefore appear even more affluent from this adjustment.
  • Unmeasured housing services enjoyed by homeowners relative to tenants: to ensure comparability in living standards between homeowners and tenants it is possible to estimate the value of self-provided housing services and add this to homeowners’ income – the so-called imputed rents. National statistics include imputed rents, whereas they are excluded from OECD figures because of poor cross-country comparability. Along with the decline in interest rates from 2000 onwards and a house price boom in Denmark, imputed rents have driven up the Gini coefficient reported by national sources compared to the OECD.

Two other methodological differences mainly influence the reported level of inequality:

  • What defines a household? International standards define a household as a group of people living together, while the Danish institutions also impose that they have family ties and this tends to raise inequality because of more and smaller households.
  • How much economies of scale do people living together enjoy? A household of four can share many goods and do not need to spend four times as much on heating and electricity as a lone-person household. Material living standards of households of different sizes can be made comparable by use of an “equivalence scale” (for OECD figures calculated as the square root of household size). In the case of Denmark, the three institutions use three different scales.

Who is right about inequality in Denmark then? Well, that would depend on the purpose. For international comparisons one should obviously use OECD figures that comply with the same international statistical protocols and conventions. But from a national perspective, statistics produced by the government and Statistics Denmark are better tailored to the data source and can provide a more comprehensive picture.

References

Causa, O., M. Hermansen, N. Ruiz, C. Klein, and Z. Smidova (2016), “Inequality in Denmark through the Looking Glass”, OECD Economics Department Working Paper, No. 1341, OECD Publishing, Paris, http://dx.doi.org/10.1787/5jln041vm6tg-en.

Ministry of Economic Affairs and the Interior (2015), Familiernes økonomi: fordeling, fattigdom og incitamenter 2015 (Household Finances: Distribution, Poverty and Incentives 2015), Copenhagen.

OECD (2015), In It Together: Why Less Inequality Benefits All, OECD Publishing, http://dx.doi.org/10.1787/9789264235120-en.

Statistics Denmark (2016), Indkomster 2014 (Household Incomes 2014).