The law of the strongest? Firm performance during the COVID-19 crisis

By Guido Franco, Mauricio Hitschfeld, Álvaro Pina and Damien Puy

The large decline in economic activity triggered by the COVID-19 pandemic posed significant risks to the corporate sector. In the wake of the crisis, two major concerns that emerged were i) the potentially-higher vulnerability of smaller or younger firms,  which could make them bear the brunt of the severe recession, with the likelihood of lasting economic damage; and ii) the risk of a debt overhang effect, whereby firms, even if rescued, would accumulate more debt, negatively impacting their post-pandemic investment and growth.

In a recent paper (Franco, Hitschfeld, Pina and Puy, 2023), we investigate whether these concerns materialised by analysing more than 150,000 non-financial companies, listed and non-listed, from both manufacturing and services sectors, operating in more than 50 countries, through the COVID-19 cycle until end 2021.[1]

Larger and older firms have not outperformed smaller and younger ones

A first key finding is that larger and older firms did not outperform their smaller and younger counterparts in terms of revenue growth and investment spending, both during COVID-19 and the subsequent recovery.  The underperformance of large firms in terms of revenues was driven by firms operating in advanced economies (Figure 1), where concerns about rising concentration and market power have been the strongest in the last decade. The relative performance of smaller and larger firms depends on whether their sector of activity in the respective country expanded or contracted over the COVID-19 cycle. In contracting industries, the underperformance of larger firms in terms of revenues is statistically significant, suggesting that smaller firms might have gained market share at the expense of larger competitors in the sectors hit hardest by the pandemic. In contrast, the effect of firm size is more muted in expanding sectors. For firm age, the results for revenues are even stronger in advanced economies but, in contrast to size, are mainly driven by expanding sectors.

Abundant policy support mainly targeted at smaller firms only provides a partial explanation of their comparative resilience. Differences in the “size penalty” between subsamples of countries with larger or smaller fiscal policy support were generally found to be limited, with some evidence of a comparatively better performance of smaller firms in higher-support countries only in 2020.

Figure 1. The effect of firm size and age on revenues in different subsamples

Note: Each bar corresponds to the coefficients on the log of assets in 2019 and the dummy variable of age in 2019 (top quartile of the sectoral age distribution) in a regression model for the log of firm revenues, with the debt burden measured using the interest coverage ratio. A negative (positive) bar indicates that larger or older firms have performed worse (better) in terms of revenues compared to their smaller or younger counterparts. Empty bars indicate non-significant coefficients, dotted bars indicate significance at 90%, dashed bars indicate significance at 95% and filled bars indicate significance at 99%. Country groups with higher and lower policy support are defined based on total fiscal support (above and below the line) excluding contingent liabilities. See Franco, Hitschfeld, Pina and Puy (2023) for further details. Source: Authors’ calculations based on IMF (2021) and S&P Capital IQ database.

The absence of a “size premium” suggests that, at least until 2021, the COVID-19 pandemic did not induce a systematic reallocation of revenues and investment towards industry leaders, and thus did not result in a broad-based increase in concentration. Larger firms did not even systematically over-perform in sectors under particular scrutiny from a competition standpoint, such as technology and healthcare.

Financial vulnerabilities have weighed on revenues and investment

Ex-ante financial strength clearly attenuated the effects of the shock on revenues during the COVID-19 cycle. Firms that entered the pandemic in poorer financial shape – with a higher leverage ratio, a heavier debt service burden or a larger share of short-term debt – tended to do worse in terms of revenues. These findings hold across advanced economies and emerging markets, expanding and contracting sectors, and countries with different levels of policy support (Figure 2).

There is also some evidence of a debt overhang effect. Firms that entered the crisis with a higher leverage ratio invested less than others, including on R&D, both in 2020 and in 2021, and firms which became more financially fragile during 2020 (e.g. experiencing an increase in their leverage ratio or a decline in either their interest coverage ratio or their liquidity ratio) tended to record weaker investment spending in 2021. The debt overhang channel thus appears a more likely source of any scarring effects left by the pandemic than the impact of reduced competition.

Figure 2. The effect of firm financial characteristics on revenues in different subsamples

Note: Each bar corresponds to the coefficients associated with rollover risk in 2019 (the ratio of short-term debt to total debt) and the debt burden in 2019 (bottom quartile of the sectoral interest coverage ratio distribution) in a regression model for the log of firm revenues. A negative (positive) bar indicates that more financially vulnerable firms have performed worse (better) in terms of revenues compared to their financially healthier counterparts.  Empty bars indicate non-significant coefficients, dotted bars indicate significance at 90%, dashed bars indicate significance at 95% and filled bars indicate significance at 99%. Country groups with higher and lower policy support are defined based on total fiscal support (above and below the line) excluding contingent liabilities. See Franco, Hitschfeld, Pina and Puy (2023) for further details.
Source: Authors’ calculations based on IMF (2021) and S&P Capital IQ database.

References

Franco, G., Hitschfeld, M., Pina, A. and D. Puy (2023), “The law of the strongest? Exploring the drivers of firm performance during the COVID-19 crisis”, OECD Economics Department Working Papers, No 1779, https://www.oecd.org/economy/the-law-of-the-strongest-exploring-the-drivers-of-firm-performance-during-the-covid-19-crisis-98397076-en.htm

IMF (2021), “Fiscal Monitor Database of Country Fiscal Measures in Response to the COVID-19 Pandemic”, Fiscal Policies Database (imf.org)


[1] The empirical analysis relies on a number of different econometric methods. A difference-in-differences approach is used for the baseline model, with a set of cross-sectional and first differences regressions being employed to complement and check the consistency of the findings.



Employment dynamics across firms during COVID-19: The role of job retention schemes

By Sara Calligaris, Gabriele Ciminelli, Hélia Costa, Chiara Criscuolo, Lilas Demmou, Isabelle Desnoyers-James, Guido Franco and Rudy Verlhac[1]

Three years after the outbreak of the COVID-19 pandemic, the implications of the massive fall in economic activity and of the associated widespread government support to businesses are still not fully understood. Yet, they are key to inform policy design and action going forward, in particular with respect to their potential consequences for aggregate productivity via labour reallocation.

Against this backdrop, a recent paper (Calligaris et al., 2023) investigates employment dynamics across firms along the intensive and extensive margins during the COVID-19 pandemic, the extent to which these adjustments were productivity enhancing, and the role of job retention schemes (JRS) in shaping these patterns. The paper relies on a combination of novel and unique data. First, in collaboration with 12 participating countries, it collects high-frequency (monthly) harmonised micro-aggregated statistics, computed using administrative data on employment and wages from electronic payroll records, linked to monthly information on policy support during COVID-19. Second, it builds a new cross-country and high-frequency de-jure indicator of JRS allowing researchers to benchmark their generosity across countries and over time.

Employment adjustments and reallocation in COVID-19 times

The analysis shows that, since the onset of the COVID-19 crisis, employment adjusted through different margins. In 2020, employment adjusted mainly along the intensive margin, with a decline in employment growth of surviving firms relative to 2019, while – at the extensive margin – survival rates remained on average stable. In 2021, employment growth of surviving firms picked up, while average survival rates started to decline. These aggregate results mask high cross-country and cross-sector heterogeneity, with increases (decreases) in job destruction (creation) rates significantly higher in low-telework sectors.

These adjustments in employment dynamics also entail a reallocation of resources across firms within sectors, which is a relevant factor affecting aggregate productivity growth. Relative to 2019, the productivity enhancing nature of labour reallocation was weaker in 2020 and 2021. Indeed, while on the extensive margin high productivity firms still showed significantly higher survival rates compared to their lower productivity competitors, the contribution of the intensive margin weakened, with employment growth of surviving firms remaining only marginally related to productivity.

Figure 1. Labour reallocation remained productivity-enhancing, though to a lower extent

Difference in total employment growth relative to the bottom quartile of the productivity distribution.

Note: The figure presents differential employment growth rate for mid (25-75) and high productivity firms (75-100) relative to the baseline group of low productivity ones (0-25) in 2019, 2020, and 2021. The estimates come from regressing employment growth (between January of each year and January of the year after) on a dummy for each productivity quantile along with country-sector fixed effects and weighting the regression by sectoral employment shares. The columns represent estimated coefficients and the green bars 95% confidence intervals.
Source: Calligaris et al. (2023).

The role of job retention schemes

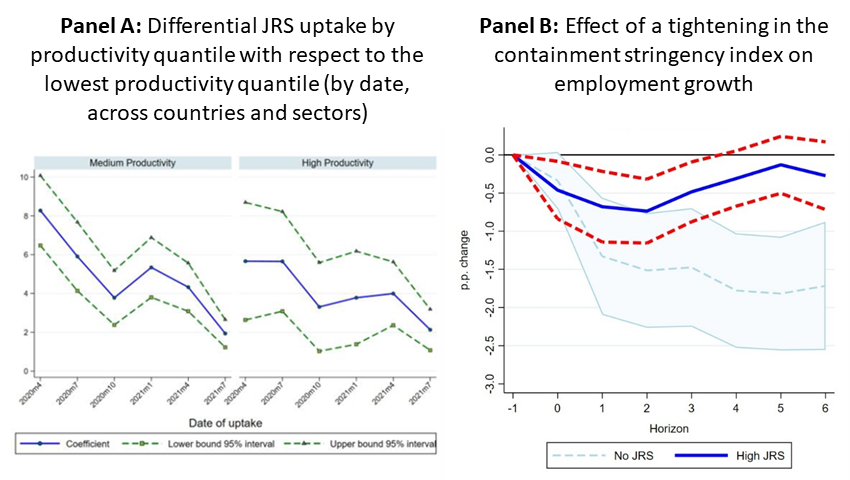
Job retention schemes have been the most widespread policy instrument to support workers and firms across OECD countries. The data show that the uptake of JRS by firms in the sample varies markedly across countries, sectors and over time.  At its peak, around 80% (60%) of firms received support in New Zealand (Australia), and more than 20% of firms were supported in European countries such as Denmark, Latvia and the Slovak Republic. Uptake has been by far the highest in the “Accommodation and food service activities” sector and at the time the COVID-19 pandemic hit the hardest. It was gradually reduced and the eligibility requirements to access the schemes were tightened when countries lifted mobility restrictions. There was also heterogeneity in the allocation of support across firms within sectors: In all countries, JRS support was not disproportionately directed towards unproductive companies (Figure 2.A), as uptake was relatively higher for firms in the middle quartiles and in the top quartile of the productivity or size distribution.

The analysis investigates the role of JRS using: i) firm-level information on uptake to contrast employment growth and survival rates across firms at a detailed level, as well as ii) local projections estimations exploiting ex ante differences in the generosity of support design through a novel de-jure JRS indicator to further ease endogeneity concerns.  The two approaches provide complementary insights, showing that JRS contributed to mitigating the negative consequences of the crisis on employment and business survival. Specifically, following a tightening in the intensity of the pandemic, employment growth was on average lower and firm exit higher in the absence of JRS, relative to when generous JRS were in place (Figure 2.B). Furthermore, the analysis shows that when no JRS were in place, employment for mid and high productivity firms decreased significantly more than when more generous JRS was in place, while no significant difference was found for the least productive firms.

Taken together, these results suggest that government policies were effective in mitigating the effects of the crisis and did not appear to distort the creative destruction process and productivity enhancing nature of reallocation.

Figure 2. JRS mitigated the consequences of the crisis, without distorting the reallocation process

Note: Panel A plots the coefficient and related 95% confidence intervals of a regression of JRS uptake on the productivity quantiles categorical variable, on a cross-country sample evaluated repeatedly at different points in time, controlling for country by industry fixed effects. Each sector is weighted according to its average size in terms of employment over the year. Panel B. The lines represent the effect on employment growth of a change in the containment stringency index between 0 and 6 months after the change, if the JRS indicator in the month before the change in severity was equal to 0 (No JRS, light blue dotted line) or to the 75th percentile (High JRS, blue filled line). The red dotted lines and the thick light blue lines represent the 90% confidence interval around the estimates.

References

Calligaris, S., G. Ciminelli, H. Costa, C. Criscuolo, L. Demmou, I. Desnoyers-James, G. Franco, R. Verlhac, (2023), “Employment dynamics across firms during COVID-19: The role of job retention schemes”, OECD Economics Department Working PaperNo 1788, https://doi.org/10.1787/33388537-en.


[1] The analysis is the result of a collaboration project between two OECD Departments, namely the Economics Department and the Directorate for Science, Technology and Innovation. It would not have been possible without the valuable contribution of national experts from the Central Bank, the Ministry of Economy and/or Finance, Revenues and Customs, or National Statistical Office of the countries participating to the project –namely, Australia, Belgium, Canada, Costa Rica, Denmark, Italy, Latvia, Netherlands, New Zealand, Norway, Slovak Republic and United Kingdom.


What explains the striking differences in vaccination uptake across OECD countries?

By David Turner, Nicolas Woloszko, Thomas Chalaux and Marnix Dek, OECD Economics Department

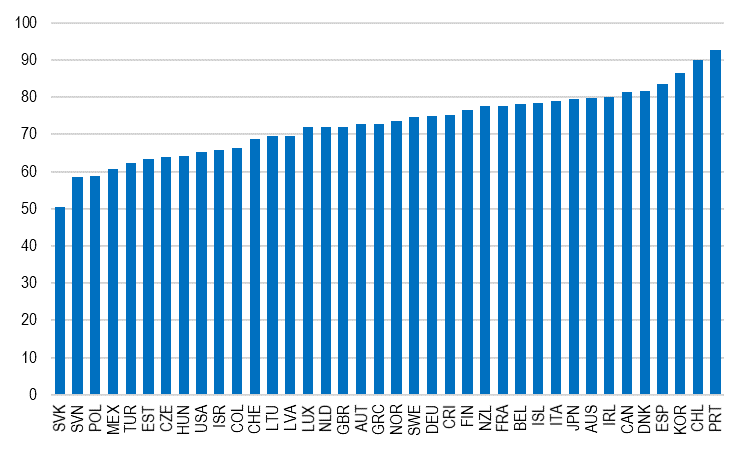
Massive differences in COVID-19 vaccination coverage between rich and poor countries are mostly explained by supply and logistical issues. However, even among OECD countries, where such issues are no longer a major constraint, there remain striking differences in the share of the population that is fully vaccinated (Figure 1). Our recently published OECD Working Paper: Understanding differences in vaccination uptake among OECD countries (Turner, D., et al., 2022) attempts to understand the reasons for these differences, which is important not only in dealing with current and future waves of COVID-19, but also to be better prepared for the next pandemic.

Figure 1. The share of the population fully vaccinated in OECD countries

Per cent, data for the 11th of March or nearest period.

Note: Total number of people who received full doses prescribed by the initial vaccine protocol divided by the total population of the country. Alternative definitions of vaccination, for example having been infected or having one dose of a two doses protocol, are ignored in order to maximise cross-country comparability.
Source: Our World in Data, downloaded on the 11th of March 2022.

Vaccinations have major health and economic benefits. There is overwhelming evidence from extensive clinical trials and real world experience that vaccines provide protection against the most severe outcomes of COVID-19. There is also clear evidence that OECD countries with less extensive vaccine coverage have experienced more COVID-related deaths from the most recent wave of the Omicron variant. Analysis by Oliu-Barton, Pradelski, Woloszko et al. (2021) suggests that an increase of vaccination by 10 percentage points is associated with an increase of ½ of a percentage point in GDP after four weeks.

The time profile of vaccination rates typically follows an S-shaped logistic curve, which captures the main dynamics of a diffusion process: adoption is initially slow due to supply constraints and widespread hesitancy, then peaks when logistical problems are solved, until coverage starts plateauing as progress depends on persuading those that are reluctant or hard to reach. As a result, the drivers of vaccine uptake in the early stages of the vaccination campaigns are no longer the main explanations of current vaccination levels:

  • Supply constraints were initially bottlenecks, but have since been overcome. By the end of April 2021, Israel, Chile, the United States, the United Kingdom and Hungary were far ahead of other OECD countries in terms of number of vaccine doses delivered. However, most other OECD countries have since caught up and among these five early leaders, only Chile remains in the highest quartile of vaccine coverage among OECD countries.
  • Initial vaccine hesitancy can be overcome. Among a small sample of OECD countries for which survey evidence is regularly available, there is little correlation between the share of the population that is currently not fully vaccinated and the share of a surveyed population who was unwilling or uncertain to consider vaccination at the beginning of 2021.

The focus on the contemporaneous rates of vaccination precludes using time series statistical methods, and the paper thus highlights some of the key drivers of vaccination based on univariate correlations:

  • Many of the countries where flu vaccination has been historically low are also those where current vaccine coverage against COVID is low. Similarly, there is a positive correlation between the share of general practitioners likely to prescribe vaccines against other illnesses and current vaccine coverage against COVID.
  • Trust in healthcare systems is correlated with vaccination in the small number of countries where it is surveyed regularly. For a wider sample of countries, there appears to be a weaker correlation with an indicator of access to and quality of healthcare.
  • Demographics factors:
    • The elderly are more vulnerable to COVID and have higher vaccination rates. As a result, countries that have a high elderly population share tend to have a higher overall vaccination rate, as evidenced by Japan (with relatively high shares of both), compared to Turkey, Colombia and Mexico (relatively low shares).
    • There seems to be major differences across countries in the tendency to vaccinate children, which help to explain differences in total population vaccine coverage. Vaccine coverage of children aged 0 to 17 is particularly low (often around 10% or less) in Eastern European countries, Mexico and Turkey as opposed to Denmark and Portugal where it is much higher (more than 40%).
  • There is no simple correlation of vaccine coverage with survey measures of trust in government, but it does appear that low trust in government implies greater vulnerability to mixed messages from other sources. Many of the OECD countries with the lowest vaccination rates have both a low trust in government and a greater reliance on social media for news and information. Also, when the merits of vaccination are disputed by mainstream political parties, then vaccination rates can be correlated with political affiliation.

While a substantial share of the differences in vaccination rates across countries depends on pre-existing factors, vaccine policies also play an important role and contribute to explain differences in vaccination rates:

  • Nudge policies (e.g., lotteries, financial incentives, public health messages) are found by a number of studies based on Randomised Controlled Trials to have accelerated vaccination in the early phases, but to have had non-significant effects afterwards (Chang et al., 2021), or even a negative effect on some subgroups due to a backlash effect. 
  • COVID certificates had a substantial impact in some countries. For instance, Oliu-Barton, Pradelski, Woloszko et al. (2021) estimate that they boosted vaccination by 13 percentage points in France, 6 percentage points in Germany, and 10 percentage points in Italy. This is consistent with simple time series evidence from a number of countries as new vaccinations seem to have substantially increased following the COVID certificate announcements in Germany, Finland, France, Italy, Mexico and Slovenia (Figure 2). However, their effect was less clear in countries where the coverage of COVID certificates was narrower, such as in Poland, Spain and Sweden where they were limited to restricting international travel.
  • Vaccine mandates were set up for selected professions (including healthcare workers and civil servants) in most OECD countries. Greece and Italy made vaccination mandatory for the elderly, resulting in substantial increases in vaccination rates for these segments of the population. The announcement of the vaccine mandate for the general population in Austria was found to boost vaccination by 3 percentage points in November 2021 (Kloiber, Peichl and Winner, 2021), but was suspended on 9 March 2022.

Figure 2. Daily number of people receiving their first vaccine dose per 100

Seven-day moving average, date of the COVID certificate announcement = 0

Note: The horizontal axis measures the days relative to the date of a COVID certificate announcement; the vertical axis shows the number of new people vaccinated per hundred population as an index based the day of the announcement. 
Source: Our World in Data, downloaded on the 11th of March 2022; Oliu-Barton, Pradelski, Woloszko et al. (2021).

Vaccination dramatically reduced the human and economic toll of the COVID-19 pandemic. The lower levels of uptake in some OECD countries remain an important issue, especially if new variants emerge and require additional booster shots. Over the longer term, understanding differences in vaccination rates is important for building resilience to future health shocks. The fact that past flu vaccination remains amongst the best predictors or COVID-19 vaccination suggests that policies that aim to improve understanding of the benefits of vaccination in general, along with the willingness of GPs to prescribe vaccinations and the quality of the health systems are all important in improving a country’s resilience to the threat of a new pandemic.

References

Turner, D., et al. (2022), “Understanding differences in vaccination uptake among OECD countries”, OECD Economics Department Working Papers, No. 1704, OECD Publishing, Paris, https://doi.org/10.1787/76482043-en.

Oliu-Barton, M., B. Pradelski, N. Woloszko et al. (2021), “The effect of COVID certificates on vaccine uptake, public health, and the economy”, Conseil d’Analyse Économique, Paris. https://www.cae-eco.fr/limpact-des-pass-sanitaires-sur-le-taux-de-vaccination-la-sante-et-leconomie

Chang, T. et al. (2021), “Financial Incentives and Other Nudges Do Not Increase COVID-19 Vaccinations among the Vaccine Hesitant”, National Bureau of Economic Research, Cambridge, MA, http://dx.doi.org/10.3386/w29403.

Kloiber, K., A. Peichl and H. Winner (2021), “‘Schnitzel Scare’ as a Boost for Vaccines? The Impact of 2G Rules and Lockdowns on Vaccination Rates in Austria”, IFO Institute, https://www.ifo.de/en/publikationen/2021/article-journal/schnitzelpanik-als-impfturbo-die-auswirkungen-von-2g-regeln


The EA and the US in the COVID-19 crisis: Implications for the 2022-2023 policy stance

By Laurence Boone, OECD Chief Economist

This blog post is a transcript of a speech  given by OECD Chief Economist at the Eurogroup meeting on 17 January 2022.

Introduction

Thank you for giving me this opportunity to review the euro area performance throughout the crisis and what we are recommending you should consider for this year, and of course, for next year.

What I would like to say today is that while both the euro area and the US have addressed the pandemic swiftly and robustly, their recoveries are shaping in different ways. This provides lessons and information about policies looking forward.

In that respect, I will be making three points:

  1. What should be our reference to assess the progress towards a genuine recovery from the pandemic? It should certainly not be the level of activity at the end of 2019. In the two years since then, economic activity and employment should have increased. Our reference should therefore be the pre-pandemic trend for GDP and employment.
  2. The crisis is not over. We do not yet know how Covid can continue to evolve and how our economies will adjust structurally to the profound disruptions caused by the epidemic and to its consequences. We are fortunate the euro area policy response was bold and coordinated and still leaves policy space today.
  3. Fiscal and supply side policies will need to be mobilised to regain the pre-pandemic trend, and to address the root causes of inflation, too high energy prices and low trend growth.

Let’s take a look at my first slide illustrating the different shapes of the US and euro area recovery. In spite of the significant impact on GDP early in 2020, swift proactive policy reactions on both sides helped establish a fast and high bounce back. Both in the US and euro area GDP is now at or above late 2019 levels (Figure 1).

Figure 1. Recoveries in the United States vs. euro area

Note: The projection period is shaded in grey.
Source: OECD Economic Outlook 110 database; and OECD calculations.

However, policies have differed in shape and content across the OECD, and particularly between the US and the euro area.

The way support has been provided to people has been different, reflecting different labour market and welfare structure profiles.

Both approaches have had different consequences for employment, demand and inflation.

As you well know, throughout the euro area, huge efforts have been made to keep people in employment. Some countries have even prohibited layoffs.

Unlike European job retention schemes, under the US “temporary layoff” scheme, workers have lost both wages and benefits.

As a result, in Europe employment levels were hardly affected. On aggregate, employment is back to pre-crisis levels. In the US employment was hit hard and is still below pre-crisis levels.

There are other differences between the US temporary lay-off and the euro area job retention schemes, which affect the recovery.

In the US, lay-off compensation has remained very low. To address this issue, the US government has significantly increased income support, by sending cheques to people directly, through tax credits and by extending and topping up unemployment benefits. These were significant sums, particularly for many low-income people.

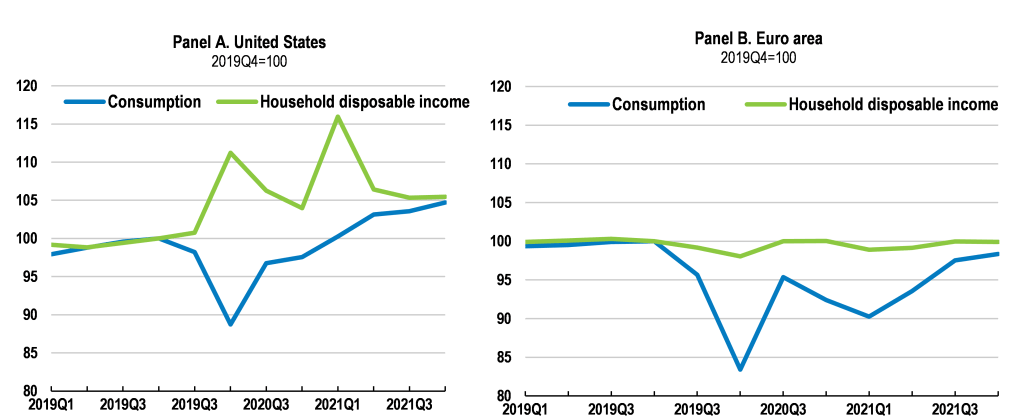
So US real household disposable income increased signficantly in 2020 and again in 2021 (Figure 2).

Figure 2. Income support has impacted consumption developments 

Note: Consumption represents real private consumption expenditure and household disposable income refers to real net household disposable income. Euro area aggregates are OECD estimates.
Source: OECD Economic Outlook 110 database; and OECD calculations.

As a result, in the US consumption has returned to its pre-crisis trend on aggregate, and spending on goods has surged well above its pre-crisis dynamic.

In contrast, in the euro area incomes have remained at roughly the same level as pre-pandemic (as wages were more-or-less preserved for most workers in job retention schemes). And, consumption is not yet back to its pre-crisis level in the euro area.

These differences have important consequences for jobs, growth and inflation.

A common feature for inflation is that most forecasters, including all of us here, missed inflation developments and have repeatedly underestimated the magnitude and persistence of inflation in Europe and the US (Figure 3).

Figure 3. Inflation projections have been repeatedly revised upwards

Note: Panel A – Dashed lines represent projections for the personal consumption expenditure deflator. Panel B – Dashed lines represent projections for the headline harmonised consumer price index.
Source (both panels): OECD Economic Outlook 110 database; OECD Economic Outlook 109 database; OECD Economic Outlook 108 database; and OECD calculations.

One reason is disruptions and bottlenecks caused by the pandemic, limiting supply and pushing prices up. As the pandemic lasts and, as many Asian countries supplying essential industrial components pursue strict anti-COVID restrictions, these tensions will take longer to recede than we expected, possibly lasting up to 2023.

This fact is common to the euro area and the US, but there are two marked differences that trigger differences in inflation.

With the consumption boom in the US I mentioned earlier on, concentrated on goods and in particular durable goods (Figure 4), pressures on prices, especially for durable goods such as cars, have shot up.

Figure 4. Very strong demand for goods, in particular durable, in the US

Note: The data on panel B represent an average of euro area member countries weighted by nominal consumption expenditures. Non-durable goods incorporate semi-durable goods. Services and non-durable goods are available only for Austria, Estonia, Finland, France, Germany, Ireland, Italy, Latvia, Luxembourg, the Netherlands and Portugal.
Source: Bureau of Economic Analysis; Eurostat; and OECD calculations.

Inflation in the US is –  to a significant extent – a direct consequence of the support to income, combined with inelastic or distorted supply.

But this is a US, not an euro area feature – and we should not be looking through US lenses when examining and discussing the EA.

The largest driver of inflation in the euro area is energy prices and we all know why: weather, low gas stocks and reserves, delayed maintenance in infrastructure, not enough investment, in particular in renewables, geopolitics, all of which cannot be resolved rapidly.

Different drivers of inflation call for different policy responses. While the US should gradually remove policy accommodation – which it is already doing for fiscal and has announced for monetary – the euro area has not gone to such an excess (on aggregate) and therefore has different policy requirements.

So what can we make of this looking forward?

Policy stance for 2022 and 2023

The euro area has successfully preserved income and jobs, keeping them in line with their pre-crisis level. This is less the case for demand as not only has consumption not recovered, but investment is also lagging behind –though this may change with NGEU.

The objective should now be to get GDP, employment and income up to pre-crisis trends – not just levels. And better, if possible: recall that GDP growth was 1.4% on average in the euro area for the decade pre-crisis, 2.2% in the US, and we were discussing the “great stagnation”.

What does that imply for policies looking forward?

  • The main driver of inflation in the euro area is not excess demand faced with supply shortages on aggregate, it is energy prices, and that means monetary policy is not the main tool to address it. On this, in the context of rising rates in the US we should recognise that the ECB has a challenging task to keep long term yields at low levels.
  • The energy situation is calling for a vigorous acceleration of investment in clean energy, rebuilding of stocks, and long-term planning to smooth energy bills and ensure the current winter situation is a temporary phenomenon. Clearly, there have been some policy and coordination failures here. The EU does not have the energy mix, infrastructure and policies to undertake the sort of rapid transition that is consistent with our emissions reductions commitments. Accelerating the operational implementation of the Green Deal will be crucial.
  • Employment, participation and hours of work, on aggregate across the euro area, in spite of a swift recovery, remain lower than in the US. This is central to potential growth and there is no room for complacency about the job situation. If GDP per capita is to rise above the trend expected prior to the crisis, reducing the debt burden, huge efforts are needed to bring more people into better jobs. This requires structural policies alongside ongoing demand momentum.
  • Fiscal policy, on aggregate, should remain agile and flexible to adapt to the evolving situation.

On the basis of the review I have just gone through, there is no reason to tighten the fiscal stance beyond removing those emergency programs that are no longer needed. 

There is only a stronger case for adjusting fiscal policy in  countries where consumption is clearly excessive, pushing inflation well above the euro area level.

The European Commission should be commended for having relaunched the European governance work, including the fiscal framework. As it will take time to reach a consensus, there are grounds for defining the 2023 fiscal stance on the ground I have laid out above, independently from any institutional framework.

Brussels, 17 January 2022


Do COVID certificates spur vaccination take-up? A snapshot of the recent evidence

By Nicolas Woloszko, OECD Economics Department.

Many OECD countries are in the grip of a new surge of COVID infections, hospitalisations, and deaths despite no shortage in supply of highly effective vaccines, especially in protecting against severe forms of the disease (Milman et al., 2021). COVID certificates, certifying vaccination status or a negative test, have been under consideration in many countries and mandated in some as a condition for population to access certain social and professional gatherings. Arguments for and against supporting their adoption have focused on its contribution to reduce transmission and severe forms of disease as well as on ethical concerns (Phelan, 2020; Sleat, Innes and Parker, 2021). In this context, one question that arises is how effective are COVID certificates in raising vaccination rates. Early and casual observations suggest that it has had a significant impact, but a rigorous assessment is needed to address the question.

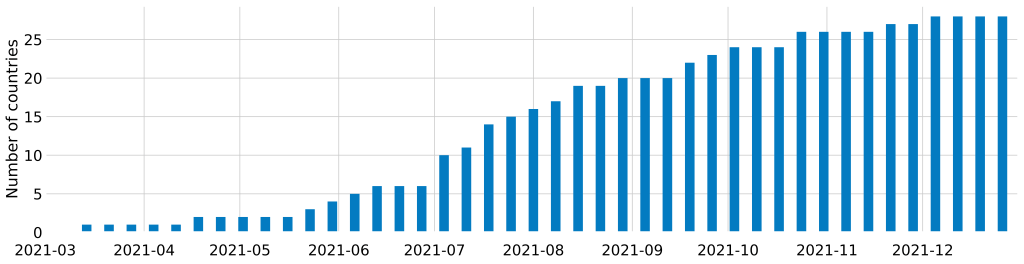
The adoption of COVID certificates has been swift across OECD countries, as 28 countries were requiring certificates from their citizens by the end of 2021 (Figure 1). The main features of COVID certificates vary across countries, not least in terms of scope and coverage. For instance, mandates can be required only in high-incidence areas (e.g. in Germany by the time of their introduction) or vary by region or occupation (e.g. Australia, Canada), whereas a large number of countries including France, Indonesia, Lithuania require COVID certificates to access most public facilities barring essential shops.

COVID certificates also differ regarding their validity criterion. For example, “2G” regimes1, which require immunity (through vaccination or recovery) are applied in contact-intensive services in Austria, in Italian public transport and will soon be implemented in France. More flexible “3G” certificates applied in Denmark, Estonia and Finland among others are also valid for individuals with a recent negative test. The stricter “2G+” criteria which requires both a proof of immunity and a negative test is applied for restaurants in Germany, Luxembourg and Switzerland. In a growing number of countries (including France, Greece, Lithuania or the Czech Republic) the validity of vaccination certificates will be reduced to 7-9 months after the primary vaccination with a booster shot required for renewal.

Early adopters include Israel2, Denmark3 and Austria4. There has been an acceleration during the summer as 17 countries introduced COVID certificates, especially among EU countries where the implementation of domestic COVID certificates had been facilitated by the launch of the EU Digital COVID certificate on 1 July 2021. This acceleration coincided with a substantial increase in vaccine uptake: between the week prior to the implementation of the COVID certificate and a month after, vaccination rates increased by 8 p.p. on average across these 17 countries.

Figure 1. Adoption of COVID certificates across OECD countries

Note: Blue bars show the number of OECD countries which implemented a COVID certificate. At the end of 2021, that includes 28 countries (Austria, Belgium, Bulgaria, Chile, Colombia, Croatia, Czech Republic, Denmark, Estonia, Finland, France, Germany, Greece, Israel, Ireland, Italy, Korea, Latvia, Lithuania, Luxembourg, Mexico, Netherlands, Portugal, Slovak Republic, Slovenia, Spain, Turkey and the United States).
Source: Author’s computations.

How much of this effect can be specifically attributed to certificates has yet to be conclusively analysed. Still, there is already substantial supporting evidence. First, qualitative or survey-based analyses for Lithuania (Walkowiak, Walkowiak and Walkowiak, 2021), Israel (Wilf-Miron, Myers and Saban, 2021), and Germany (Klüver et al., 2021) point to the fact that COVID certificates incentivise vaccination by granting vaccinated individuals additional freedoms. Second, a number of studies providing early quantitative evidence based on panel data econometrics have aimed at singling out the effect of COVID certificates on vaccination among other factors:

A recent focus by the Conseil d’Analyse Economique (Oliu-Barton, Pradelski, Woloszko et al., 2021) adds to this literature. It uses both a synthetic control approach and a model inspired from innovation diffusion theory to provide the following estimates of the gains in vaccination by the end of 2021 in the three largest EU countries from the implementation of COVID certificates: 13 p.p. in France, 6 p.p. in Germany, and 10 p.p. in Italy (Figure 2). Further, it broadens the scope of the analysis by providing an estimation of the health and economic benefits from the increased vaccination rates due to COVID certificates. First, it uses estimates of vaccine efficacy to quantify the number of lives saved due to higher vaccine rates (32% of COVID-related deaths in France, 5.6% in Germany, and 14% in Italy over the second half of 2021). Second, it resorts to an estimation of the elasticity between vaccination rates and weekly economic activity – computed using the OECD Weekly Tracker of GDP (Woloszko, 2020) – in order to quantify the impact of COVID certificates on GDP. The results suggest that by the end of the year, economic activity would have been lower by around a half percentage point in France and Italy and 0.3p.p. in Germany in the absence of the COVID certificates. Last, it argues that in France the COVID certificate may have been decisive to avoid reaching the high pressure on ICUs that prompted previous lockdowns.

Figure 2. Estimated vaccine uptake with and without COVID certificates

Note: The cumulative proportion of the whole population who received at least one COVID-19 vaccine dose in the actual intervention deployment (blue) and in the no-intervention counterfactual scenario (red). The counterfactual scenario is built via innovation diffusion theory and further validated by synthetic control. Black dashed vertical line is the date of the introduction of the COVID certificate.
Source: Oliu-Barton, Pradelski, Woloszko et al. (2021)

Based on these early analyses, a consensus seems to emerge that COVID certificates have had a significant and substantial impact on vaccine take-up, especially in France and Italy. However, this only explains a small part of the cross-country differences in vaccination rates. Overcoming vaccine hesitancy remains a big challenge facing policymakers in most countries at the turn of 2022, and more research is needed to better assess the potential role of other policy levers of vaccine uptake.

References

Abadie, A., A. Diamond and J. Hainmueller (2010), “Synthetic Control Methods for Comparative Case Studies: Estimating the Effect of California’s Tobacco Control Program”, Journal of the American Statistical Association, Vol. 105/490, pp. 493-505, http://dx.doi.org/10.1198/jasa.2009.ap08746.

Karaivanov, A. et al. (2021), COVID-19 Vaccination Mandates and Vaccine Uptake, National Bureau of Economic Research, Cambridge, MA, http://dx.doi.org/10.3386/w29563.

Klüver, H. et al. (2021), “Incentives can spur COVID-19 vaccination uptake”, Proceedings of the National Academy of Sciences of the United States of America, Vol. 118/36, https://www.pnas.org/content/118/36/e2109543118.

Mills, M. and T. Rüttenauer (2021), “The effect of mandatory COVID-19 certificates on vaccine uptake: synthetic-control modelling of six countries.”, The Lancet. Public health, Vol. 7/1, pp. e15-e22, http://dx.doi.org/10.1016/S2468-2667(21)00273-5.

Milman, O. et al. (2021), “Community-level evidence for SARS-CoV-2 vaccine protection of unvaccinated individuals”, Nature Medicine, Vol. 27/8, pp. 1367-1369, http://dx.doi.org/10.1038/s41591-021-01407-5.

Oliu-Barton, M. et al. (2021), The effect of COVID certificates on vaccine uptake, public health, and the economy, Conseil d’Analyse Economique, Paris.

Phelan, A. (2020), “COVID-19 immunity passports and vaccination certificates: scientific, equitable, and legal challenges”, The Lancet, Vol. 395/10237, pp. 1595-1598, http://dx.doi.org/10.1016/s0140-6736(20)31034-5.

Sleat, D., K. Innes and I. Parker (2021), “Are vaccine passports and covid passes a valid alternative to lockdown?”, BMJ, p. n2571, http://dx.doi.org/10.1136/bmj.n2571.

Walkowiak, M., J. Walkowiak and D. Walkowiak (2021), “COVID-19 Passport as a Factor Determining the Success of National Vaccination Campaigns: Does It Work? The Case of Lithuania vs. Poland”, Vaccines, Vol. 9/12, p. 1498, http://dx.doi.org/10.3390/VACCINES9121498.

Wilf-Miron, R., V. Myers and M. Saban (2021), “Incentivizing Vaccination Uptake: The “Green Pass” Proposal in Israel”, JAMA, Vol. 325/15, pp. 1503-1504, http://dx.doi.org/10.1001/JAMA.2021.4300.

Woloszko, N. (2020), “Tracking activity in real time with Google Trends”, OECD Economic Department Working Paper, OECD, Paris.


[1] The « Gs » stand for the German « geimpft, getestet, genesen » (vaccinated, tested, recovered).

[2] https://ijhpr.biomedcentral.com/articles/10.1186/s13584-021-00496-4

[3] https://www.healthcareitnews.com/news/emea/denmark-launches-covid-19-passport-coronapas

[4] https://www.thelocal.com/20210728/europe-how-does-use-of-health-passes-compare-in-europe-2/


COVID-19, Productivity and Reallocation: Hibernation, Not Zombification

By Dan Andrews, OECD Economics Department

The issue

The consequences of the pandemic for potential output will partly hinge on its impact on the reallocation of labour from low to high productivity firms. While Schumpeter proposed that recessions can accelerate this “cleansing” process, downturns can also distort reallocation dynamics if financial constraints result in the premature shakeout of productive but financially fragile firms. The pandemic could provide a further twist if job retention schemes delayed the restructuring of unproductive firms that would have otherwise contracted, thereby risking “zombification”. But timely evidence on this issue is scarce.

What we do

To fill this gap, two new OECD working papers explore how workforce adjustments (and exit) since early 2020 are connected to firm-level labour productivity, based on two high frequency firm-level datasets:

  • Xero – a cloud-based accounting software platform for small businesses – which supplies: i) data for Australia, New Zealand and the United Kingdom; ii) novel variables (e.g. hours worked and usage of E-commerce and cashflow reporting and management apps); and iii) analysis of reallocation and productivity before and after the onset of the pandemic.
  • Single Touch Payroll (STP) – which contains data on employment for most Australian firms since early 2020 – merged with Business Income Tax data from 2018/19. Crucially, this dataset contains flags on participation in JobKeeper (Australia’s job retention scheme).
What we find

Reallocation remained productivity-enhancing

Both papers show that while overall rate of job reallocation fell following the onset of the pandemic, a non-trivial share of firms were still adding or shedding workers, and this reallocation process remained connected to productivity. That is, the tendency for high productivity firms to expand and low productivity firms to contract – which propels medium-term productivity growth – remained intact.

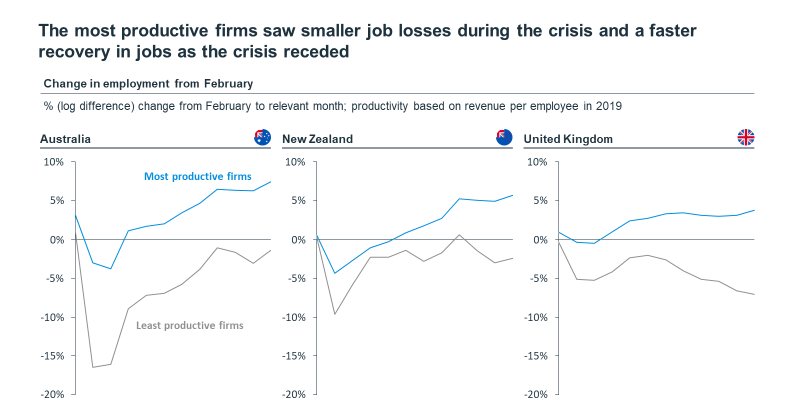
Workforce adjustments remained connected to firm productivity, on both the heads and hours worked margins. This was especially the case in Australia, as reflected by a large gap in employment growth between firms in the top and bottom productivity quartiles (Figure).

Source: Andrews et al. (2021). Xero Small Business Insights

The pandemic also coincided with a temporary strengthening of the reallocation-productivity link in Australia and the United Kingdom over the first half of 2020, relative to 2019. But the reverse is true for New Zealand, which may partly reflect the earlier introduction of New Zealand’s job retention scheme, which also protected a greater share of workers than the JobKeeper scheme in Australia.

Firms that intensively used Apps to manage their business were more resilient, even after controlling for productivity. Thus, while policy partly thwarted creative destruction, the nature of the shock – i.e. one where being online and able to operate remotely were key – potentially favoured high productivity and tech-savvy firms, resulting in a reallocation of labour to such firms.

Job retention schemes played a nuanced role

That the reallocation-productivity link remained intact is surprising, given the large scale of Australia’s JobKeeper Scheme. JobKeeper provided broad-based crisis support from April to September 2020 (JobKeeper 1.0), but was then phased-out and firms had to re-apply for support (under JobKeeper 2.0).

Productivity-enhancing reallocation was actually stronger in those local labour markets that had a higher proportion of workforce in receipt of JobKeeper. This is consistent with the fact that JobKeeper 1.0 disproportionately shielded productive but financially fragile firms – a pivotal group who’s premature shakeout can impart scarring effects.

But the scheme grew more distortive over time, with JobKeeper 2.0 (from October 2020) more likely to support low productivity firms. In fact, there was virtually no productivity-enhancing labour reallocation in those local labour markets where the reach of JobKeeper 2.0 remained pervasive. By contrast, where a large amount of the workforce exited the scheme, more labour flowed towards high productivity firms.

What this means

The use of timely data to investigate the allocative effects of the pandemic is significant, given that the seminal paper on reallocation during the Great Recession arrived six years after Lehman Brothers collapsed (Foster et al., 2014). Yet, the pandemic may also shape productivity via other channels –digitalization, global knowledge spillovers and human capital – that will only become clear over time. 

This analysis suggests that job retention schemes can potentially protect workers from scarring without significantly distorting firm dynamics. While some initial concerns about zombification may have been overplayed, there is a fine line between such policies being supportive and distortive. This underscores the need for job retention schemes to be truly temporary and to evolve as economic conditions change.

References

Andrews, D., A. Charlton and A. Moore (2021), “COVID-19, Productivity and Reallocation: Timely evidence from three OECD countries”, OECD Economics Department Working Paper No. 1676. https://doi.org/10.1787/d2c4b89c-en.

Andrews, D., E. Bahar and J. Hambur (2021), “The COVID-19 shock and productivity-enhancing reallocation in Australia: Real-time evidence from Single Touch Payroll”, OECD Economics Department Working Paper No. 1677. https://doi.org/10.1787/2f6e7cb1-en

Foster, L., C. Grim and J. Haltiwanger (2014). “Reallocation in the Great Recession: Cleansing or Not?,” NBER Working Paper 20427.


Hungary: Policies for a stronger and sustainable recovery

By Jens Høj and Martin Borowiecki, OECD Economics Department 

The COVID-19 pandemic abruptly ended the strong economic growth performance in 2016-19, which entailed large increases in employment and real incomes, and the lowest unemployment rate in thirty years. What followed was a severe economic contraction as containment measures and a drop in international demand hit hard the export-oriented economy.  

The Hungarian economy is now emerging from the crisis. A fast vaccination rollout allows a rapid economic recovery from mid-2021 onwards. The 2021 Economic Survey of Hungary projects annual growth of about 5% per annum in 2021 and 2022, with GDP recovering to pre-crisis level at the beginning of 2022. The recovery will be driven by the release of pent-up demand and stronger external demand.  

Prepare for fiscal consolidation once the recovery becomes self-sustained 

However, the crisis is not over yet. Uncertainties around the strength of the recovery remain, reflecting the potential scarring of the economy arising from the prolonged crisis. For instance, semiconductor shortages could continue to interrupt the Hungarian car production. Also, new COVID variants may emerge and could potentially lead to new restrictions and lower domestic spending. The Survey recommends to continue to provide targeted fiscal support as needed. Once the recovery has become self-sustained, the government should prepare for fiscal consolidation. Such consolidation is needed to address long-term fiscal challenges that arise from population ageing.  

Exit from unconventional monetary policy measures  

As the recovery gathers pace, a combination of stronger wage growth and supply shortages could fuel rising inflation expectations. Inflation is above the inflation target of 3% and moved outside the central bank’s upper tolerance band of + 1% in spring 2021. Now is the moment to gradually exit from unconventional monetary policy measures. Monetary policy should also continue to increase policy interest rates if inflation expectations become unanchored.

Reforms for strong and sustainable growth 

As the recovery becomes self-sustained, attention should be given to structural reforms to secure the impressive income gains achieved before the pandemic. The OECD Economic Survey of Hungary highlights three main challenges to long-term growth and provides recommendations to address them.  

Bolster productivity growth 

First, population aging will lead to an older and smaller work force, reducing growth. Demographic change makes it necessary to improve the productivity performance of the economy, which has been weak in the decade leading up to the pandemic. Stronger productivity growth will help to continue the income gains achieved before the pandemic and close the income gap vis-à-vis richer OECD members.  

The OECD provides in this Survey key recommendations to achieve faster productivity growth. In the near-term, the employment prospects of low‑skilled workers need to be raised through skills upgrading and higher labour mobility. Thereafter, faster productivity growth requires improved vocational and tertiary education, more competitive markets, and faster adoption of new technologies, particularly to accelerate the digital transformation of the economy (Figure 1). Also, intensifying efforts to fight corruption would ensure a better use of public resources, including the efficient use of procurement in the roll-out of public investments, and foster stronger business dynamics. 

Figure 1. Hungary lags in ICT adoption

Note: Firms from the financial sector are excluded. High-speed broadband are subscriptions with 100+ Mbps.
Source: OECD ICT Access and Usage by Businesses database.

Secure the fiscal sustainability of the pension system 

Second, population ageing is accelerating, boosting ageing-related spending in areas such as health and pensions. If not contained, these will lead to sharp increases in public debt. This reflects that many pensioners retire early, despite recent increases in the effective retirement age. Addressing this challenge requires longer and healthier work lives.  

To this end, the OECD recommends to complete the ongoing increase of the statutory retirement age to 65 by 2022, and thereafter, to link further increases to gains in life expectancy. To prepare the health care system for an older workforce, the autonomy of hospitals should be enhanced to adjust the supply of health services to future needs. 

Improve environmental outcomes 

Third, better environmental outcomes require a further decoupling between economic growth and greenhouse gas emissions. Environmental policy is currently based on a combination of regulations, subsidies and tax rates that vary across sectors. This means that polluters do not necessarily pay the cost of pollution. In addition, prices of energy, water and waste collection are regulated for affordability reasons, often to below-cost levels. Low regulated prices discourage investment in much-needed greener technologies. Addressing the challenge of reducing greenhouse gas emissions requires setting higher and more uniform prices on emissions.  

To make polluters pay a higher price for polluting, the OECD recommends to gradually unify carbon taxes. Non-carbon environmental taxes should be set according to the polluter pays principle. In addition, the government should ensure cost recovery in regulated energy sectors. Higher waste collection fees and water and wastewater service tariffs can help finance the needed investments. To help low-income households, the government should introduce well-targeted affordability measures.  

References 

OECD (2021), OECD Economic Surveys: Hungary 2021, OECD Publishing, Paris, https://doi.org/10.1787/1d39d866-en


How businesses are surviving the Covid-19 shock

By Sebastian Barnes, OECD Economics Department, and Robert Hillman, Neuron Capital.

As the economy locked down in March 2020, there were big concerns about how businesses would survive being unable to open normally with retail premises, offices, factories and construction sites closed. There was a fear that these pressures could trigger a “domino effect” that would ripple through the business sector, leading to widespread job losses and bankruptcies.

The Corporate Sector Agent-Based (CAB) Model was developed to look at these questions, taking into account the differences across firms in their activities and financial strength, how firms interact with each other through customer-supplier networks, the rule-of-thumb adjustments firms make and the risk of bankruptcy. Agent-based models are simulation models that build up the behaviour of the aggregate economy from the interaction of individual units. This can lead to insights on aggregate and microeconomic behaviour.

The CAB takes a data-rich approach to building a model of the United Kingdom business sector based on the Input-Output connections between sectors, firm characteristics from ORBIS data and evidence on network connections between firms. In the real world, many firms are heavily reliant on a small number of suppliers and customers. Matching final demand to the downturn in UK output during the Covid-19, the model sheds light on the mechanisms at work and alternative policy scenarios.

In the absence of any policy response, the Covid-19 shock would have led to a large and lasting fall in output: over 15% of firms would have failed in the first two years, far above the normal rate and similar to during the Global Finanicial Crisis. Almost a quarter of firms in the Accommodation and Food sector would have failed. The reasons for individual firm failure are multi-factored and simple “domino effects” are rare.

The UK rapidly mobilised a large-scale firm-level support programmes from spring 2020, including the Coronavirus Job Retention Scheme (CJRS) “furlough” program and a credit guarantee that helped businesses to borrow.

The massive policy response has been highly effective in supporting output and avoiding firm failure. The initial fall in output was reduced and the policy support allows activity to recover after two years to close to what it would have been without Covid-19.

Figure 1. With massive policy support, the depth and persistence of the Covid-19 loss of output has been reduced

Source: Authors’ calculations based on CAB model.

The model predicts that the rate of firm failures with this policy support should be lower than in normal times, as has been observed in the UK bankruptcy statistics to date. As the Table shows, this counterintuitive outcome reflects the fact that policy has protected almost all the previously profitable firms that would have failed as result of the Covid-19 shock, but also allowed more than half of firms that would have failed in normal times to survive.

Table 1. Policy supports have protected firms hard hit by Covid-19 and also supported firms that were already vulnerable
% share of firms

The survival of less productive firms raises the risks in the years ahead of unproductive “zombie firms” weighing on productivity. They may be joined by other firms that were previously successful, but whose business models have been permanently disrupted by Covid-19 and its effects. These firms may be able to survive financially for a long time, but have little prospect of contributing to the growth of the economy.

Could policy have been better targeted?  An approach, for example, of only helping previously profitable firms or those in severely affected sectors would have led to fewer inherently weak firms surviving, but at the cost of lowering incomes for workers and slowing the recovery.  Given the many challenges of targeting, the use of broad supports during the Covid-19 crisis appears justified.

Further reading

Barnes, S., R. Hillman, R., G. Wharf and D. McDonald et al. (2021). “The impact of Covid-19 on Corporate Fragility in the United Kingdom: Insights from a new calibrated firm-level Corporate Sector Agent-Based (CAB) Model”, OECD Economics Department Working Papers, No. 1674, Paris, OECD Publishing

Demmou, L. et al (2021), “Insolvency and Debt Overhang Following the Covid-19 Outbreak: Assessment of Risks and Policy Response”, I OECD Economics Working Paper,  No. 1651, Paris, OECD Publishing

Hillman, R., S. Barnes, G. Wharf and D. McDonald et al. (2021). “A new firm-level model of corporate sector interactions and fragility: the Corporate Agent-Based (CAB) Model”, OECD Economics Department Working Papers, No. 1675, Paris, OECD Publishing.


The Tortoise and the Hare: The Race Between Vaccine Rollout and New COVID Variants

by David Turner, Balázs Égert, Yvan Guillemette and Jarmila Botev, OECD Economics Department

Variants of the virus causing COVID-19, notably the so-called ‘UK variant’, account for a large part of the resurgence of infections in many OECD countries since the latter part of 2020. Seasonal effects also drive fluctuations in virus incidence. More recently, vaccination has been very effective at curbing COVID-19 infections, substituting for lockdown policies at much lower costs to the economy. Those are among the main findings of a recent Economics Department Working Paper ­– The Tortoise and the Hare: The Race Between Vaccine Rollout and New COVID Variants – an update to a previous version of the study published last year.

The study relates country-level daily reproduction numbers for OECD countries to several potential explanatory factors, including containment policies, public-health policies, seasonal conditions, the prevalence of variants, vaccination rates as well as proxies for spontaneous behavioural changes and natural immunity, all at once within the same framework. It also relates containment policies to the OECD weekly GDP tracker to study their effects on economic activity.

Some new variants of the virus are estimated to be able to boost the effective reproduction number by up to 50%. Seasonal effects are also found to increase the effective reproduction number in fall/winter, in some countries by up to 25% relative to summer. The rapidity of these adverse shocks represent a major challenge to policy-makers because they can coincide and take full effect over a matter of a few months. The two effects together can potentially boost reproduction numbers by up to 90%.

Thankfully, vaccination is found to powerfully reduce the spread of the virus. The estimated effects can be stated in intervention-equivalent terms (see figure). Fully vaccinating…

  • 7% of the population is equivalent to either complete school closure, requiring people not to leave the house with minimal exceptions, or banning all public gatherings;
  • 15% of the population is equivalent to closing down all-but-essential workplaces;
  • 20% of the population is equivalent to closing down all-but-essential workplaces as well as public transport;
  • 50% of the population is equivalent to simultaneously applying all of the above restrictions as well as closing all international borders.

And, of course, vaccination does not have the damaging effects on economic activity that lockdown policies have, rather it boosts activity by enabling lockdown policies to be eased. The study’s results are used to examine a few scenarios that differ in the presence of COVID variants and the speed of vaccination.

In a baseline scenario without variants nor vaccines, stringent containment policies are needed to keep the reproduction number below 1, and the situation is nevertheless precarious in that many factors, including seasonal influences, have the potential to push the reproduction number above 1 and so lead to a surge in infections.

Another scenario assumes that the UK variant becomes predominant, leading to an increase in transmissibility of the virus by 35%. It shows that with only 13% of the population fully vaccinated (which corresponds to the OECD median in mid-May), the reproduction number remains above 1. Policy-makers then face difficult choices about which containment policies to tighten further. For instance, schools might need to remain closed full time, which would be just sufficient to keep the reproduction number below 1.

A more optimistic scenario illustrates how quick vaccine rollout not only avoids the need to tighten containment polices despite the presence of the UK variant, but enables those in place to be progressively relaxed. For example, with 40% of the population fully vaccinated (which is close to the shares in the United States and United Kingdom at end-May), there is no need for any stay-at-home requirements or workplace closure and restrictions on gatherings can start to be relaxed, which has the added benefit of raising GDP by 4% relative to the baseline scenario.

Together, the scenarios suggest that a rapid rollout of vaccinations is needed to compensate for the pressure from more infectious variants and avoid a cycle of stop-and-go mitigation policies. For those countries now going into summer, it is also important that policy-makers are not lulled into a false sense of security by the temporary decline in reproduction numbers due to seasonal factors, as in the summer of 2020. Failure to vaccinate a sufficient share of the population could then lead to a resurgence of the virus in the winter as seasonal factors reverse.

Further reading

Turner, D., B. Égert, Y. Guillemette and J. Botev (2021), “The Tortoise and the Hare: The Race Between Vaccine Rollout and New COVID Variants”, OECD Economics Department Working Papers, No. 1672, Paris, OECD Publishing.


América Latina tras el COVID-19: cómo impulsar una recuperación tan deseada

Jens Arnold, Aida Caldera-Sánchez, Paula Garda, Alberto González Pandiella, Alvaro S. Pereira. Departamento de Economía, OCDE

América Latina es una de las regiones más golpeadas por el COVID-19 y tendrá una recuperación más lenta. La región ha concentrado cerca de 1 millón de muertes, o un tercio del total de muertes por COVID-19 en el mundo. En términos económicos también es la región que más se ha visto afectada en mundo con una caída del PIB de alrededor de 7% en 2020, comparado con 5% de media en la OCDE. Esto es debido a las características estructurales de la región: sistemas sanitarios y redes de seguridad social débiles, grandes sectores informales, fuerte dependencia del turismo, gran proporción del empleo en ocupaciones no compatibles con el trabajo a distancia, y un margen limitado para el apoyo fiscal. Hacia adelante la OCDE prevé que el crecimiento de seis grandes economías de la región, que abarcan alrededor del 85% del PIB de América Latina, sea del 4.9% en 2021, y un 2.8% en 2022 (Tabla). La recuperación de la actividad económica se ha frenado a inicios del 2021, frente a las nuevas medidas de contención en la mayoría de los países de la región, y se retomará a medida que avanzan los procesos de vacunación y mejora la situación sanitaria. Pero la recuperación será gradual, sin recuperar el terreno perdido en el PIB per-cápita ni siquiera en 2022 (Gráfico 1).

Existe una alta incertidumbre en torno a la evolución de la pandemia y los procesos de vacunación, así como importantes vulnerabilidades. La prioridad inmediata en la región debe ser evitar más brotes del COVID-19, fortaleciendo los sistemas de salud y acelerando la vacunación, siguiendo el ejemplo de Chile que ha visto uno de los procesos de vacunación más rápidos del mundo. En este sentido, la cooperación internacional y la efectiva distribución de vacunas a través de COVAX será crucial. En algunas economías de la región el incremento de los precios de las materias primas está dando un respiro a las apretadas arcas fiscales y un viento de cola a la inversión y al crecimiento económico. El aumento de las remesas y el crecimiento de la economía global también apoyan positivamente, particularmente a las economías más abiertas. Sin embargo, la región tiene cuentas fiscales frágiles y es muy sensible a cambios en las condiciones financieras globales, como se vio a inicios del 2021. Episodios de violencia y malestar social, presentes desde antes de la pandemia, siguen siendo un riesgo más que vigente, que podrían retrasar la recuperación. El incremento de la deuda pública, debido a los esfuerzos que han hecho muchos países para paliar los efectos negativos del COVID-19, dejan sólo un estrecho margen para la política fiscal, si no se hacen reformas (como ya lo discutimos aquí), y es una de las principales vulnerabilidades en la región. Asimismo, se aproximan años de elecciones en varios de los países de la región. Todos esos factores crean un ambiente de incertidumbre y volatilidad.

Para lograr la tan deseada recuperación, América Latina tiene que revertir el impacto negativo de la pandemia y continuar reduciendo la pobreza y las desigualdades, que ya eran altas antes de la pandemia. Las cifras en algunos países de la región ya comienzan a mostrar que la pobreza y la desigualdad de ingresos se han incrementado, con pérdidas de empleo que alcanzan a más de 14 millones de personas desde que empezó la pandemia. Los más vulnerables fueran los más afectados: las mujeres, los más jóvenes, y los trabajadores informales (Gráfica 2, panel A). La recuperación del empleo es incipiente, pero está liderada por los informales, amenazando con un aumento persistente de la informalidad. Y esto es aún más grave para los jóvenes, ya que los primeros trabajos tienden a tener impactos duraderos en sus carreras y salarios.

El cierre de las escuelas puede tener graves consecuencias a largo plazo. Con 300 días de escuela perdidos, el doble de la media de países OCDE (panel B), América Latina ha sido la región del mundo donde las escuelas han estado más tiempo cerradas. A día de hoy, unos 114 millones de estudiantes siguen sin poder asistir en persona. El efecto es aún más negativo para los más vulnerables, aquellos que no tienen acceso a educación digital y conectividad, y a tantos niños de hogares más desfavorecidos que han abandonado la educación escolar por completo. Es probable que la pandemia amplíe las ya elevadas brechas de resultados educativos por nivel socioeconómico, impactando negativamente los salarios futuros y la productividad e incrementando fuertemente la desigualdad de oportunidades (como lo demuestran Lustig y coautores aquí). El cierre de escuelas limita además el crecimiento del empleo femenino, que ha sido uno de los más impactados por la pandemia. 

Es más urgente que nunca emprender reformas que permitan una rápida recuperación asegurando al mismo tiempo que nadie se quede atrás. Las trasferencias monetarias, el mayor acceso a los beneficios de desempleo y/o subsidios al empleo y a la contratación son fundamentales para mitigar los impactos negativos de la crisis y acelerar la recuperación. Y más allá de la necesidad de mantenerlos hasta que la recuperación esté afianzada, este es el momento oportuno para repensar y fortalecer los mecanismos de protección social de forma permanente (como lo hemos hablado aquí). Esfuerzos para reducir la carga regulatoria son particularmente pertinentes en este momento ya que facilitarían la creación de empresas y empleos formales sin impactos significativos en los presupuestos. Como por ejemplo reduciendo los elevados costes de registro para las empresas (especialmente las PYMEs y las empresas nuevas), o costes laborales no salariales elevados (e.g. Colombia) o las contribuciones a la seguridad social para los trabajadores de bajos ingresos (Argentina).

No menos importantes son mejorar la educación y los sistemas de capacitación. Programas de recuperación y para reintegrar en el sistema educativo a aquellos que lo abandonaron durante la pandemia son fundamentales para revertir los impactos negativos de los cierres de escuelas. Reasignar más recursos hacia las etapas más tempranas de la educación (preescolar y primaria) y la escolarización a jornada completa (e.g. Colombia) ayudaría a hacer los sistemas educativos de la región más equitativos y paliar los efectos de la pandemia. Reforzar los sistemas de capacitación ayudaría a los trabajadores, en especial a los más vulnerables, a encontrar trabajos de calidad en el mundo post-Covid.

Lo que la región haga ahora determinará la rapidez con la que se recupere y el tipo de recuperación. No es momento de retirar el apoyo fiscal a las economías y debilitar la incipiente recuperación, pero los países deben comenzar el proceso de discusión e identificación de las reformas para recomponer la situación fiscal. Una implementación creíble, que puede ser gradual, es clave para asegurar la sostenibilidad de las finanzas públicas y revertir los aumentos de pobreza y desigualdades. En muchos países de la región, la fuerte y necesaria acción de las políticas fiscales en apoyo de los más afectados dejará cuentas a pagar en el futuro. Los países tendrán que aumentar los ingresos fiscales y repensar algunos gastos existentes. En el actual contexto de incertidumbre en los mercados financieros, será importante reforzar la voluntad de pagar esa cuenta en el futuro para no afectar el acceso a financiamiento y aumentar los gastos con intereses, porque eso dejaría aún menos recursos para áreas prioritarias como salud, educación o protección social.

Con la recuperación afianzada se puede crear el consenso social para lograr una mayor progresividad tanto en los impuestos como en los beneficios sociales. Todos los países de la región tienen margen para incrementar la eficiencia del gasto, focalizar el gasto social en los más vulnerables, incrementar la progresividad de los impuestos sobre la renta y reforzar la lucha contra la evasión fiscal. Incrementar el uso de impuestos verdes, siempre que se compense a los más vulnerables, tiene el doble beneficio de acelerar la transición hacia una economía baja en carbono e incrementar recursos fiscales. Fortalecer los marcos fiscales, incluyendo las reglas fiscales y los consejos fiscales independientes ayudaría a incrementar la credibilidad en la sustentabilidad de las finanzas públicas.

Tabla. Perspectivas Económicas para América Latina

Nota: AL es la media ponderada por PIB a paridad de poderes de compra de los 6 países en la tabla.
Fuente: Perspectivas Económicas de la OCDE n. 109, mayo 2021.

Gráfico 1. La pandemia está dejando un daño duradero en América Latina

Nota: AL se refiere a la media ponderada por PIB a paridad de poderes de compra de Argentina, Brasil, Chile, Colombia, Costa Rica y México.
Fuente: Perspectivas Económicas de la OCDE N. 109, mayo 2021 y N. 106, noviembre de 2019.

Gráfico 2. El impacto desigual del COVID-19

Nota: En el Panel A, AL es el promedio simple de Argentina, Brasil, Chile, Colombia y México. En el Panel B, AL es el promedio simple de Argentina, Brasil, Chile, Colombia, Costa Rica y México. Informales medidos como trabajadores sin seguridad social, salvo en Colombia que son trabajadores en empresas de menos de 5 empleados. El cierre de escuelas se mide en días desde marzo 2020 hasta abril 2021. La definición de cierre parcial se refiere a sólo algunos niveles o categorías, por ejemplo, sólo la escuela secundaria, o sólo las escuelas públicas. Cierres regionales cuentan como ½.
Fuente: Cálculos de la OCDE en base a Encuestas del Mercado laboral: INE- ENE para Chile, INEGI-ENEO nuevo y ENEO para México, DANE-GHEI-Mensual, IGEB-PNAD para Brasil, INDEC- EPH para Argentina y Oxford COVID-19 Government Response Tracker.

Para leer en más detalle sobre las proyecciones macroeconómicas, así como los principales desafíos estructurales ir al reporte en la o la versión español y portugués o versión inglés (que incluye proyecciones para todos los países de la OECD y principales desafíos).

Información detallada para estos 6 países con sus notas país correspondientes:

Argentina | Brasil | Chile | Colombia | Costa Rica | México