Confronting Climate Change in the Philippines: Building Resilience while Cutting Emissions
Category: Climate,Philippines
written by oecdecoscope | February 13, 2026
Climate change is not a distant threat for the Philippines. Preparing for a warmer and more volatile future will require building on past progress in investing into climate change adaptation, combined with carbon pricing and cleaner power generation.
By Patrick Lenain, Senior Associate, Council on Economic Policies
Climate change is not a distant threat for the Philippines. Mean land temperatures have already increased by roughly 1.4°C compared with the mid-20th century, typhoons are intensifying, sea levels are rising, and the frequency of heatwaves and heavy rainfall are increasing. Long-term modelling suggests that GDP losses could reach 4% by 2040 and 17% by 2070. (Figure 1).
Preparing for a warmer and more volatile future
Recognising that further increases in temperatures are inevitable, the government has adopted a National Adaptation Plan for 2023–2050 covering eight priority sectors, including agriculture, water, health, ecosystems and infrastructure. The plan emphasises stronger infrastructure, social protection, empowered local governments and nature-based solutions to reduce vulnerability and integrate adaptation into development planning.
Over the longer term, adaptation financing needs could reach roughly USD 100 billion between 2025 and 2040. Yet, the economic case for early action is strong. Investments in resilient infrastructure and improved agricultural techniques could significantly reduce projected output losses if executed efficiently. This will require strengthened governance for procurement, including high levels of transparency and accountability.
Agriculture illustrates the urgency of adaptation. Rising temperatures have already reduced rice yields. Saltwater intrusion, drought and pest outbreaks are compounding risks. Policy responses include drought-tolerant crops and climate-smart farming practices, but scaling these measures will require stronger research capacity and sustained investment.
Focusing on nature-based solutions will offer large benefits. Mangroves, forests and coral reefs provide coastal protection, support fisheries and sustain tourism while acting as carbon sinks. Market-based payments for ecosystem services and participation in carbon markets could help finance conservation and strengthen community resilience.
Adaptation also demands macro-financial readiness. Climate shocks can push non-performing loans higher and erode banks’ capital buffers, underscoring the need for stress testing and supervisory tools that integrate physical and transition risks. Without such safeguards, climate events could give rise to financial stability risks.
Bending the emissions curve
Although the Philippines remains a relatively low emitter due to its service-oriented economy, emissions are rising quickly (Figure 2). If this trajectory continues, the country risks locking in a more carbon-intensive growth path than necessary. The government has pledged to reduce greenhouse-gas emissions and is preparing its new Nationally Determined Contribution for 2025-30 with this objective.
The electricity sector sits at the centre of decarbonisation challenges. The government aims to raise the renewable share of electricity from 21% today to 35% by 2030 and 50% by 2040. At present, however, coal remains the main source of electricity generation (Figure 3). A moratorium on new coal plants has signalled progress, but exemptions introduced in 2025 risk undermining the policy. Early retirement of coal facilities could avoid hundreds of millions of tonnes of CO₂, with large environmental benefits.
Carbon pricing remains too modest to provide strong incentives for shifting to renewable energy sources. Coal excise duties correspond to roughly EUR 1 per tonne of CO₂ — far below estimates of the social cost of carbon. Aligning energy excise taxes with carbon contents and moving forward with an emissions trading system would sharpen price signals and steer capital toward low-carbon technologies.
Renewable energy auctions, fiscal incentives, streamlined permitting and full foreign ownership to attract investment have had more success in supporting the shift to renewable energy sources. A flagship project is Terra Solar, expected to be the world’s largest integrated solar and battery facility, with 5 million solar panels, 3.5 GW of photovoltaic capacity and 4.5 GWh of storage. To accommodate intermittent generation, new solar projects are required to include at least four hours of storage and the government is upgrading the grid under the Smart Grid and Green Plan.
A positive adaptation-mitigation nexus
While adaptation and mitigation are often treated as separate agendas, they are very much interconnected. Climate resilience supports growth, protects fiscal sustainability and shields the financial system, while decarbonisation reduces long-term physical risks and strengthens energy security. Mangrove restoration is a textbook example: it can protect coastlines from storm surges while also storing large amounts of carbon.
The overall policy direction taken by the Philippines is welcome: integrate climate risk into macroeconomic policy, mobilise private capital, expand nature-based solutions and accelerate the energy transition. What matters for the years to come is to continue this course, with an even stronger focus on well-executed and transparent public adaptation investment, sufficient carbon pricing and a continued move away from coal-fired power generation.
How OECD Economic Surveys reveal the drivers of deforestation, and the policy tools to stop it
By Michael Koelle, OECD Economics Department
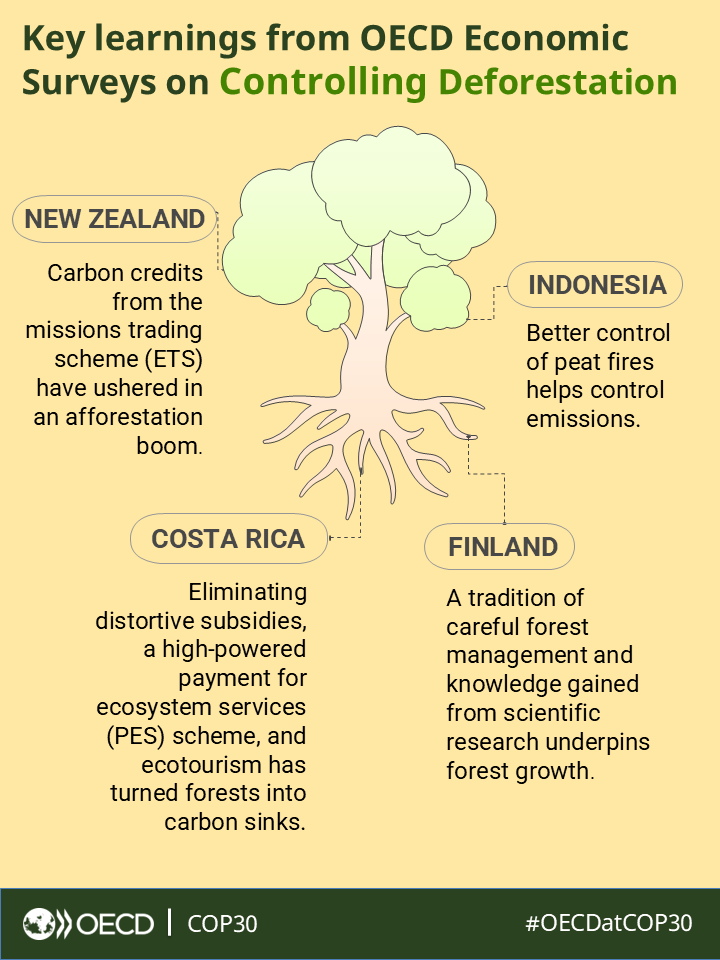
Tropical forests cover vast swaths of land in many OECD member and accession countries, including more than 75% of Costa Rica’s territory, and over half of Brazil, Colombia, Indonesia and Peru. In these countries, emissions from land use, land use change and forestry (LULUCF), largely driven by forest loss and degradation, account for a large share of total emissions (Figure 1). In fact, land use emissions are in some cases the main driver of national emission trends. But forests can also be part of the solution, as the experiences of Finland and New Zealand, two forest-rich OECD members, teach us.
For many countries, forests are no longer just a conservation issue, they are central to climate mitigation plans. Turning forests into carbon sinks is one of the most cost-effective ways to offset hard-to-abate emissions from agriculture, transport and energy. Finland and New Zealand have long had negative LULUCF emissions thanks to sustainable forest management and afforestation. Costa Rica managed to turn around LULUCF emissions, converting its forests into a carbon sink. Indonesia aims to achieve net negative emissions from LULUCF by 2030 while in Peru and Brazil, LULUCF accounts for 65% and 38% of planned emissions reductions by 2050, respectively. The economic case for protecting forests, through stronger enforcement, property rights, sustainable agriculture, and better incentives, has never been clearer.
Insights from Economic Surveys: What’s really driving deforestation?
What do Brazil, Costa Rica, Colombia, Finland, Indonesia, New Zealand, and Peru have in common? They are all forest-rich economies, and each has been subject of in-depth analysis in OECD Economic Surveys. These studies go beyond emissions reporting. They dig into the underlying economic drivers of deforestation and discuss what can be done to turn forests into carbon sinks. While each country has its own context, common drivers of deforestation emerge. Forest loss is rooted in economic structures and incentives, from the rapid expansion of agriculture to unclear or unenforced property rights and misalignment between individual incentives and broader societal goals. Developing forest-based activities that generate sufficient economic value while keeping forests intact is far from impossible, given that cleared forest land is often used for low-profitability activities. Moreover, as seen in Finland and New Zealand, afforestation can be one of the least costly ways to reduce net greenhouse gas emissions. Tackling deforestation therefore requires structural policy responses that make choosing forests the economically sensible option, not just environmental regulation.
Fostering sustainable agriculture
Across all countries studied the expansion of the agricultural frontier is the main driver of deforestation. In Peru, OECD research shows that 90% of all deforested land is used for agriculture and livestock-rearing (Garcia Soto and Koelle, 2025). Moreover, 75% of these lands are identified as mixed-use, where farmers combine crop growing and livestock grazing on relatively small plots. In Brazil, cattle is a major pressure; in Indonesia, palm oil plantations continue to push into forest areas. Cattle grazing was also a main driver of deforestation in Costa Rica and Colombia. Most of these activities have low productivity and profitability, making extensive use of underpriced land. As Finland’s experience shows, managing soil emissions from agriculture and forestry can become a crucial issue even when forest stocks have stabilised.
To address this, OECD Economic Surveys recommend:
Eliminating environmentally harmful agriculture subsidies, such as cattle ranching subsidies, which contributed to successful reforestation in Costa Rica.
Improving scientific knowledge of agriculture, soils and forests, which provides the basis for cost-efficient emissions reduction and carbon storage activities in Finland.
Boosting productivity on existing land, to reduce pressure to expand the agricultural frontier.
Incentivising agroforestry and sustainable land-use practices and enforcing compliance with the law and regulations tied to land rights.
Strengthening property rights
Most deforestation occurs on land that is either publicly owned or of unclear or unenforced property rights. In Peru, state lands without designated purpose are at the highest risk for deforestation. In Colombia, land rights are often unclear and ambiguous after decades of conflict and displacement of rural populations. In Brazil, a strong framework exists, but enforcement is a challenge. Indigenous communities are especially vulnerable in defending their property rights, even if formally recognised.
OECD Economic Surveys recommend:
Creating comprehensive land registries using modern technology.
Strengthening property rights and law enforcement in remote areas, including based on satellite imagery.
Recognising and enforcing indigenous land rights, which are linked to lower deforestation rates.
Aligning incentives with climate goals
Even with secure land rights and strong enforcement, forest conservation must make economic sense. Intact forests need to generate real value for communities and landowners. Payment for ecosystem services (PES) that provide payments to forest owners for forest preservation are an essential policy tool. Costa Rica’s model stands out: funded by an earmarked portion of fuel taxes it covers 40% of all the nation’s forests, even if financing needs to be put on a broader footing. Other countries have significantly underfunded PES systems or rely mostly on international mechanisms like REDD+ and Article 6 of the Paris Agreement that provide a global mechanism for protecting the world’s remaining forests, but implementation is slow and partly untested. The possibility to sell carbon credits through emissions trading schemes (ETS) can provide powerful incentives for reforestation. New Zealand’s pioneering inclusion of forestry in its ETS, where forest owners can earn carbon credits for capturing carbon through tree growth and must surrender credits if they deforest, provides useful lessons on how such schemes should be designed in forest-rich countries. There should be differentiation according to the emissions removal potential of different forest types, and the design should ensure a sufficiently high carbon price to incentivise carbon-efficiency in non-LULUCF sectors.
The OECD Economic Surveys call for:
More robust, broader, and sustainably financed payment for ecosystem services schemes and the expansion and integration of emissions trading schemes.
Better integration of eco-tourism, agroforestry, pisciculture and sustainable timber industry into regional economic development and planning.
Public incentives that complement, not contradict, private-sector logic.
Conclusion
To truly value forests, governments must embed them into national budgets, tax systems and investment frameworks. Forest conservation must be seen as a sensible investment into preserving the nation’s natural wealth and resources. The cost of these investments is often relatively modest but strong leadership and coordination is needed to ensure that institutions and incentives all work in the same direction. At COP30 in Belem, forest rich countries have a chance to lead, not just in emission reductions, but also in showing how forests can support climate goals and the economy.
Garcia Soto and Koelle (2025): “Deforestation in Peru: Key facts and main drivers”. OECD Economics Department Working Paper No. 1846, https://doi.org/10.1787/e7786877-en
New OECD long-run scenarios focus on the trade-off between carbon mitigation and climate damage
Category: Climate,Environment,Uncategorized
written by oecdecoscope | February 13, 2026
by Yvan Guillemette, OECD.
Last week the OECD released the latest update of its long-term scenarios, which are designed to quantify some of the most important long-term macroeconomic trends and policy challenges facing the global economy. One central challenge is the need to accelerate the transition toward renewable energy sources to reduce greenhouse gas emissions and attenuate the impacts of climate change. How this might impact future output trajectories is the focus of this update.
The analysis considers two “business-as-usual” scenarios in which decarbonisation of the energy mix and improvements in energy efficiency continue along recent trends. The first is based on a median climate damage curve and the second on a high climate damage curve within the wide range found in the scientific literature. In the scenario with a median climate damage curve (scenario BAU1), global annual potential output growth is projected to moderate gradually from around 2.9% today to 2.7% in the first part of the 2030s, 2.1% in the early 2040s and remain at around 1.3% in the second half of the century. This moderation reflects declining working-age population growth and slowing trend labour efficiency growth in the emerging-market economies as their productivity levels get gradually closer to the frontier. China remains the world’s largest economy until the mid-2060s when it is surpassed by India.
Global annual potential output per capita growth slows by less than overall output, but still declines from about 2% today to 1¼ per cent by 2050, remaining broadly stable thereafter.
Insufficiently rapid progress on reducing greenhouse gas emissions implies continued global warming. The global average surface temperature anomaly – the increase in the global average temperature since pre-industrial times – continues to increase throughout the projection period and reaches 2½ °C in 2100. The reduction in global output associated with climate change, estimated to be approximately 1¾ per cent of global GDP today, rises to nearly 9% by 2100. With a steeper climate damage curve, at the high end of recent estimates, projected climate damages reduce global output by 36% by 2100 (scenario BAU2).
An illustration of the potential impacts of an accelerated energy transition on future output must consider two main impact channels. The first is faster carbon mitigation. This is a negative supply shock in the short to medium run (relative to a business-as-usual scenario), with the size varying across countries according to their current energy mixes and ease of substitutability. The second is the avoidance of climate-related damages, a positive supply shock in the medium to long run (again, relative to a business-as-usual scenario) that is also country specific. To highlight the uncertainty surrounding these channels, four energy transition scenarios are considered with differing assumptions about the pace at which carbon mitigation costs might decline over time and the steepness of the global climate damage curve.
With a median climate damage curve and a slow decline in mitigation costs (scenario ET1), global output remains lower in 2100 than in the corresponding business-as-usual scenario.
With a median climate damage curve and a quick decline in mitigation costs (scenario ET2), the energy transition becomes a net positive for global output around 2085.
With a high-damage curve and a slow decline in mitigation costs (scenario ET3), the energy transition becomes a net positive for global output in the mid-2050s.
With a high-damage curve and a quick decline in mitigation costs (scenario ET4), the energy transition becomes a net positive for global output in the mid-2040s. All 139 countries modelled individually are net beneficiaries by 2080.
The new long-term scenarios also incorporate several key improvements to the underlying projection framework: 1) the geographical coverage is now global, including 139 countries modelled individually; 2) the projection horizon has been extended from 2060 to 2100; 3) the approach for long-run productivity convergence across countries has been revised; and 4) the framework now allows for the impact of climate damages on output via a global climate damage curve and country-specific climate sensitivities that can be altered to consider different assumptions and scenarios.
Selected series for the scenarios are available on the OECD Data Explorer and additional data visualizations are available on this web page.
Sweden is warming at nearly twice the global average pace. Coastal erosion, flooding, and extreme weather events are no longer future risks, they are affecting communities today. On the south coast of Skåne, more than 200 meters of shoreline have been lost to erosion in just four decades. With 82% of the population living in coastal areas, the stakes are high. Investments to adapt to climate change make good economic sense and can improve social equity. The 2025 OECD Economic Survey of Sweden highlights three strategic areas to strengthen Sweden’s climate resilience:
Accelerating market-based adaptation measures
Improving public funding mechanisms
Strengthening governance and coordination
Market tools can drive private investment in adaptation but are not used to their full potential in Sweden (Figure 1). Property owners are the main beneficiaries from safeguarding their own assets and should therefore at the outset foot the bill. Sweden’s legal framework therefore rightfully places the responsibility for climate adaptation largely on property owners, but in practice few financial incentives exist to drive meaningful action.
Insurance premiums typically do not reflect the actual risk of climate-related damages. For example, homes located in high-risk flood zones pay the same premiums as those in safer locations. Moreover, homeowners who take proactive steps, like building flood barriers or reinforcing foundations, rarely see their premiums lowered. This “risk-blind” pricing does not properly incentivise ex-ante adaptation strategies and investments in resilience.
A similar gap exists in property taxation. Municipalities in Sweden cannot adjust tax rates based on local climate risk, nor can they use tax tools to discourage new development in vulnerable coastal areas. The result is a system where those who benefit most from adaptation investments are not contributing proportionately to the cost of those investments.
To reverse this dynamic, Sweden needs to embed climate risks in the prices facing households and businesses to encourage risk-reducing actions. Insurance premiums should be better aligned with site-specific risks, such as flooding or erosion. International examples show that this works. In Denmark and the United Kingdom, for instance, insurers offer premium discounts for policyholders who for example install flood barriers or upgrade drainage. Such approaches have led to measurable increases in private adaptation investments and reduced long-term losses. Introducing similar arrangements in Sweden would not only encourage adaptation but also reduce future spending on disaster recovery (Figure 2).
In addition, Sweden should consider allowing municipalities to implement risk-based property taxation. This would ensure that households in high-risk areas contribute more to the cost of local adaptation projects, such as sea walls or improved stormwater infrastructure. It would also help resolve the “public goods dilemma,” where individuals benefit from shared resilience measures but lack incentives to pay for them. In coastal municipalities like Malmö and Vellinge, disagreements over who should finance protective infrastructure have already caused delays.
Another weakness in Sweden’s climate adaptation funding model is that the risk of large-scale weather-related losses is not properly reflected in insurance premiums. Households, businesses and the insurance industry expect that the government will bail them out in the event of major disasters. Explicit ex ante risk pooling is at the outset a superior solution to such ex post tax-financed bailouts. A prefunded pool, financed by a mandatory surcharge on all property insurance premiums, would act as a buffer in times of crisis and protect the insurance sector and taxpayers alike from unpredictable fiscal shocks. Insurers actively encouraging and facilitating risk mitigation efforts could be rewarded with more favourable terms when accessing the backstop to incentivise risk reduction and reduce the likelihood of high claims. France provides a proven example through its Natural Disaster Compensation Scheme (Caisse Centrale de Réassurance), which is funded by insurance premiums and ultimately guaranteed by the State.
Improving public funding mechanisms is also important. Variation in investment needs for climate adaptation between municipalities is largely orthogonal to their main funding sources, which are personal income taxes, the general grant from the government and the cost and income equalisation system. Municipalities can apply for national and EU grants, but these are mostly aimed at large-scale projects and entail a complex and resource-intensive process, disadvantaging smaller municipalities. Unlike mitigation, adaptation funding is not fully mainstreamed into Sweden’s budget process. Mainstreaming adaptation into national budgeting, alongside easily accessible grants conditional on specific performance targets or milestones, would provide more predictable support and help municipalities plan for the long term.
Governance is another area in need of reform. Sweden lacks a cohesive national action plan for climate adaptation, and responsibilities across sectors and administrative levels often overlap. Municipalities are not legally required to report on adaptation efforts, making it difficult to track progress and identify gaps. Strengthening the authority of County Administrative Boards, which are tasked with coordinating local adaptation efforts, and requiring regular and more standardised reporting would improve consistency across municipalities.
As the impact of climate change intensifies, adaptation can no longer be an afterthought. It must be embedded in financial systems, public policy, and institutional governance. The path forward depends on decisions today, ones that align market incentives and equitably allocate public resources. The resilience of future generations depends on it.
Accelerating climate adaptation: A framework for resilient economies
Category: Climate
written by oecdecoscope | February 13, 2026
By Mauro Pisu, Hélia Costa, Filippo Maria D’Arcangelo, Yannick Hemmerlé, Tobias Kruse and Luisa Lutz
The physical risks posed by global warming keeps rising. This is despite the progress of many countries in ramping up climate-change mitigation policies over the past decades. The risks threaten public finances, household incomes, investment and economic growth. As such, they call for urgent action in adopting effective climate change adaptation without relinquishing robust efforts to reduce greenhouse gas emissions. One of the main challenges is to steer private capital towards adaptation as its large financing needs far exceed the capacity of the public sector alone.
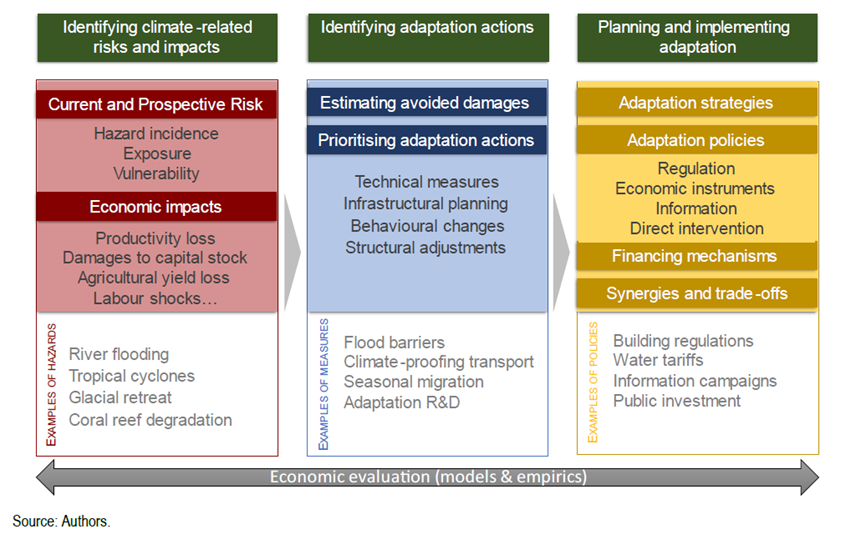
By building on recent and ongoing OECD work, this paper develops a multi-step framework to integrating adaptation into broader economic policy making. It consists of three key steps (Figure 1):
Identifying climate-related risks and impacts: This involves assessing the incidence of climate hazards as well as the exposure and vulnerability of populations and assets to these hazards. Assessing these components and their evolution over time allows for estimating the economic costs of climate change. Costs can affect public finances and private-sector incomes, and lead– through demand and supply channels – to lower growth and other adverse macroeconomic impacts.
Identifying adaptation actions: Adaptation actions aim at reducing exposure and vulnerability of populations and assets to climate risks, thus limiting the costs incurred when risks materialize. Mitigation efforts, however, remain vital to diminish the incidence of climate hazards. Adaptation actions fall into different categories: technical measures (like barriers or green roofs); infrastructure planning (including upgrading building standards or changing urban structure); behavioral or organizational changes (e.g. changing working hours to avoid peak temperature); and structural economic adjustments (e.g. systematic shifts in economic activity). They need to be prioritized based on estimates of economic benefits (i.e. avoided losses) while taking into account implementation costs.
Planning and implementing adaptation: This step involves identifying and implementing the most suitable policy tools to drive adaptation actions, securing adequate financing, as well as exploiting synergies between adaptation and mitigation efforts. National Adaptation Plans (NAPs) play a critical role in allocating responsibilities, monitoring and evaluating adaptation objectives, and ensuring that policies are tailored to country-specific risks and contexts (OECD 2023a).
Figure 1. A multi-step framework for adaptation
Policy instruments for driving adaptation
Policymakers have a range of policy tools at their disposal to promote and accelerate adaptation actions. The need for different tools and their effective combinations depend on the obstacles hindering private adaptation. These policy tools include:
Economic instruments: These rely on market incentives to encourage private sector’s consumption and investment choices to be aligned with adaptation objectives while allocating resource efficiently. This will lower the cost of adaptation. The instruments include tax breaks or subsidies for climate-resilient infrastructure and incentives to promote insurance mechanisms against climate-related risks, tax breaks or grants to developers and homeowners to encourage the adoption of stricter building practices and the construction of buildings that can withstand extreme weather events.
Regulations: These constrain the behaviour of individuals, businesses, and governments by mandating production and work practices that are aligned with adaptation objectives. Regulations can be effective when firms and individuals are unresponsive to price signals, and when economic instruments are politically difficult to implement or fail to overcome coordination failures. For instance, well designed building codes, zoning laws, and land-use regulations help reduce exposure to climate hazards. For example, in Portugal, land-use regulations forbid construction in areas with high wildfire risk. In some countries, the absence of regulations informed by wildfire risk assessments has contributed to large damages in recent years (OECD, 2023b).
Information provision: The provision of information on climate risks help to overcome information gaps, thus encouraging private adaptation actions, mobilising private finance and bolstering the contribution of the insurance sector to adaptation actions. Information provision thus complements and enhances the effectiveness of economic instruments. Early warning systems and climate risk assessments can enhance awareness to and preparedness for climate risks. For example, the Japanese Emergency Alert System (J-Alert) enables authorities to broadcast rapid warnings of heavy rainfall, storm surges, and tsunamis in affected areas (Japan Meteorogical Agency, 2024). Germany has implemented a “flood passport” that includes a risk assessment and recommendations for additional precautionary measures (OECD, 2024b).
Direct government provision: In some cases, direct government provision of public goods is necessary to protect communities from climate risks. For instance, in regions vulnerable to sea-level rise and storm surges, governments may be better placed to invest directly in coastal protection infrastructure – such as seawalls, dykes, and other coastal defenses – than the private sector. Examples include the Dutch Delta Works (a series of protective infrastructure against flooding in the Rhine-Meuse-Scheldt Delta), and the London Thames Barrier (which protects London from storm surges). The long pay-off time, large initial financing needs and the absence of clear revenue streams of this type of projects pose significant barriers to their implementation by the private sector, thus justifying direct government provision.
Financing Adaptation
Meeting adaptation needs requires large financial resources, particularly in developing countries (UNEP, 2023). Mobilizing private finance is essential, but market failures and information gaps hinder private investment. Governments can play a pivotal role by providing guarantees, equity stakes, and public-private partnerships to de-risk private investment (OECD, 2024c). Additionally, integrating adaptation into national budgets and fiscal planning can ensure that resources and responsibilities are allocated efficiently across national and local governments (OECD, 2023c).
Looking ahead
The OECD’s framework on adaptation provides a robust foundation for integrating climate adaptation into economic policy. By identifying climate risks, prioritizing adaptation actions, and leveraging a mix of policy instruments, countries can build resilience to climate change.
This work also points to existing gaps in terms of assessing the macroeconomic and fiscal costs of climate change, as well as the costs and benefits of adaptation actions and policies. Current work at the OECD focuses on advancing this knowledge, using a combination of econometric analysis and modelling approaches, contributing to bridge the gap between micro-level estimates – such as the firm-level impacts of heat stress and other weather related events– and macro-economic assessments.
The heat is on: Heat stress, productivity and adaptation among firms
Category: Climate,Uncategorized
written by oecdecoscope | February 13, 2026
By Hélia Costa, Guido Franco, Filiz Unsal, Sarath Mudigonda, Maria Paula Caldas.
The pace of temperature increase has been steadily accelerating over the past decades (IPCC, 2021). The increasing frequency and intensity of heat stress episodes due to climate change poses significant threats to the global economy, including through its effects on productivity. Despite recent more stringent mitigation efforts and the expectation that climate targets will be met, temperatures are still projected to rise, raising concerns about the economic costs associated with climate change.
One key channel through which temperature affects economic outcomes is labour productivity. As temperatures increase, both the cognitive and physical capacity of workers decrease, and extreme temperatures can also increase absenteeism due to heightened health issues and transport disturbances. Beyond its direct effect, heat stress can further impact productivity through disruptions to infrastructure (such as energy), increased production costs, or disruptions to supply.
Against this backdrop, our new paper (Costa et al., 2024) presents novel cross-country firm-level evidence on the effect of heat stress – both slow onset events (gradual temperature increases) and extreme weather events (heatwaves) – on labour productivity. The analysis builds on a unique dataset gathering detailed weather and financial information for more than 2.7 million manufacturing and services firms across 23 advanced economies between 2000 and 2021, complemented with country-level information on adaptation investment. The newly constructed dataset reveals that the number of warm days and the incidence of heatwaves present an increasing pattern in the period of analysis in most locations (Figure 1).
Figure 1. The number of warm days increased in most locations in the sample period
Note: The maps show the change in the average number of days in the year where the daily maximum temperature rose above 30°C, in the last five years of the analysis period (2016-2021) relative to the first five years (2000-2004). Source: Costa et al. (2024) based on data from Orbis and ERA-5 reanalysis data (Copernicus Climate Change Service).
How do extreme temperatures affect firm productivity?
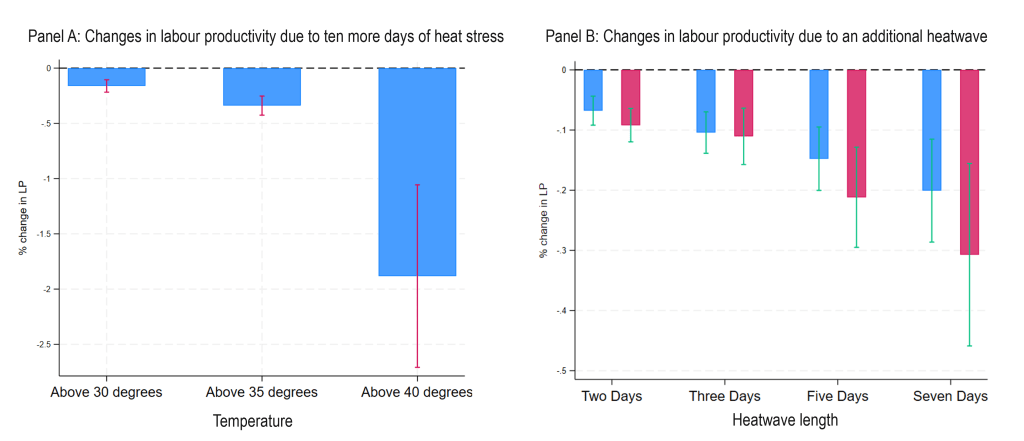
We find that both more frequent high-temperature days and the occurrence of heatwaves lead to substantially reduced labour productivity (Figure 2). Ten extra days above a temperature of 35 degrees Celsius in a year result in a 0.3% reduction in firms’ annual labour productivity. This effect is comparable, for example, to the decrease in productivity following a 5% rise in energy prices (André et al., 2023). One additional heat wave lasting at least five days, in turn, causes a 0.2% reduction in firms’ annual labour productivity.
Figure 2. Higher temperature negatively affects productivity
Note: Bars represent estimated coefficients and vertical lines the respective confidence intervals. Each bar is a different estimation. In Panel A each estimation differs with respect to the definition of the temperature variable, which is either the number of days above 30ºC, or above 35ºC or above 40ºC. In Panel B, each estimation differs with respect to the definition of heat wave, varying both the temperature threshold above which temperature has to rise for a heat wave to have occurred (90th and 95th percentile of the local historic mean) and the minimum number of consecutive days this temperature needs to have occurred. Source: Costa et al. (2024)
This effect is more pronounced in less productive and smaller firms, and exacerbated by longer heat waves, high humidity, and low wind speeds. We also find that the negative productivity impacts exhibit a non-linear relationship with rising temperatures and persist for two years before fading. The heterogeneity of the impact across firms suggests differences in not only exposure but also vulnerability to heat stress. Larger firms, for instance, may have greater resilience to rising temperatures thanks to better financial resources, access to advanced technology, and knowledge of behavioural adaptation practices.
The analysis suggests some degree of adaptation may have already taken place. Firms in warmer locations and those more used to experiencing heatwaves exhibit lower productivity losses under similar temperature extremes. Additionally, both the implementation of National Adaptation Plans and firm-level investment in adaptation are also linked to reduced adverse effects of heat stress on productivity. However, the extent of current adaptation remains limited: higher temperatures relative to an already warm average result in more significant productivity losses, and there is no evidence of adaptation to severe extreme temperatures.
Directions for policy
In highlighting the substantial economic impacts of temperature-related changes, our analysis underscores important productivity and growth challenges posed by both gradual and disaster-driven climate impacts, providing valuable insights for policy making. First, sustained efforts in climate change mitigation are key to attenuating the increase in temperatures and the intensity and frequency of heat waves. This is particularly important given the non-linearity of costs to extreme temperatures and the limits to the effectiveness of adaptation suggested by our analysis.
Second, our results stress the urgent need to limit the economic impacts of heat stress through enhanced adaptation measures, tailored to different national and regional contexts to account for relevant heterogeneities in impacts and capacity. Where barriers to effective private sector engagement exist, like information and knowledge gaps, financial constraints, or coordination failures, policy efforts could prioritise promoting private sector adaptation. For example, while more than 60% of firms in the European Union report being impacted by the physical risks of climate change, only slightly over one-third have taken concrete steps to build resilience (EIB, 2023).
Policymakers can support firms, particularly small and medium-sized enterprises, through targeted economic incentives such as subsidies or tax breaks to encourage investments in heat-resilient infrastructure and technical measures, like green roofs or advanced cooling systems. Additionally, providing information to firms can drive behavioural changes, such as adjusting work schedules to avoid peak heat periods. Complementary direct public investment may be necessary, for example in changing urban structure, climate-proofing transport systems, or investing in adaptation technology R&D.
Lastly, heat stress is just one of many climate-related challenges confronting economies. Other slow onset and extreme weather events can pose significant risks for firm-level performance and broader macroeconomic outcomes. Our upcoming research dives into these risks from two angles: we explore how flooding impacts firm performance – focusing on output, capital, and investment – and how regional macroeconomic results are impacted by extreme weather events. Together, these efforts aim to provide a more comprehensive understanding of the economic risks posed by climate change and inform the development of robust macroeconomic structural models.
Costa, H. et al. (2024), “The heat is on: Heat stress, productivity and adaptation among firms”, OECD Economics Department Working Papers, No. 1828, OECD Publishing, Paris, https://doi.org/10.1787/19d94638-en.
IPCC, 2021. Climate Change 2021: The Physical Science Basis, Contribution of Working Group I to the Sixth Assessment Report of the Intergovernmental Panel on Climate Change, https://www.ipcc.ch/report/ar6/wg1.
A heated issue: The unequal impacts of climate change and climate change mitigation
Category: Climate,Environment,Uncategorized
written by oecdecoscope | February 13, 2026
by Jule Hodok.
The direct impacts of climate change are unevenly distributed across countries, regions, and socioeconomic groups. Inaction will not only result in significant macroeconomic costs but also deepen existing inequalities (Intergovernmental Panel on Climate Change (IPCC), 2023). However, climate mitigation policies designed to reduce the emission of greenhouse gases (GHGs) also have distributional effects. A new report by the OECD Economics department reviews the distributional consequences of climate change and climate change mitigation as well as illustrates the trade-offs between equity, efficiency, and effectiveness in the design of climate policies.
Unequal impacts of climate change
The extent to which a specific group of people, regions and countries are affected by climate change is determined by their exposure and vulnerability:
“Exposure” is the presence of people, livelihoods, species, or ecosystems in places and settings that could be adversely affected by environmental degradation.
“Vulnerability” is the tendency to suffer from the adverse effects and/or the lack of capacity to cope or adapt after exposure to climate change (Intergovernmental Panel on Climate Change (IPCC), 2023).
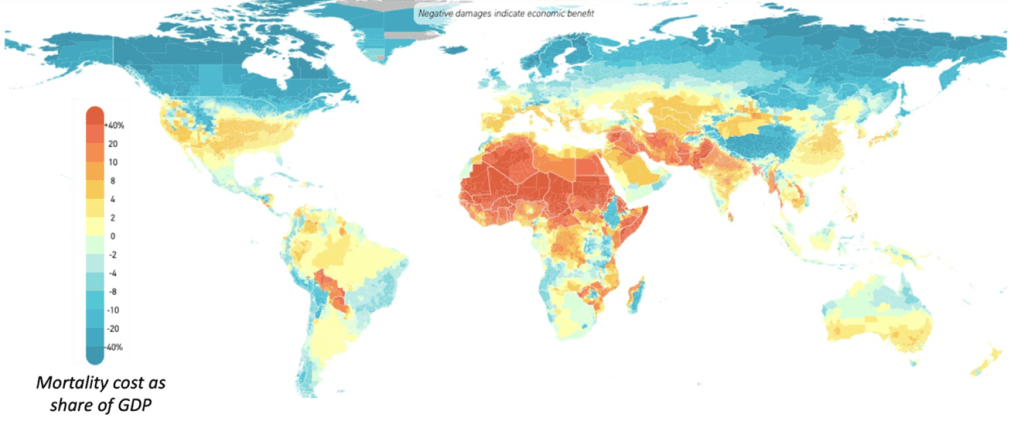
Developing countries are on average more exposed to climate change due to a combination of factors, such as often higher baseline temperatures, higher likelihood of droughts, and the reliance on climate-sensitive sectors, such as agriculture which is highly affected by temperature and precipitation levels (IPCC, 2023). They are also more vulnerable due to lower levels of adaptive capacity and resilience (Bilal & Känzig, 2024; Frankhauser, 2017) (Figure 1).
Figure 1. Predicted mortality cost as a share of GDP under a high emissions scenario
Notes: Estimates are based on a high emission scenario (RCP 8.5) for the end of the century (2080-2099). The methodology for estimating the mortality costs of climate change (temperature-related) derived from (Carleton, et al., 2022). Mortality costs are just one part of health-related impacts of climate change and account for an even smaller share of the overall costs of climate change. Source: (Climate impact Lab, 2024)
Within countries, drawing clear, general conclusions of the impact of climate change is more difficult. Still, for example, urban areas often face higher risks of extreme temperatures and flooding (Frankhauser & McDermott, 2016), while rural communities tend to be more vulnerable due to a stronger reliance on resource-based industries (OECD, 2021). Evidence also suggests that lower-income households tend to be disproportionately affected, as they often lack the resources to adapt to climate change, e.g. by not being able to afford adaptive technologies, or lower access to quality healthcare and insurance (Bijnens, et al., 2024; Islam & Winkel, 2017).
The distributional impacts of climate change mitigation
While mitigating climate change can, over the longer term, help alleviate some of the distributional concerns related to the direct impacts of climate change, climate policies themselves have distributional consequences, from both an income and consumption perspective.
From an employment and income perspective, the climate transition will trigger a reallocation of labour and capital, from “high-emission” sectors, firms, and activities to low carbon emitters. For example, research estimates that in response to a global tax of USD 50/tCO2, fossil fuel industries – which tend not to be large employers overall – would experience a decrease in employment and output, while the largest job gains would occur in low-carbon power generation (Chateau, Bibas & Lanzi, 2018) (see Figure 2 for an overview of sector-specific effects). However, as high-emission industries tend to be regionally clustered, such labour market effects are likely geographically concentrated, potentially widening regional inequalities within countries (OECD, 2021; OECD, 2023). Additionally, low-skilled workers and those with lower educational attainment are often most negatively affected as they tend to face higher barriers to reskilling and job mobility (OECD, 2023; Chateau, Bibas, & Lanzi, 2018).
Figure 2. Change in output, employment, and gross wage by sector in response to central scenario
Notes: a carbon tax of USD 50/tCO2 is applied in all regions of the world; percentage change w.r.t reference equilibrium, 2011; OECD ENV-Linkages computable general equilibrium (CGE) is used as a tool for the analysis. Source: (Chateau, Bibas, & Lanzi, 2018)
From a consumption perspective, policies that result in changes in relative prices will affect households differently if they have different consumption patterns. Four key findings emerge based on the review of existing literature:
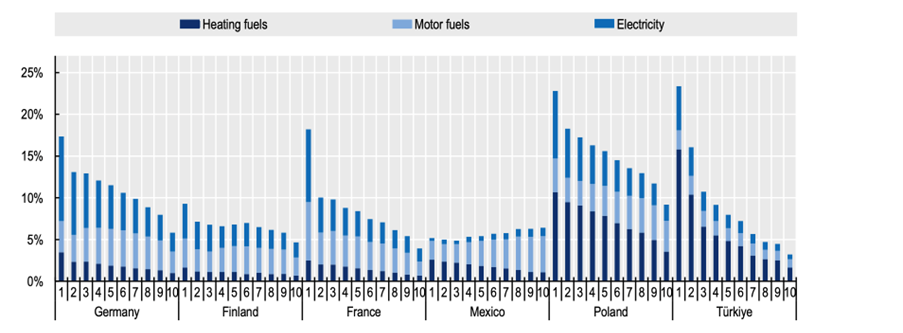
In advanced economies, carbon and energy taxation is mostly regressive (Flues & Thomas, 2015; Douenne, 2020; Immervoll et al., 2023). The regressivity often stems from the fact that food and some fuels are a necessity for many households making poorer households unable to reduce their consumption in response to higher prices (Figure 3) (Vandyck et al., 2023; Elgouacem, et al., 2024).
In developing countries, carbon and energy taxation often are progressive. This stems from the fact that a large subset of the population has low incomes and relatively limited fossil fuel energy use. Developing countries are therefore particularly confronted with the trade-off between energy affordability and addressing climate change as even a small increase in the price of energy may significantly aggravate energy poverty (Dorband et al., 2019; Steckel, et al., 2021).
The regressivity of policies depends on the specific policy in question and the type of fuel that is targeted. For example, transport fuel taxation is neutral in countries with higher GDP per capita and progressive in countries with lower GDP per capita (Flues & Thomas, 2015; Missbach et al., 2024). Additionally, other factors than income drive distributional effects. For example, most evidence shows that rural households are more vulnerable to carbon taxation, due to limited access to public transport (Causa et al., 2022).
Non-market-based policies – including bans, standards, and direct regulation – tend to disproportionately affect lower-income households and may result in equity concerns through possibly unaffordable replacement costs of the emission-intensive good (Elgouacem, et al., 2024). Limited research on subsidies and feed-in-tariffs (e.g. for electric vehicles, solar panels, or home insulation) suggests that they tend to primarily benefit higher-income households who have the required capital to invest in the low-carbon solution (Borenstein & Davis, 2016; Levinson, 2019).
Figure 3. Household expenditures on fuel and other energy, by income decile
Note: Groups 1-10 refer to income deciles. Domestic fuel includes expenditure on gas, liquified hydrocarbons, kerosene, and other liquid fuels, coal, and other solid fuels. Motor fuels includes expenditure on diesel and petrol for transportation. Source: (Elgouacem, et al., 2024), (Screenshot, Figure 5.5 in paper)
Overall, integrating equity and fairness considerations in the design of climate policies and broader climate strategies can help manage their distributional impacts and improve the social acceptability of a climate transition.
References
Bijnens, G., Anyfantaki, S., Colciago, A., De Mulder, J., Falck, E., Labhard, V., . . . Strobel, J. (2024). The Impact of Climate Change and Policies on Productivity. SSRN Electronic Journal. https://papers.ssrn.com/sol3/papers.cfm?abstract_id=4741442
Bilal, A., & Känzig, D. (2024). The Macroeconomic Impact of Climate Change: Global vs. Local Temperature. National Bureau of Economic Research, Cambridge, MA. doi:10.3386/w32450 https://www.nber.org/papers/w32450
Dorband, I., Jakob, M., Kalkuhl, M., & Steckel, J. (2019). Poverty and distributional effects of carbon pricing in low- and middle-income countries – A global comparative analysis. World Development, 115, 246-257. doi:10.1016/j.worlddev.2018.11.015 https://www.sciencedirect.com/science/article/pii/S0305750X18304212
Levinson, A. (2019). Energy Efficiency Standards Are More Regressive Than Energy Taxes: Theory and Evidence. Journal of the Association of Evironmental and Resource Economists, 6(S1), S7-S36. doi:10.1086/701186. https://www.journals.uchicago.edu/doi/full/10.1086/701186
Steckel, J., Dorband, I., Montrone, L., Ward, H., Missbach, L., Hafner, F., . . . Renner, S. (2021). Distributional impacts of carbon pricing in developing Asia. Nature Sustainability, 4(11), 1005- 1014. doi:10.1038/s41893-021-00758-8 https://www.nature.com/articles/s41893-021-00758-8
Vandyck, T., Della Valle, N., Temursho, U., & Weitzel, M. (2023). EU climate action through an energy poverty lens. Scientific Reports, 13(1). doi:10.1038/s41598-023-32705-2 https://www.nature.com/articles/s41598-023-32705-2
Does carbon leakage through international trade reduce the effectiveness of carbon pricing policies?
Category: Climate,Uncategorized
written by oecdecoscope | February 13, 2026
By Jonas Teusch, Filippo Maria D’Arcangelo, Tobias Kruse, and Mauro Pisu
Carbon leakage, whereby foreign emissions increase because of domestic climate policies, blunts the effects of domestic climate policies on global emissions. Traditionally, the empirical literature has not found much evidence of carbon leakage (e.g. Venmans et al, 2020). However, carbon prices were historically low and most existing evidence is limited to the EU’s emissions trading system where free allowances may have protected the international competitiveness of EU producers in emissions-intensive trade-exposed sectors.
In our recent paper (Teusch et al, 2024), we leverage satellite data from Climate TRACE to track emissions and carbon prices for cement and steel at the plant level across 140 countries. These two sectors alone account for more than 40% of industrial greenhouse gas emissions. We then use plant-level data to estimate the effect of carbon prices on emissions. Finally, we combine these data with international product-level trade data to quantify the effect of carbon prices on emissions embodied in the international trade of steel and cement products and obtain an estimate of carbon leakage in these sectors.
The recent rise in carbon prices was uneven across countries
Carbon prices have become more common over the past years and increased noticeably (OECD, 2023; World Bank, 2024). While most of the plants covered by this study are still not subject to carbon prices, carbon pricing systems now exist around the world (Figure 1). The average plant-level carbon price across all cement and steel plants in the dataset rose by a factor of seven (from USD 1.4 per tonne of CO2e in January 2015 to USD 10.9 in December 2021). As carbon prices started from a low base, they remain low on average.
Figure 1. Carbon pricing systems now exist around the world
Note: The map depicts the carbon pricing landscape in 2021. It shows all steel, cement and aluminium plants covered by the Climate TRACE dataset. Source: Teusch et al, 2024.
The rise in carbon prices was uneven across countries, resulting in rising carbon price asymmetries. Carbon price asymmetries, computed as the average difference between the domestic carbon price and the carbon prices of trading partners (weighted by traded volumes), surged by more than 350% between 2015 and 2021, highlighting the heterogeneity of carbon price developments across countries and rising carbon leakage risk.
Carbon pricing can reduce emissions in steel and cement
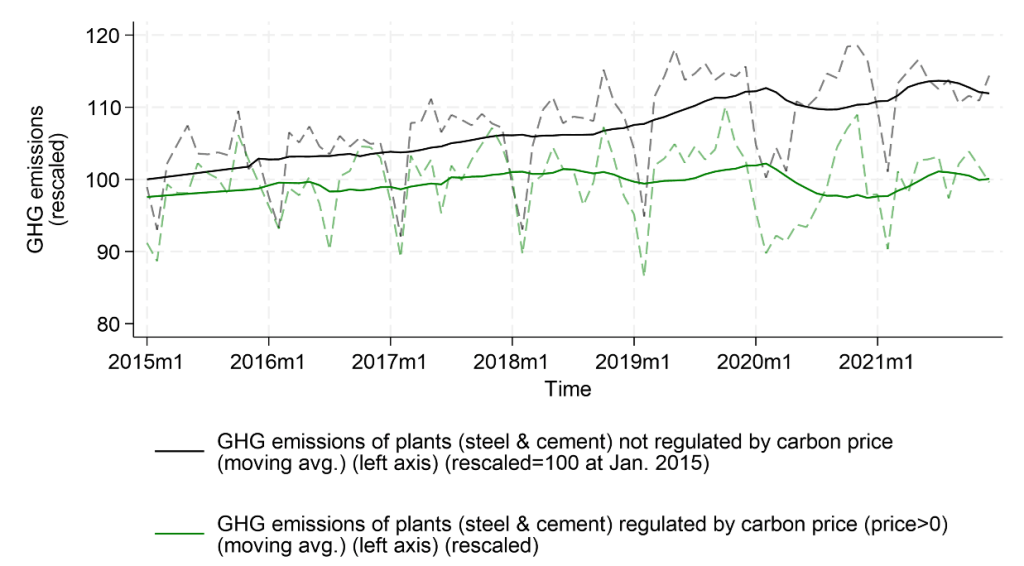
Despite their reputation as “hard-to-abate” sectors, cement and steel plants respond to rising carbon prices by reducing emissions. Emissions from plants subject to carbon prices were stable between 2015 and 2022 whereas they rose for plants not covered by carbon prices (Figure 2). Empirical results based on panel regressions (controlling for confounding factors) suggest that, on average, cement and steel plants have reduced emissions by 1.3% in response to a USD 1 per tonne of CO2 increase in carbon prices.
Figure 2: Emissions from plants facing no carbon prices increased whereas they remained stable for plants facing carbon prices
Note: The black solid line shows the 12-month moving average GHG emissions of plants (in steel and cement sectors) never regulated by carbon pricing rescaled to equal 100 in January 2015. The dashed grey line shows the average monthly GHG emissions of those plants. The green solid line shows the rescaled 12-month moving average GHG emissions of plants (in steel and cement sectors) regulated throughout the sample (i.e. that are always regulated by carbon pricing). The dashed green line shows the average monthly GHG emissions of those plants. The graph excludes plants that switch treatment status in the sample period. Source: Teusch et al, 2024.
Carbon leakage through international trade offsets a moderate share of domestic emission reductions
On average carbon leakage through international trade offsets 13% of domestic emission reductions. Leakage, which we estimate using a gravity model of international trade, is driven by volume effects (increased imports); there is no evidence that countries import more from dirtier countries. One possible explanation for the relatively moderate leakage effect is that these sectors receive free allocation and other forms of government support (Garsous, Smith and Bourny, 2023), which reduces the carbon leakage risk. Another complementary explanation is that carbon price asymmetries across countries are not yet large enough to affect international trade flows in a more significant manner.
Carbon pricing may lead to additional spillovers
Carbon pricing asymmetries can lead to international spillovers in addition to carbon leakage through international trade. For example, carbon pricing can lead to downstream leakage, e.g. when carbon pricing on steel production impacts downstream manufacturing activities and locational choices. Carbon pricing can also induce positive spillover effects, for example via the diffusion of cleaner production techniques (including from regulated to unregulated facilities). Considering the importance of technology diffusion for reducing global emissions, innovation-related spillovers would merit further work.
Estimating and quantifying these spillovers is crucial to better understanding the impact of carbon prices asymmetries and mitigation policies on global emissions. Timely and granular sources of data covering emissions and output at product level are key elements to progress in this area and inform policies.
Venmans, F., J. Ellis and D. Nachtigall (2020), “Carbon pricing and competitiveness: are they at odds?”, Climate Policy, Vol. 20/9, pp. 1070-1091, https://doi.org/10.1080/14693062.2020.1805291
Making the grass greener: the role of firms’ financial and managerial capacity in paving the way to the green transition
Category: Climate,Green growth,Uncategorized
written by oecdecoscope | February 13, 2026
By Hélia Costa, Lilas Demmou, Guido Franco, Stefan Lamp
The ambitious targets set by many OECD countries to become carbon neutral by 2050 require substantial investment. The European Commission estimates that relevant investment will need to be raised from an average of €683 billion per year to around €1,040 billion per year until 2030 (Lenaerts et al., 2021). According to the International Energy Agency, global energy investment will need to almost double to 4.5% of global GDP by 2030 and remain at this level until 2050. Furthermore, this investment will have to be shouldered mainly by the private sector, responding to market signals and policies set by governments (IEA, 2021).
Green investment efforts to date however fall well short of the zero-emission scenario (ECB, 2023). Various factors may contribute to this. Particularly, financing investment in such technologies may be more difficult to obtain compared to other, more established, technologies, due to specific characteristics like high fixed costs and risk, or information asymmetries (De Haas and Popov, 2023). Investments in newer and riskier green technologies may also be deferred due to a lack of knowledge among firms regarding this specific type of investment and how to manage it effectively (De Haas et al., 2022).
Against this backdrop, our new paper (Costa et al., 2024) delves into the factors holding back corporate green investment. The study places specific emphasis on the role of firm capacity, examining both financing constraints and weak green management practices, and their interaction with environmental policies. Our cross-country analysis focuses on the response to a survey of over 6.500 large, listed companies, which are more strictly regulated, across 33 countries between 2004 and 2020. This is complemented by a case study analysis based on disaggregated and comprehensive data available for Portuguese firms between 2010 and 2020. Our research aims to contribute valuable insights to boost green investments toward meeting the ambitious targets set for 2050.
What determines corporate green investment?
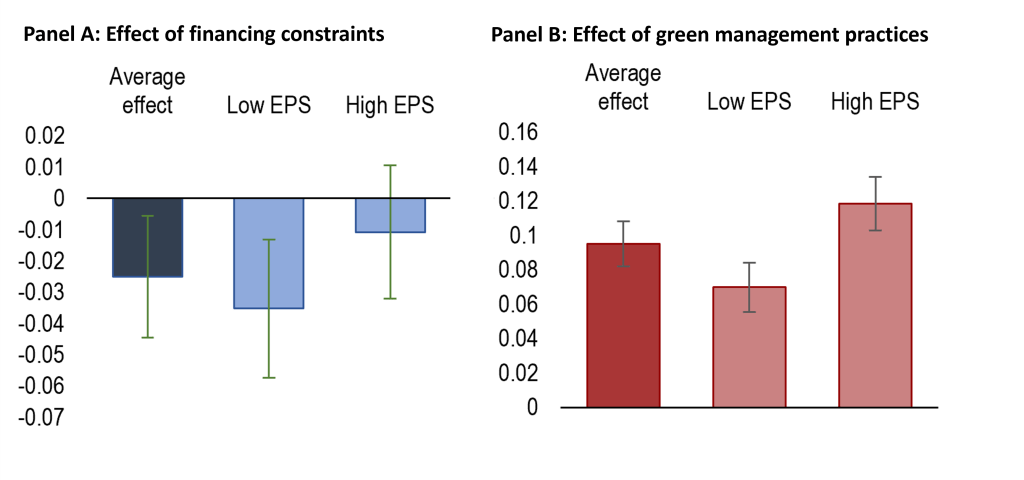
Our cross-country analysis shows that in OECD countries both financing constraints and a lack of green managerial capacity reduce firms’ probability of investing in green technologies, leading to higher emission intensity. Specifically, becoming financially constrained increases a firm’s probability to invest by 2.5 percentage points, around 8% of the average probability (Figure 1, Panel A, first column). In turn, introducing a green management practice, for example by creating a team with green functions, is associated with an increase in the probability to invest (Figure 1, Panel B, first column).
While it is known from previous research that all investment tends to respond negatively to financing constraints (Kalemli-Özcan et al., 2022), our case study shows that green investment is more elastic to financing conditions than other types of investment. Within green investment, we find that investment in integrated technologies is more sensitive to financing conditions than end-of-pipe solutions, possibly because it is performed less often and primarily to comply with regulation and its costs are less easily measured.
How does firms’ capacity interact with policy?
The impacts estimated are toned down in the presence of well-designed environmental policies. Specifically, stringent market-based environmental policies countervail the negative effects of financing barriers on green investment. This is possibly because such policies may incentivise firms to prioritise green investments which would otherwise not be undertaken due to financing constraints. In addition, the positive effect of green management practices is larger the more stringent non-market environmental policies are (Figure 1 Panel A) and the more generous public support is (Figure 1 Panel B). This indicates that green management capacity may help firms to deal with the complexity of non-market-based regulations and government support.
Figure 1: Firm capacity and environmental policy jointly affect green investment
Note: The bars represent the estimated coefficients and the green whiskers the 90% confidence intervals. Panel A: Financial constraints are firms within the highest quartile of the SAFE indicator at NACE2 rev.2 – year; Panel B: The indicator of green management practices is equal to 0-1-2 for firms adopting respectively 0, 1 or 2 green management practices (having a dedicated green team or providing green training to staff). Source: OECD calculations based on Refinitiv ESG data matched to Orbis 2004-2020.
These results offer valuable insights for policy makers wishing to progress towards their decarbonization goal by promoting private investment. Our paper discusses a menu of policy options that may foster the green transition by upgrading firms’ capacity. These include actions to ease financing constraints both at the banking and equity market levels, and actions to improve monitoring tools such as ESG standards which help investors assess firms’ greenness and exposure to transition risks, as well as actions to improve environmental management, and complementary signals through strong and predictable climate policy.
De Haas, R., Martin, R., Muûls, M., and H. Schweiger (2022), “Managerial and Financial Barriers during the Green Transition”, CentER Discussion Paper Nr. 2021-008
De Haas, R. and A. Popov (2023), “Finance and Green Growth”, Economic Journal, Vol. 133/150, pp. 637-668
ECB (2023), “Closing gaps to bend the trend: embedding the flow of finance in the transition”, Speech by Frank Elderson, State of the Union conference organised by the European University Institute, May 2023
IEA (2021), “Net Zero by 2050 – A Roadmap for the Global Energy Sector”, October 2021
Kalemli-Özcan, Ş., Laeven, L., & Moreno, D. (2022), “Debt overhang, rollover risk, and corporate investment: Evidence from the European crisis”, Journal of the European Economic Association, 20(6), 2353-2395
Lenaerts, K., Tagliapietra, S., and G.B. Wolff (2021), “How much investment do we need to reach net zero?”, Bruegel Blog, 25 August
Charting a course for Australia’s future: navigating the seas of ageing, climate transition and gender equality
Category: Australia,Climate,Gender
written by oecdecoscope | February 13, 2026
Alvaro Leandro and Ben Westmore, OECD Economics Department
The Australian economy rebounded robustly in the wake of the pandemic. However, supply constraints coupled with rising global energy prices sent inflation to its highest level since the early 1990’s, prompting a significant tightening of monetary policy. Subdued economic growth is projected over the coming years, as higher interest rates and cost of living pressures dampen spending.
In the medium term, external forces loom large over the economic outlook. As an economy that benefits significantly from foreign commodity demand, rising geopolitical tensions and global fragmentation are a risk to national income. The global climate transition will impact the economy, both through the influence on demand for Australian fossil fuel exports and the reshaping of domestic industry in line with net zero commitments. At the same time, the ageing demographics will lower the share of the working age population and lead to structural changes throughout the economy.
Addressing fiscal challenges
In anticipation of the challenges ahead, fiscal buffers need to be rebuilt. Australia’s public debt ratio remains in the lower half among OECD countries, but it has risen substantially for both the federal and several state governments over the past decade. The demographic and climate transitions will create further spending pressures and require improved mechanisms for fiscal dialogue across levels of government.
Spending and tax reforms can help address rising fiscal costs. Encouraging more patient care in primary care settings and greater emphasis on preventive health policies would reduce public spending growth as the population ages. Revenues could be raised through reducing exemptions in the goods and services tax base and further limiting tax concessions on private pensions.
Facilitating labour force and business sector adaptation
Amid ongoing structural change, policies need to promote an adaptable labour force and business sector. A concerning trend has been the slowdown in GDP per capita growth in Australia: whereas Australia used to outperform OECD counterparts, GDP per capita growth has been comparatively weak through the past decade (Figure below).
Trend GDP per capita growth has slowed
GDP per capita growth, average rate
Source: OECD Growth in GDP per capita, productivity and ULC Dataset.
Immigration will be key for supporting labour supply, but the composition of the skilled migrant intake needs to be more responsive to changes in the skill needs of industry. In parallel, school reforms could improve the foundational skill base. Straightforward measures such as providing all teachers with access to high-quality curriculum resources would allow them to focus on activities where they add most value, helping address declining standardised test scores of Australian students.
As the economy adjusts, greater flexibility in land zoning systems would improve the ability of new businesses to enter new markets and grow in desirable locations. Competition policies can also support healthy competitive dynamics in the business sector, despite Australia’s geographic distance from foreign markets. The authorities have commenced a broad competition policy review, which should consider more closely aligning the merger regime with other OECD countries.
Improving gender equality
Achieving further improvements in gender equality is also a key priority. In addition to being a fundamental human right, improving gender equality would support fuller participation of women in the labour force as the population ages. A significant gender gap in labour income remains, despite recent progress (Figure below). This results from differences in employment rates between men and women (employment gap), the intensity of work (hours gap) and the amount workers are paid per hour (hourly wage gap).
The gender gaps in income persist
Note: The gender gap is defined as the labour income of men-women. Source: The Household, Income and Labour Dynamics in Australia Survey, OECD calculations.
A key factor is high marginal effective tax rates when increasing work hours for low earners, due to the loss of benefits as earned income rises. This is especially the case for single parents, who are disproportionately women, and should be remedied by reducing the speed of benefit withdrawal as earnings increase.
Additional improvements to parental leave and childcare arrangements would support mothers staying in work and labour market re-entry after childbirth. Parental leave duration and the rate at which it is paid is low by OECD standards, while out-of-pocket childcare costs are relatively high, especially for low-income households.
Achieving the climate transition
The authorities are committed to achieving net zero emissions by 2050, a significant challenge given a historical reliance on coal generation and the presence of large mining and agriculture sectors (Figure 3). This will require a rapid transformation of the electricity grid and significant emission reductions in highly-polluting sectors such as industry and transport.
Large emissions reductions are needed
Source: Department of Climate Change, Energy, the Environment and Water.
Given the energy sector’s central role in the climate transition, the government should stand ready to provide further policy support and accelerate the planning and implementation of renewable energy projects to ensure that the renewable energy target of 82% by 2030 is met.
In the industrial sector, welcome reforms to the Safeguard Mechanism, which sets limits on the emissions of industrial facilities, have the potential to deliver significant emission reductions. Regular reviews of the mechanism are planned and should consider design changes if emission reduction targets are not met, such as switching from baselines based on emissions intensity to limits on total emissions.
Based on current policies, transport is projected to become the largest source of emissions in Australia by 2035. Introducing stringent fuel economy standards would help curb emissions in the sector, and these should be progressively tightened to zero emissions by 2035. Existing fuel tax exemptions for heavy and off-road vehicles should also be reconsidered.
Climate adaptation also needs to be a focus given Australia’s high exposure to climate-related hazards such as wildfires, extreme heat, and heavy rainfall. Adapting to climate change will require substantial investment and careful planning. Mandatory disclosure of climate-related risks in certain cases such as the sale of property can help raise awareness and encourage more effective adaptation. In addition, incorporating climate hazard considerations in land-use planning will help reduce risks by limiting development in more hazard-prone areas and mandating specific risk-prevention measuresfor new and existing constructions.
References
OECD Economic Surveys: Australia 2023, OECD Publishing