1

A sharp slowdown in China’s property markets would damp global growth

By Nigel Pain and Elena Rusticelli, OECD Economics Department

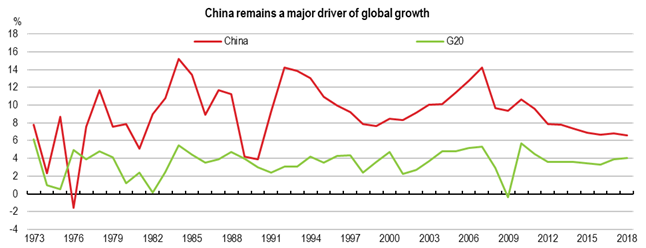
Developments in China have a considerable impact on the global outlook, with China accounting for over one-quarter of projected global GDP growth in 2021-23, and around 12.5% of world trade in goods and services. Among the factors that could significantly pull growth down in China, vulnerabilities in the property sector loom large.

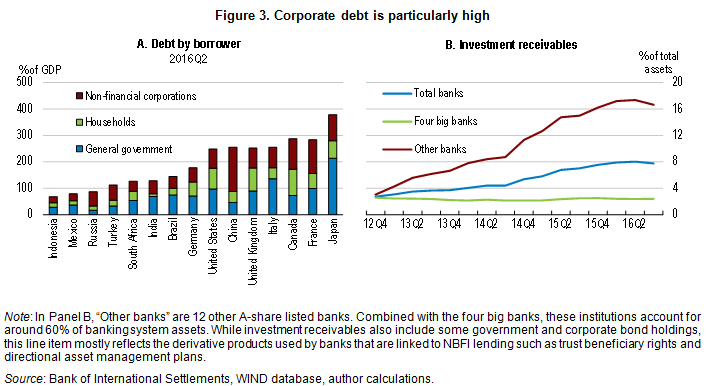
The property sector has been a strong source of growth for the Chinese economy for many years, but this has been accompanied by rising leverage of developers and, more recently, households. Concerns about banks’ property lending and the balance sheets of property developers have been apparent for some time, with regulatory curbs introduced in the last two years. Despite this, significant risks remain in China’s real estate market, with the potential for large cross-sector and cross-border spillovers. The severe liquidity issues faced by some large Chinese real estate developers pose direct risks for financial intermediaries, including foreign ones. These would be amplified if the crisis in the sector were to lead to defaults, as currently appears possible, and a substantial decline in property prices.

Any major default would be managed carefully by the government, but minimising the potential systemic risks to financial stability will nonetheless be challenging given the scale of the debts owed by many developers and the weak state of the property market. Sales and new construction starts are already declining, the unsold stock of housing is increasing, and yields on risky corporate bonds have risen sharply. These developments are incorporated in the baseline projections in the latest OECD Economic Outlook, and are one factor contributing to the projected easing of GDP growth in China from 8.1% in 2021 to around 5% in 2022.

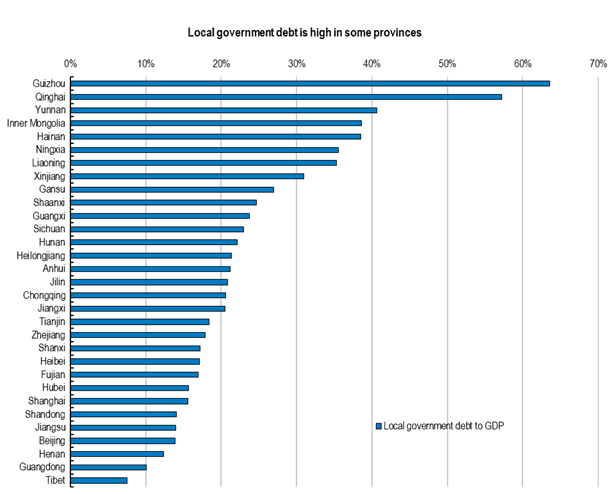
A disorderly default of one or more major property developers, or unexpectedly widespread debt restructuring, would pose significant additional risks to global growth prospects. The construction sector and real estate services each represented between 7-7½ per cent of total value-added output in 2020, with additional linkages stretching into many other parts of the economy. Not all of these activities reflected new real estate development, as construction also includes non-housing activities and real estate services include the management of existing occupied properties. A severe slowdown would, however, significantly impact other parts of the economy, particularly sectors providing materials for construction activity. Final demand would be hit directly, with real estate development representing around 25-30% of total fixed asset investment in 2019 and 2020. Regional and local governments could also face budgetary pressures if the revenue from sales of land rights were to decline substantially, potentially reducing spending on infrastructure investment. Greater uncertainty, tighter financial conditions and lower property prices could also damp domestic demand and production.

Illustrative simulations, using the NiGEM global macroeconomic model, highlight the adverse global effects that a sharper slowdown in China might have:

  • An unanticipated decline of 2 percentage points per annum in the growth rate of domestic demand in China for two years, and the associated decline in import demand, could directly lower global GDP growth by over 0.4 percentage points per annum, and global inflation by 0.2 percentage points per annum. The impact on output in Japan, commodity-producing economies and other economies in East Asia would be relatively high (Figure 1), reflecting their strong trade links with China. Lower global commodity prices contribute to the decline in inflation, reflecting the scale of Chinese demand in many commodity markets, with energy prices down by around 5% and metals prices by around 10%.
  • If the property sector slowdown in China were to disrupt the domestic production of key intermediate or final products needed in other countries, such as steel or consumer appliances, there could be an adverse global supply shock. In this event, with a supply shock proxied by a 10% rise in Chinese export prices (broadly in line with the estimated change over the year to 2021Q3), the adverse effects on the world economy would intensify, with global GDP growth lowered by close to 0.7 percentage points per annum. Higher export prices from China would directly push up global inflation by around 0.4 percentage points per annum, illustrating the impact of supply bottlenecks, and inflation in the advanced economies by around ¼ percentage point per annum.
  • If accompanied by tighter global financial conditions due to risk repricing, the impact of the slowdown in China would be greater still. In a scenario with a 10% decline in global equity prices and higher investment risk premia, global GDP growth could be lowered by 1 percentage point per annum on average in the first two years of the shock. The additional shocks would also be deflationary, with the combined impact of all the shocks considered reducing global inflation by around ¼ percentage point per annum on average in the first two years.

These simulation results suggest that a sharp slowdown in China is a significant source of potential risk for global economic prospects.

Figure 1. A sharp slowdown in China would result in a sizeable shock to the global economy

Difference from baseline

Note: Simulated impact of a two-year decline of 2 percentage points per annum in domestic demand growth in China, a supply shock in China reflected in a rise of 10% in Chinese export prices, an increase of 50 basis points in global investment risk premia and a decline of 10% in equity prices in all economies. The red bars show the contribution from the direct demand-driven slowdown in trade; the blue bars show the additional contribution from adding higher Chinese export prices; the green bars show the combined contribution from higher uncertainty and lower equity prices. Commodity exporting economies include Argentina, Australia, Brazil, Chile, Indonesia, Russia, South Africa and other non-OECD oil-producing economies. East Asia includes Korea and the Dynamic Asian Economies.
Source: OECD calculations using NiGEM.

References

OECD (2021), OECD Economic Outlook, Volume 2021 Issue 2. https://doi.org/10.1787/66c5ac2c-en

Photo credit: Featured photo by Fabio Nodari/ Shutterstock.com


Asia & Pacific economies are projected to rebound from COVID-19

by Patrick Lenain and Kosuke Suzuki, OECD Economics Department

While the world is struggling to exit from the coronavirus crisis, the region Asia & Pacific is a notorious exception: many countries in the region have stopped the COVID-19 pandemic after the first wave, and they quickly returned on a path of growth in the second half of 2020 – a rare accomplishment. The OECD projects that the region’s recovery will continue in 2021 and 2022 (Table 1).

The region’s current resilience is in sharp contrast with the late 1990s, when the Asian Financial Crisis hit it very hard (Figure 1). Governments in the region drew lessons from this experience and were better prepared when the Global Financial Crisis arrived. They were also ready when the coronavirus struck: fiscal space was available, monetary policies were sound, exchange rates were flexible, foreign exchange reserves abundant, bank well capitalised, external indebtedness was low – and health systems had been re-organised.

Strong resilience in the face of crises contributes to long-term growth, especially in poor and emerging countries, as shown by a literature launched by Easterly et al. (1993). Thanks in large part to their growing resilience, the 15 countries and territories of Asia & Pacific doubled their share in world GDP from 19% in the early 1990s to 34% currently. The region has become an economic powerhouse and most likely will gain further ground. The Regional Comprehensive Economic Partnership (RCEP) recently signed will provide another boost to long-term growth, as discussed in the recent OECD Economic Survey of Thailand.

Of course, not all countries of the region have the same resilience. To throw light on this disparity, we use a hierarchical cluster analysis (Ward linkage), a statistical procedure that identifies homogenous groups of observations without making a difference between dependant and independent variables. We identify four groups of countries with common factors for each of the three crises. To group the region’s economies, we use the following indicators: 1) the depth of recession, 2) the speed of recovery, and 3) the post-recession scarring of growth. The first two indicators provide a contemporary measure of resilience when faced with a shock, while the third indicator is an ex-post measure of resilience. For the current crisis, we use the number of COVID-19 deaths as a proxy of ex-post resilience, in line with empirical findings that the spread of the coronavirus has damaged economic activity due a combination of government-imposed lockdowns and self-imposed lockdowns (Golsbee and Syverson, 2020).

Our cluster analysis reveals some diversity within the region. The resilience of individual economies has changed rapidly – in both directions (Table 2). Some key findings are:

  • Australia has shown great resilience during the first two crises, but fell into a recession with the coronavirus.
  • While China and India were resilient in the face of the first two crises, they have lost some ground with the COVID-19 pandemic, especially India.
  • Korea and Thailand have seen their resilience improve after each crisis.
  • Vietnam has consistently been the most resilient economy in the region.

Despite this diversity, the region displays overall a strong resilience and is placed to recover rapidly from the COVID-19 crisis, assuming that the pandemic is brought under control and that the large population can be vaccinated soon. If this happens, Asia & Pacific will confirm its new position as a global powerhouse. The return to economic growth should be an opportunity to address socioeconomic problems inherent in several countries, notably high informality and inequality, and make headways on a path of decarbonisation.

References:

Easterly, W., M. Kremer, L. Pritchett, and L. H. Summers (1993), “Good Policy or Good Luck? Country Growth Performance and Temporary Shocks,” Journal of Monetary Economics, 32, pp. 459–483.

Goolsbee A. and C. Syverson (2020), “Fear, Lockdown, and Diversion: Comparing Drivers of Pandemic Economic Decline 2020”, NBER Working Paper No. 27432, June.

OECD (2020), OECD Economic Surveys: Thailand 2020: Economic Assessment, OECD Publishing, Paris, https://doi.org/10.1787/ad2e50fa-en.

OECD (2020), OECD Economic Outlook, Volume 2020 Issue 2: Preliminary version, OECD Publishing, Paris, https://doi.org/10.1787/39a88ab1-en.


China’s GDP: What it means and why it matters

by Michael Pettis, Peking University and Carnegie-Tsinghua Center for Global Policy, drafted by Shashwat Koirala, OECD Economics Department

As a part of the Chief Economist Talks series, the OECD hosted Michael Pettis, Peking University and Carnegie-Tsinghua Center for Global Policy on May 25, 2020. This blog presents the takeaways from his presentation. More information regarding the OECD’s Chief Economist Talks, including previous speakers, can be found here.

On May 22nd, 2020, China announced that it would not set a GDP growth target for the first time in decades, given the uncertainty spurred by the COVID-19 pandemic. Understanding the implications of this decision requires unpacking what GDP represents in China and how it differs from other countries. This distinction reveals some of the forces that underlie China’s growth and highlights the challenges the country faces going forward.

Peculiarities of GDP in China

There are three issues regarding GDP in China.

The first is the extent to which GDP is a good proxy of real economic value, the crux of the argument being that not all value-generating activities are included in the calculation of GDP and not all activities included in GDP generate value. This is a problem common to all countries, but it may be particularly pronounced in China given its large share of non-productive public sector investment.

The second is the concern regarding the accuracy and honesty of China’s GDP statistics. However, while there may be some smoothing of volatility, the statistics likely follow generally accepted rules for GDP calculation.

The third issue, and the distinguishing feature of China, is that GDP is not an indicator of output, but rather an input. Unlike most other countries, China’s GDP is predetermined by its GDP growth target. Entities in China, including local governments, organise their production and stimulate the economic activity needed to meet this target. This explains why China always achieves its growth target (plus or minus a few tenths of a percentage point) and why GDP no longer functions as a measure of economic performance for China, but instead reflects the intention of its government.

Conditions for using GDP as an input

Any country is theoretically capable of guiding its GDP in the same way as China under three conditions.

First, it must have high debt capacity and the willingness to use it. In China, the economic activity needed to meet the GDP growth target is funded through borrowing. High debt is not inherently problematic (nor is it unique to China) if it funds productive investments that generate their own debt-servicing capacity. However, when it is used to fund non-productive activities (e.g. under-occupied real estate developments), as is the case in China, borrowing increases the debt burden. This reveals the second condition needed for a country to mechanically meet its GDP growth target: no hard budget constraint limiting entities from engaging in value-destroying economic activity every year.

Thirdly, there is an accounting condition. In China, debt used to fund non-productive investments (i.e. bad debt) is not written down and the losses from this investment are not formally recognised. As an illustrative example, consider two Chinas: both invest in non-productive real estate. Whereas China A, once it recognizes that it has made a bad investment, takes a full write-down on its asset, which reduces the value-added component of its GDP calculation, China B does not do so. This difference in reporting mechanics means that despite having the same economic reality, China B will have higher GDP than China A. While this allows China to meet any growth target it sets, it also means that its GDP overstates the health of the underlying economy (by the value of non-productive investment that is not written down).

Policy implications and COVID-19

If China’s debt capacity was unlimited, this dynamic could continue indefinitely. However, given a limit and since China’s borrowing does not fund investment that yields productivity gains necessary to service its debt costs, the debt-servicing costs must be allocated to some sector of the economy. For example, it could be allocated to households through inflation, to the rich through taxes, to the poor through wage suppression, and so on. This causes changes in behaviour, such as reduced investment from local businesses and diminished household consumption, which hurts China’s underlying economy.  

A key policy question, then, is how to bring China’s debt burden under control. Doing so would require scaling down the public investment’s share of GDP, which would necessitate replacing this source of demand. While productive private sector investment could theoretically fill this gap, the private sector in China is more prone to disinvestment. Besides, it is unable to match the size of the public sector. Instead, China could boost consumption. Currently, China has a very low consumption rate and households account for a low-share of GDP. To rectify this, China would need to liquidate assets of local elites and transfer them to households. This, however, is politically challenging to implement. Until Beijing is able to push through this type of household transfer, China must rely on non-productive public investment, which increases the debt burden, and hence, places a limit on the underlying economic growth in China. 

COVID-19 has not fundamentally altered anything in China. Rather, it has accelerated many of China’s underlying issues, including inequalities, trade imbalances and the debt burden. Official statistics indicate that China’s debt-to-GDP ratio increased from 239% at the end of 2018 to 245% at the end of 2019 (an increase of 6 percentage points); this year, under the most favourable conditions, this ratio can be expected to increase by 12-18 percentage points. This threatens China’s debt sustainability, effectively cutting its timeline to act by about two years. This is reflected in China’s decision to not set a GDP growth target, perhaps recognising the perils of its rising debt. 

References

Pettis, M. (2019), What is GDP in China?, https://carnegieendowment.org/chinafinancialmarkets/78138 (accessed on 2 June 2020).

Pettis, M. (2017), Is China’s Economy Growing as Fast as China’s GDP?, https://carnegieendowment.org/chinafinancialmarkets/72997 (accessed on 4 June 2020).


Where is China headed? Five key insights from the 2019 OECD Economic Survey of China

by Margit Molnar and Patrick Lenain, Country Studies Branch, OECD Economics Department

A short-term slowdown?

Although China’s economic growth has slowed, it is still
very robust by international standards and contributes to worldwide economic
expansion. Consumption is supported by steady
employment growth and rising incomes. Households are spending increasingly on
items such as e-commerce and shared services. Labour shortages keep wage growth
relatively high. However, continuing trade frictions are undermining exports
and creating uncertainties. Small and medium-size
enterprises are disproportionately affected. A further escalation of import
tariffs faced by Chinese exporters would have an even more severe impact on activity,
jobs, and corporate earnings – with a negative impact on the global economy.

Source: OECD Economic Outlook database.

Less manufacturing, more services?

China’s past development was mainly based on manufacturing production and capital accumulation. However, this model has run its course and led to misallocation of capital and excess capacity. Services are now increasingly driving growth, and not only the financial sector, but also e-commerce or digital services. Services related to international trade and global value chains, such as transport, logistics and computer services, are growing, but would benefit from further liberalisation.

Source: CEIC database.

Is local government debt a threat?

Infrastructure investment is mainly the responsibility of sub-national governments. To finance these investments, local governments have issued large amounts of debt, which have accumulated rapidly and now exceed a third of local output in eight provinces and in two provinces exceed half of it. Moreover, to circumvent borrowing limits, innovative ways to borrow have emerged and the illegal practice of guarantees is continuing. This has prompted the central government to curb such practices. However, the county level is mandated to deliver crucial public services such as education, environmental protection, health and social protection – with many of these mandates remaining unfunded. Recentralising some of these responsibilities to the central government, which is better funded, would ensure that wages of teachers, doctors and nurses are paid in every locality.

Note: Debt refers to outstanding amount.
Source: CEIC and Wind databases.

Is corporate debt a threat?

China’s non-financial corporate debt reaches roughly 155% of GDP, much higher than in other major economies. The state-owned enterprises (SOEs) have been the major group behind the soaring corporate debt: as of end-2017, non-financial SOE debt reached CNY 118.5 trillion. This is an increase of nearly four folds compared to end-2007. In particular, local SOEs have led the debt accumulation, with their debt reaching above 70% of GDP in 2016. In contrast to perception, it is not SOEs in industries plagued by overcapacity that shouldered most debt, but services firms in construction, real estate and transportation industries. Many of these SOEs are in fact local government investment vehicles, implementing urban construction projects. In late 2018, the authorities made it clear in a new document that they will let ailing SOEs and local government investment vehicles exit the market.

Source: Bank of International Settlements and CEIC databases and Ministry of Finance.

Why break down internal barriers to trade?

Local protectionism has long prevented the integration of product markets across China. Local governments have protected their market to keep the tax base within their jurisdiction and to stimulate local production of goods and services. Most measures are in residential construction, service procurement, tendering, insurance and medical goods and services. They relate to choosing specified service providers and excluding outside firms from participation in local tenders. This has prompted the central government to order all local governments to undertake self-investigation of measures hindering competition and to eliminate them within a year.

Source: Price Supervision and Anti-Monopoly Bureau, National Development and Reform Commission.

References:

OECD (2019), OECD Economic Surveys: China 2019, OECD Publishing, Paris.


The global impact of weaker demand growth in China

by Nigel Pain and Elena Rusticelli, 

Greater international integration has modified the transmission channels and the impact that external shocks have on domestic economies via increased trade openness and exposure to global financial developments. One important change, discussed in the special chapter of the latest OECD Economic Outlook, is that growth prospects in OECD economies have become more sensitive to macroeconomic shocks in non-OECD countries. This reflects the rising share of the emerging market economies (EMEs) in global trade and finance. EMEs now account for one-fifth of world trade, up from around one-tenth two decades ago.

Changes in trade patterns and also in the intensity of trade (trade openness) have implications for the strength of the spillovers from any shocks in the EMEs. One particular example – the size of spillovers from a negative demand shock in China – is discussed below, using simulations on the global macroeconomic model NiGEM. The scenario considered is a 2-percentage point decline in Chinese domestic demand growth that persists for two years.

The trade-related spillovers from this shock are considered using versions of the model with different sets of trade patterns and different levels of trade openness (the share of trade in GDP).

  • In a first scenario, the shock is simulated at a single point in time with two different sets of bilateral trade linkages in the model – the linkages that existed in 1995 and those that existed in 2016. The share of China in total global trade rose by close to 8 percentage points between these years.
  • In a second scenario, the shock is simulated using a single set of bilateral trade linkages – those for 2016 – but with the shock occurring at two different starting periods with very different levels of trade openness. On average across economies, trade openness is 11 percentage points higher in the second starting point for the shock than in the first. This change is broadly comparable to the rise in trade openness in the decade or so prior to the financial crisis.

The adverse effects of the China shock on GDP growth in other countries increase as China becomes more integrated into global markets and as each country becomes more open to trade (figure below). In the scenarios considered, negative spillovers increase by more when trade openness is changed than from the stronger role of China in global trade, thus indicating that the general rise in cross-border trade over recent history contributes more extensively to changing transmission of shocks than the increase in the weight of single countries. GDP growth in most major OECD economies is reduced modestly, by 0.1-0.2 percentage points per annum, with a stronger impact in Japan. Negative output spillovers are larger in open economies more exposed to China via tighter GVC linkages, such as East Asia or commodity exporters.

GDP growth in China declines by between 1¼-1½ per cent per annum, depending on the particular scenario considered, with import demand falling sharply. In the scenario with the higher level of trade openness, world trade growth declines by 1 percentage point per annum relative to baseline. At the same time, the slowdown in China puts downward pressure on export prices and import prices decline in all trade partners, partially helping to correct negative growth spillovers. Such effects become more important as the share of trade with China increases, and as economies become more open to trade.

The negative output spillovers would be larger still if monetary policy did not react, or was unable to react, to offset the adverse demand shock. Central Banks, targeting the deviation of inflation and nominal GDP from their target levels, cut policy interest rates, which by the second year of the shock decline by 25-50 basis points on average in the OECD countries (depending on the scenario considered) and by more in the economies most heavily exposed to China.

Heightened financial market uncertainty and weaker commodity prices could intensify the adverse impact of a demand shock in China over and above the direct trade-related impact considered here (OECD, 2015).

EOchina2018blogJuly

References:

OECD (2015), OECD Economic Outlook, Volume 2015 Issue 2, OECD Publishing, Paris.

OECD (2018), OECD Economic Outlook, Volume 2018 Issue 1, OECD Publishing, Paris.


Enhancing financial stability amid slowing growth in China

By Margit Molnar and Ben Westmore, China Desk, OECD Economics Department

Growth in China has been slowing gradually, but GDP per capita remains on course to almost double between 2010 and 2020. As a result, the Chinese economy will remain the major driver of global growth for the foreseeable future. Patterns across the country vary, however: in some areas slowing investment has brought down growth, while in other, mainly less-developed ones, both investment and GDP are growing at or close to double-digit rates (Figure 1).

china slowdown g and i

Growth in recent years has been fuelled by fast-rising credit and has come at a cost. Financial risks are mounting on the back of an inflating housing bubble, high and rising enterprise debt, expanding non-bank activities and enormous over-capacity in some sectors. Liquidity expanded rapidly over the past couple of years as the reserve requirement ratio was lowered gradually (Figure 2). Mortgage lending soared, fuelling housing prices, in particular in the largest cities. A burst of the housing bubble would hurt the real estate, construction and several manufacturing industries. However, household indebtedness remains moderate and prudential regulations for mortgage loans are stringent, so the financial sector could likely absorb the shock. Consumer finance has also grown rapidly, spurred by the expansion of online peer-to-peer lending platforms. Some of these new lenders are loosely regulated and do little to verify the repayment ability of borrowers. While financial institutions should be encouraged to lend only to people able to service their debt, improvements in household financial literacy are also needed.

China high liquidity

In contrast to moderate household debt, non-financial corporate debt rose from less than 100% of GDP at the end of 2008 to 170% by mid-2016 (Figure 3). This sharp pick-up was due in large part to increased leverage of SOEs. The rapid accumulation of corporate debt combined with a slowdown in economic activity and some of the practices of financial institutions have significantly heightened systemic risks. Under the macroprudential framework announced in January 2016, banks are required to disclose wealth management product exposures on their balance sheet, which will benefit systemic stability. To further contain risks, more effective monitoring and control of leveraged investment in asset markets is required.

China corp debt

The authorities have initiated debt-to-equity swaps in heavily indebted enterprises and approved the issuance of credit default swaps that pay out if there is a default on the underlying loan. A debt-to-equity swap will be initiated for enterprises that cannot service their immediate debts but are considered to be financially sustainable in the medium to long term by the lender. Only a limited group of firms conform to both these conditions, restricting the potential scale of such measures. Indeed few swaps have gone ahead so far as banks have been unwilling to take on the increased risk associated with becoming equity holders. The securitisation of NPLs has also been encouraged, which may be preferable to debt-to-equity swaps insofar as it reduces the exposure of banks to underperforming corporates and the NPLs are acquired by an entity with greater expertise in restructuring the company. Nevertheless, China’s securitisation market is relatively shallow at present, limiting the potential scale of such transactions.

The recently published 2017 OECD Economic Survey recommends enhancing prudential regulation by requiring lenders to take into account borrowers’ repayment ability when extending loans. It also advocates restricting leveraged investment in asset markets.

Reference

OECD (2017), OECD Economic Surveys: China, OECD Publishing, Paris.


Making the most of innovation in China

by Margit Molnar, Head of China Desk, OECD Economics Department

On several measures, China has caught up with OECD economies in the area of innovation.

On the input side, R&D spending as a percentage of GDP has reached 2% (Figure 1), on par with major European countries. This is more than in other middle-income countries such as Mexico, Turkey or Chile do, though still much less than in the leading innovators such as the US, Japan, or Korea.

China RandD

On the output side, measured by the number of patents, China has become a global leader, surpassing the United States in 2015. In that year, China’s patent filings exceeded one million ‒ over a third of the world’s total. Another indicator, the share of new products, points in the same direction (Figure 2). The share of new products is high and increased markedly in several high-tech industries such as computer or electrical equipment manufacturing.

China new products share

Thus, at first sight, things appear to be improving fast: increasing research inputs are coupled with increased innovation output.

When digging under the surface, however, it turns out that the elasticity of patenting with respect to R&D spending is small. On average, the impact on productivity of new patents has declined, though private firms appear to achieve greater productivity gains from their R&D efforts.

This largely reflects quality and relevance issues. Most Chinese patents are utility or design patents and only a smaller share are genuine inventions. And while China is registering an increasing number of patents in other countries, these are only a fraction of the total. On this measure, China lags behind most OECD and many emerging economies (Figure 3).

China innovation outcomes

As the 2015 OECD Economic Survey of China pointed out, the utilisation rate of university patents is low at around 5% compared to 27% in Japan for example. In contrast, for firms it approaches nearly two-thirds, comparing well with other countries. A successful example of increasing utilisation is the applied laboratory for nanotechnology under the Chinese Academy of Sciences established in 2015.

Innovation and the diffusion of its benefits are hampered in China by limited collaboration across firms, as shown by the patent survey by the State Intellectual Property Office. In the Chinese ecosystem of innovation, vertical linkages or interactions with suppliers and customers are well established but horizontal linkages are more limited. Most R&D projects are carried out by the firm alone, collaborative projects with research institutions are rare and with other firms even scarcer. This silo effect is detrimental to potential spillovers and the exploitation of complementarities across firms.

Weak protection of intellectual property rights (IPR) has hampered innovation and patenting in China. Companies often do not bother registering patents: two-thirds of them think that patent rights cannot effectively prevent others from copying their inventions. According to a country-wide representative survey of patent holders by the State Intellectual Property Office, 18% of patent owners have experienced a violation of their rights, but 37% of them did not take any measure in response. The problem is especially acute for micro-enterprises. Domestic firms are more likely not to respond than foreign-invested firms. Over half of the firms think that better protection by patent rights would effectively stimulate innovation at firm level and 87% say that IPR protection should be strengthened. In addition to IPR protection, most firms try to (i) reap the first-mover advantage by quickly marketing their invention, (ii) sign confidentiality agreements with staff or (iii) change products quickly so that competitors cannot catch up.

The 2017 OECD Economic Survey recommends strengthening IPR protection by more systematically prosecuting violators and raising fines.

References

Boeing, P., E. Mueller and P. Sandner (2016), “China’s R&D explosion – Analysing productivity effects across ownership types and over time”, Research Policy, Vol. 45.

Dang, J. and K. Motohashi (2015), “Patent statistics: A good indicator for innovation in China? Patent subsidy program impacts on patent quality”, China Economic Review, Vol. 35.

European Chamber of Commerce (2016), European Business in China Position Paper 2016/2017.

Guo, D., Y. Guo and K. Jiang (2016), “Government-subsidised R&D and firm innovation: Evidence from China”, Research Policy, Vol. 45.

Hu, A. and G.H. Jefferson (2009), “The Great Wall of patents – What is behind China’s recent patent explosion?”, Journal of Development Economics, Vol. 90(1).

Ito, A., Z. Li and M. Wang (2014), “What types of science and technology policies stimulate innovation? Evidence from Chinese firm-level data”, RIETI Discussion Paper Series 14-E-056.

OECD (2017), OECD Economic Surveys: China, OECD Publishing, Paris.

OECD (2015), OECD Economic Surveys: China, OECD Publishing, Paris.

State Intellectual Property Office (SIPO) (2016), 2016 Nian quanguo zhuanli diaocha jichu shuju baogao, in Chinese (2016 National patent survey basic data report).

State Intellectual Property Office (SIPO) (2015), 2014 Nian Zhongguo zhuanli diaocha baogao, in Chinese (2014 China patent survey report).


An immediate Chinese challenge: further addressing vast income inequality

by Ben Westmore, China Desk, OECD Economics Department

The goal of the Chinese government to achieve a “moderately prosperous society in all respects” by 2020 is centred around improving social welfare throughout the population. One of the essential ingredients to doing this is a further reduction in economic inequality.

As underlined in the OECD 2017 China Economic Survey, China’s income inequality as measured by the Gini coefficient has been on a declining trend since 2008 after having climbed to a very high level (Figure 1, Panel A). This reflects some regional income convergence, as the central, western and northeastern parts of the country have made progress catching up with the east, and a narrowing of the urban-rural income gap. Across the income distribution, incomes of those in the middle have risen particularly strongly.

Nevertheless, there are signs that many of the poorest are being left behind. The gap between the richest and poorest urban households in terms of disposable income has barely narrowed. In rural areas, it has even widened (Figure 1, Panel B).

China inequality blog 1

The large and persistent income gap is partly the fault of China’s tax and transfer system (Figure 2). In particular, the redistributive influence of the personal income tax regime is stifled by a very generous personal income tax allowance and exemptions that favour high-income individuals. Rules around social security contributions are also regressive. For example, all workers need to make a minimum contribution irrespective of actual income earned and there is a cap on payments.

China redistribution blog2

On the transfer side, there has been a big increase in the coverage of the main social assistance scheme (the dibao) since 2000, especially in rural areas. However, there are massive discrepancies in benefits between locations depending on the financing capacity of local governments. While the coverage of unemployment insurance has picked up in recent years, it remains low. Moreover, for the unemployed that do receive benefits, the replacement rate is meagre by OECD standards.

There is also the need to enhance the opportunities of poorer households through reforms outside those relating to the tax and transfer system.  Access to good quality education must be broadened, as educational performance is influenced more by socioeconomic factors than in OECD countries. Gaping disparities also exist in access to health resources, especially between urban and rural areas, which translate into inequities in overall wellbeing. Fortunately, the government is prioritising these areas, as there is much work to do over the next few years so that China can be confidently classified a “moderately prosperous society in all respects”.

References

OECD (2017), OECD Economic Surveys: China 2017, OECD Publishing, Paris.

OECD (2015), In It Together: Why Less Inequality Benefits All, OECD Publishing, Paris.


Is Mexico a new ‘China’???

By Sean M. Dougherty, Head of the Mexico Desk, OECD Economics Department.

China’s spectacular growth during the 1990s and early 2000s made it the envy of many other emerging economies. Yet more recently, relative labour costs have risen substantially, and economies such as Mexico’s, which lost export market share for some time, have made a partial comeback. However, Mexico’s increasing competitiveness masks one of the country’s fundamental concerns, which is weak productivity improvements. In a new working paper being released today, while the Global Forum on Productivity opens in Lisbon, we examined the evolution of multifactor productivity in Mexico’s manufacturing sector, as compared to China’s (see Dougherty & Escobar, 2016). Firm-level micro-data were used to examine the distribution of productivity across Mexico’s states, and also to track the misallocation of resources.

It turns out that Mexico’s increasing competitiveness and attractiveness masks one of the countries’ fundamental concerns, which is the absence of productivity improvements. Mexico’s productivity lags behind that of other major emerging economies, and it has suffered from a negative growth trend – at least until the recent package of structural reforms (OECD, 2015a). It turns out that multi-factor productivity differs considerably across firms and regions, a situation not unlike that in many OECD countries. While Mexico’s most productive firms are performing relatively well, and can compete with China’s, the vast majority of firms are struggling to perform better with limited success, leading to a growing dispersion in productivity (see figure below). A similar situation is observed in other OECD countries where there is a rising gap in productivity between the most advanced firms and the laggards, and the gains in productivity of the most advanced firms are not enough to improve aggregate productivity (OECD, 2015b).

Mex a new china

We also took advantage of Mexico’s federal structure to study the drivers of productivity using econometric techniques to address potential reverse causality. Our findings suggest that among other factors, a stronger rule of law increases productivity in Mexico. This is robust to previous OECD evidence, which suggests that firms in Mexico’s states with more effective legal systems tend to be substantially larger and more productive (Dougherty, 2014).

Our results also show that among the institutional quality-related variables, informality has the strongest effect on productivity. Moreover, we consider informality as a source of distortions that contribute to the misallocation of resources. Our results are robust to various methods, and imply a strongly negative relationship between informality and productivity. Among different size firms, informality in microenterprises (up to 10 workers) has the strongest negative effects on productivity. The results also suggest – for the first time that we know of – that more productive states and industries suffer more from informality than less productive ones. This is likely due to resources being perversely tied up in informal activities, akin to the ‘Zombie firms’ that are now being investigated at OECD. Tackling informality is a complex challenge, and one that requires a multi-faceted approach (OECD, 2013, 2015a).

The results also suggest that the mere presence of foreign investment improves productivity – with the exception of Maquiladora industries, which are missing out on productivity gains. This is likely due to Maquila’s undue emphasis on low-end, low-skill assembly operations, which have often not fared very well in competition with China. Moreover, weak education quality simultaneously acts as a major restraint on productivity, and it aggravates informality.

In summary, we can conclude that Mexico is not a ‘China’, yet.

References:

Dougherty, S. (2014), ‘Legal reform, contract enforcement and firm size in Mexico’, Review of International Economics, Vol. 22, No. 4, September 2014.

Dougherty, S. and O. Escobar (2016), ‘Could Mexico Become the new “China”?  Policy Drivers of Competitiveness and Productivity’, OECD Productivity Working Papers n°4. (Also forthcoming in the European Journal of Comparative Economics.)

OECD (2013, 2015a), Economic Surveys of Mexico, OECD Publishing, Paris.

OECD (2015b), The Future of Productivity, OECD Publishing, Paris.