Productivity, productivity, wherefore art thou?  (Romeo and Juliet: Act 2, Scene 2)

First published on OECD Insights http://wp.me/p2v6oD-2vJ.

By OECD Statistics Directorate

Four hundred years after the death of Shakespeare there remain many misconceptions on what he wrote. Perhaps the most common concerns the adulterated quote above, which is actually a reference to why Romeo was a Montague rather than where Romeo was. In the same spirit of confusion, recent years have seen considerable debate about the causes of the productivity slowdown seen across OECD countries.

This year’s Productivity Compendium includes a special chapter that casts a spotlight on some of the potential villains stalking the stage, together with insights from the OECD Productivity Database, and frames the discussion under the umbrella of the Productivity Paradox: a reference to the fact that productivity has slowed during a period of significant technological change, increasing participation of firms and countries in global value chains and rising education levels in the labour force.  Indeed, the advent of digital innovations such as Big Data was expected to have sparked off a new wave of productivity growth, similar to those seen in the past, for example, as a result of electrification in the early 1900s and the ICT wave in the 1990s.

However, this has not yet materialised, raising a number of still largely open questions, ranging from potential lagged effects of these new technologies, a thinning out of new ideas (Gordon, 2012) to a breakdown of the ‘diffusion’ machine (OECD, 2015), right through to measurement.  Indeed, against a backdrop of increases in income and wealth inequalities, concerns have emerged that this may reflect a structural, and not a cyclical, slowdown, with consequential impacts on well-being and long-term growth; hence the theme for this year’s OECD Ministerial meeting and OECD Forum : “Enhancing Productivity for Inclusive Growth” www.oecd.org/forum.

Double, double toil and trouble (Macbeth: Act 4, Scene 1)

But whilst all of these actors may in part explain the recent post-crisis productivity slowdown, often overlooked in the debate is that the slowdown in productivity is not a recent affair, a fact that even Macbeth’s witches may have struggled to foresee. The OECD Compendium of Productivity Indicators 2016 reveals that productivity growth began to slow well before the crisis; trending down since the early 2000s in Canada, the United Kingdom and the United States and since the 1970s in France, Germany, Italy and Japan (Figure 1).

Fig1-Productivity-G7.fw

Download graphs and data in Excel

Part of this downward trend in labour productivity can be explained by slower growth in multi-factor productivity (MFP), lending some weight to the arguments that technological spill-overs and diffusions from ICT, and other new technologies may be lower than from earlier technology breakthroughs. But lower MFP growth is not the only source.  In many countries the contribution of capital deepening has also declined significantly, particularly in recent years.

Nothing will come of nothing (King Lear: Act 1, Scene 1)

Although King Lear uttered the words above to his daughter Cordelia to solicit overt affection, his words are now typically used to illustrate that without investment, neither growth, nor indeed productivity, will follow. The Compendium shows, for example, that the direct contribution of information and communication technology (ICT) capital goods to productivity reached its peak in the late 1990s and has gradually waned since then, significantly so in most countries (Figure 2).

Fig2-contribution-ICT-capital.fw

Download graph and data in Excel

And although the shares of ICT investment have held up reasonably well compared with other forms of investment, ICT investment as a share of GDP also remains below previous highs in many countries (Figure 3). Moreover, when measured and included, although knowledge based capital has held up better, it too has slowed in recent years and makes little change to the overall picture.

Fig3a-3b-ICT-investment.fw

Download graphs and data in Excel

Truth is truth, to the end of reckoning (Measure for measure: Act V, Scene 1)

One suspect behind the slowdown, well versed in having to deal with the ‘slings and arrows of outrageous fortune’ is measurement.  Indeed so prevalent is the view that measurement is at fault, particularly relating to the measurement of new disruptive (digital) technologies, such as Big Data,  and business models, such as AirBnB and UberPop, it has been given its own acronym, MMH, the Mis-Measurement Hypothesis.  The spread of digitalised applications has brought with it the provision of free services such as internet search capacity and media content and new business models, many of which are dependent on greater participation (i.e. labour input) by consumers.  But the consumer’s activity remains (by and large) outside of the GDP production boundary, and the free services received are not captured as household consumption, raising questions about a missing ‘consumer surplus’ from GDP.

However, whilst it is clear that digitalisation may have compounded long standing measurement issues, in particular the measurement of price change and, so in turn, volume measures used in productivity measurement, and where efforts to improve measurement continue, the evidence increasingly suggests that the MMH is, at best, only partially true.  Syverson (2016) for example shows that US GDP would have been around 15% higher in the third quarter of 2015 if the recent slowdown (post 2004) hadn’t occurred, swamping any potential unmeasured productivity growth and estimates of the consumer surplus, while Byrne, Fernald, and Reinsdorf (2016) show similar results.  Ahmad and Schreyer (2016) further demonstrate that the GDP accounting framework is ‘up to the challenges posed by digitalisation’ and reinforce the distinction that needs to be made between GDP and welfare and indeed consumer surplus.

This is the short and the long of it (The Merry Wives of Windsor: Act II, Scene II)

In summary therefore the evidence suggests that the productivity slowdown is real and not a statistical phenomenon.  True as this may be, it is also true that attempts to identify the causes of the slowdown can be greatly facilitated by improved availability or use of firm-level statistics in analyses, in particular on intra-firm transactions, and improved data on investment by type of asset, occupations, and skills. So, although statistics are not at fault they continue to provide the best route for a solution to the paradox and the key for policies that can restart the productivity engine.


The OECD Productivity Database

The OECD Productivity Database contains a consistent set of internationally comparable data on levels and growth rates of labour productivity, hours worked, employment, capital services, multifactor productivity and unit labour costs for OECD countries and Key Partners. It also includes growth measures of labour productivity, hours worked, employment and unit labour costs by main economic activity. These series, available from 1970 onwards for some countries, are updated on a daily basis.

Get real-time data at OECD Productivity Statistics (Database)


References

Ahmad, N and P. Schreyer (2016), “Measuring GDP in a Digitalised Economy”, OECD Statistics Directorate Working Paper, forthcoming.

Byrne D., J. Fernald and M. Reinsdorf (2016), “Does the United States have a productivity slowdown or a measurement problem?”, Brookings Papers on Economic Activity, BPEA Conference Draft, March 10-11.

Gordon, R. (2012), “Is US Economic Growth Over? Faltering Innovation Confronts the Six Headwinds”, NBER Working Papers, No. 18315.

OECD (2015), The Future of Productivity, OECD Publishing, Paris, http://dx.doi.org/10.1787/9789264248533-en.

OECD (2016), OECD Compendium of Productivity Indicators 2016, OECD Publishing, Paris, http://www.oecd.org/std/productivity-stats/oecd-compendium-of-productivity-indicators-22252126.htm.

Syverson, C. (2016), “Challenges to mismeasurement explanations for the U.S. productivity slowdown”, NBER Working Paper No. 21974, http://www.nber.org/papers/w21974.


Structural reforms in a difficult time

By Naomitsu Yashiro,
Structural Surveillance Division, OECD Economics Department

The pace of structural reforms is slowing just when the world economy needs decisive policy actions to strengthen fundamentals and restore healthy growth (the 2016 Going for Growth report). Policy makers may be concerned that introducing structural reforms in the current context involve trade-offs between the mid- to long-run gains in employment and productivity and short-run losses.

In our recent paper (Caldera Sánchez, de Serres and Yashiro, 2016), we note that when the economy is near its potential, and confidence among consumers and investors is high, gains from growth-enhancing reforms have been found to exceed potential losses even in the short run, as demand increases on the anticipation of the future benefits. However, the short-term impact of reforms may be less favourable when they are introduced in difficult macroeconomic conditions, as several factors may prevent a pick-up in demand. In some circumstances, specific reforms may even entail short-term reductions in demand.

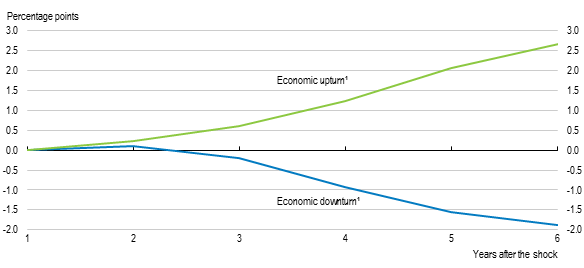
There are several conflicting channels through which reforms affect the real economy. The strength of the channel can change under different macroeconomic conditions. Take reforms of unemployment benefits that aim to improve work incentives by strengthening the conditionality of income support in the case of a lay-off on intensive job-search efforts. By facilitating the return to work, such reforms raise employment, household income and thus consumption. However, uncertainty regarding disposable income also increases, potentially discouraging consumption. In good times, employment gains can be quick, so that output increases within 2-3 years after reforms. But during recessions when the unemployed are less likely to find jobs the gains in employment can even turn negative (See figure).

The gains in employment of an unemployment benefit reform
can turn negative during a downturn

Reforming in a difficult macro context

Note: The lower (upper) line corresponds to the impact of the reduction in the initial unemployment benefit replacement rate during economic downturn (upturn), where the economic cycle is measured through the level of the pre-reform unemployment gap (i.e. the difference between the structural unemployment rate and the unemployment rate). The economic downturn (upturn) corresponds to the case where unemployment gap is set to the minimum (maximum) value within the sample.
Source: Bouis et al. (2012).

Other reforms that seek to restore competitiveness through lower relative costs and prices can also depress demand if conducted during downturns. This is because in bad times labour and goods demand respond little to the lower wages and product prices resulting from reforms, while workers or firms see their income and profit eroded in the short term. Ideally, governments can deploy expansionary fiscal policies or monetary policies to support demand. But, in some cases, macro policies may also be constrained, as has been the case for several countries in the past few years. Strong external demand can help to bring forward the benefits of reforms as well. For instance, our review of case studies suggests that Canada’s labour market reforms around the mid-1990s benefited from strong demand from the United States. This supported the gains in employment following the reforms.

Even under limited supports from fiscal and monetary policies or external demand, a smart packaging or sequencing of reforms can alleviate the negative short-run impacts on demand: (1) reforms of labour and product markets can be conducted in tandem, so that the lower prices from stronger competition limit the impact of labour market reforms on real wages; (2) addressing dysfunctions in the financial sector as early as possible can improve access to credit and allow households and firms to capitalise on the future benefits of reforms and expand consumption and investment today; (3) reducing policy uncertainty through well-communicated, credible reform strategies can prevent the deterioration of confidence among business and consumers.

Many reforms can boost demand by themselves even during difficult macroeconomic conditions. For instance, measures aimed at raising investment in knowledge-based capital, including through infrastructure spending, as well as tax structure reforms can bring short benefits. Also, reducing regulatory barriers to entry in services sectors with large pent-up demand and relatively low entry costs (like professional services or taxis) can boost business expansion and employment relatively quickly. Similarly, reducing barriers to geographic or jobs mobility can increase the speed of employment gains in difficult times. Strengthening active labour market policies and to alleviate skill shortages and mismatch can unleash business activities that were previously constrained by skills bottlenecks. Reforms that contribute to the long-term sustainability of public finance and to the cost-effectiveness of healthcare or pension systems can reduce uncertainties on household’s future income, thereby boosting consumption today.

References:

Caldera Sánchez, A., A. de Serres and N. Yashiro (2016), “Reforming in a difficult macroeconomic context: A review of the issues and recent literature”, OECD Economics Department Working Papers, No. 1297, OECD Publishing, Paris.

OECD.  (2016), Economic Policy Reforms 2016: Going for Growth Interim Report, OECD Publishing, Paris.


Can we improve real-time estimates of the output gap for policy purposes?

 
By David Turner, Yvan Guillemette & Maria Chiara Cavalleri,
Macroeconomic Analysis Division, OECD Economics Department

The output gap ought to be a key input in short-term policy-making because it provides a summary measure of economic slack, so allowing policy-makers to anticipate inflationary pressures. It can also be used to estimate cyclically-adjusted measures of the fiscal balance, to provide a better assessment of fiscal sustainability. Unfortunately, estimating output gaps is far from an exact science, and estimates are often revised leading some to question their usefulness.

Recent OECD work proposes a way of incorporating additional information into the existing OECD methodology that should better anchor output gap estimates so they are less prone to revision. Estimating the output gap essentially means trying to disentangle the sustainable trend component of output from its cyclical component. Large revisions to a key component of the output gap occur because simple statistical filtering techniques, such as the Hodrick-Prescott filter, cannot distinguish trend from cycle at cyclical turning points when they occur at the end of the sample. Indeed, revisions to OECD published estimates of the output gap for G7 countries over the immediate pre-crisis period have typically been 2–3 percentage points and sometimes larger.

To better distinguish trend from cycle, the paper proposes exploiting historical correlations between key components of the output gap and other macroeconomic variables which are available on a timely basis: particularly manufacturing capacity utilisation and the share of investment in GDP, and for some countries credit, house prices or the unemployment rate. How strongly each of these variables correlates to output gap components varies by country, but overall revisions to the output gap are reduced when a highly-correlated factor is considered in the estimation.

The additional adjustment substantially reduces revisions over the crisis period; the occurrence of revisions exceeding 2 percentage points is reduced from six of the G7 countries to a single country and the root mean square revision at turning points is reduced by one-third on average (Figure).

Root mean squared revisions to a key component of the output gap for 2007 and 2009

Percentage points of potential GDP

Output gap turner

Note: The chart shows revisions to the labour efficiency gap which is the main component of the output gap accounting for large historical revisions. Revisions are calculated both for a simple Hodrick-Prescott (HP) filter and an HP filter which is modified with the additional cyclical adjustment. Revisions for 2007 (2009) are calculated by applying the filtering procedure to data ending in 2007 (2009) to derive an initial estimate of the gap and then applying the same procedure over the full sample to 2014.

Useful though it is, this twist on the current methodology is not a panacea. Also, the size of eventual output gap revisions is only one of the yardsticks against which different methodologies should be evaluated. After all, a rule that the output gap was a fixed number would show no revision at all, but would be useless for policy. Good estimates should also pass the ‘smell test’ of credibility and be able to explain inflation developments. Research on these issues is ongoing at the OECD and elsewhere.

References:

Turner, D., M.C. Cavalleri, Y. Guillmette, A. Kopoin, P. Ollivaud and E. Rusticelli (2016), “An Investigation into Improving the Real-Time Reliability of OECD Output Gap Estimates”, OECD Working Papers, No. 1294, OECD Publishing, Paris.


Untying the knots strangling Brazil’s competitiveness

by Sónia Araújo
Economist, Brazil Desk, OECD Economics Department

There is strong international evidence that trade liberalisation and increased international integration are key elements of a successful growth strategy. Exposure to international competition, sourcing internationally and learning by exporting accelerates technological upgrading and fosters productivity growth. This column explains how three policy instruments are holding back competitiveness by limiting Brazil’s ability to tap into the global pool of knowledge.  

 Despite a constitutional amendment in 2003 intended to exempt exports from indirect taxes, Brazilian exporters face tremendous hurdles in claiming back indirect taxes paid on intermediate inputs. Poultry exporters, for instance, estimate that the government owes them around 7% of the value of their exports on account of the several indirect taxes paid on inputs. After attempting to claim these credits for years, companies simply prefer to write off these amounts.

The competitiveness of industrial exports is suffering even more than that of raw and semi-processed goods on two accounts: higher rates are applied to products requiring more transformation and indirect taxes are cumulative. Indirect taxes on inputs embodied in exports put Brazilian producers at a disadvantage vis-à-vis foreign competitors who do not pay such taxes.

Brazilian exporters are also penalised by Brazil’s high import tariffs, which are the highest among the BRICS countries for non-agricultural products (see previous post on Brazil: A tale of two industries or how openness to trade matters, March 22, 2016). Together with local content requirements that expand into an increasing number of sectors (oil, chemicals, motor vehicles, telecoms, health, etc.), they prevent Brazilian companies from sourcing at the lowest cost.

Advocates of trade protection often claim that protection raises the performance of domestic industry over time. Brazil’s own experience in this area is sobering. There is no evidence that high levels of protection have spurred Brazil’s exports, which have remained flat relative to GDP (Figure 1).

Figure 1. Brazil’s share of world trade is low relative to its GDP
Share of exports and imports on world’s total exports and imports, respectively
Brazil Sonia 1
Source: Secretaria de Comércio Exterior (SECEX) do Ministério do Desenvolvimento, Indústria e Comércio Exterior (MDIC), World Bank Development Indicators.

In fact, the share of manufacturing output in GDP has been declining for a decade and manufacturing productivity is low and stagnant (Figure 2).

Figure 2. Manufacturing productivity is low and stagnant
Labour productivity in thousands of constant 2005 USD per employee

Brazil Sonia fig2

Source: World Bank, ILO, IBGE.

By international comparison, Brazil’s industrial sector is small for a middle income country (Figure 3; OECD, 2015).

Figure 3. Brazil’s industrial sector is small for an upper middle income country
Share of industry in total value added in middle income countries, in per cent, 2012

Brazil Sonia fig3

Source: World Bank.

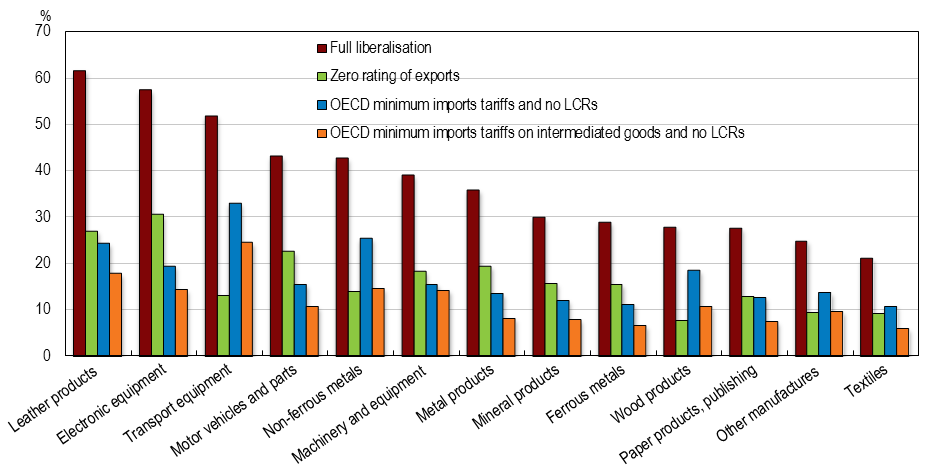
In a recent study we attempt to quantify the effects of lifting these barriers to trade using the OECD Metro model, a computable general equilibrium model of the world economy. The simulation results suggest that reducing import tariffs and local content rules, and effectively exempting intermediate inputs from indirect taxes would boost Brazilian exports, production and jobs substantially. The largest gains would accrue in manufacturing, where exports of leather products, electronic and transport equipment, motor vehicles and non-ferrous metals would all increase by more than 40% (Figure 4). Job creation would be higher in lower skilled occupations, benefiting those at the lower end of the income distribution.

Figure 4. Largest Gains in Exports
Sectors with an increase in exports of at least 20%

Brazil Sonia fig5

The simulation results also suggest that these tax and trade policy reforms would bring clear efficiency gains to the economy: firms would be able to use a higher share of foreign intermediate goods and final goods would in turn be sold at lower prices, enhancing export competitiveness and benefiting Brazilian households.

Another result from our simulations is that it pays to go for a big push. The benefits of a wide-ranging trade liberalisation would far exceed those of partial reforms. Overall, getting rid of these barriers would enable Brazil to develop a stronger manufacturing sector and become much more integrated into the global economy.

Find out more

Araújo, S. and D. Flaig (2016), “Quantifying the Effects of Trade Liberalisation in Brazil: A Computable General Equilibrium Model (CGE) Simulation”, OECD Economics Department Working Papers, No. 1295, OECD Publishing, Paris.

OECD (2015), OECD Economic Surveys: Brazil, OECD Publishing, Paris


Reforming benefits in Lithuania to generate a double dividend: Making work pay while better protecting the jobless

By Lilas Demmou, Head of Lithuania Desk, OECD Economics Department

Inequality measures in Lithuania (like in Estonia and Latvia) are high. To an important extent this is related to the high risk of poverty for non-working individuals and to the low rewards to work. Therefore, increasing the quality of jobs, ensuring that the most vulnerable have access to employment and providing adequate income support for those that have lost their job are key for making labour markets and the economy more inclusive. Lithuania provides an interesting example on how to reform out-of-work benefits to reconcile three major objectives i) providing adequate support for living, ii) improving labour market matching by allowing job seekers to devote enough resources to job search iii) maintaining financial incentives to search for a job and accept a vacancy.

In Lithuania less than 20% of unemployed are covered by the unemployment benefit system and the replacement rate is comparatively low. Social assistance benefits have been in practice the main income buffer in the case of job loss: the number of recipients increased from 1% of the total population before the crisis to around 7% at its peak (Panel A).

However, the social assistance system provides also only a very low level of income replacement (at maximum half the poverty line for single individuals) and insufficient incentives to work due to complete and immediate benefit withdrawal in case of accepting a formal job for the large majority of social assistance recipients. As a result of restrictive and low out-of-work benefits, losing a job goes often hand-in-hand with high risks of poverty, generating an inactivity trap and skills mismatch.

lithuania one

In line with OECD countries experience (Immervoll and Pearson, 2009), providing in-work benefits could strike a balance between labour market inclusiveness and maintaining incentives to work. Recent studies on Lithuania show that effective marginal taxation related to benefits withdrawal reaches almost 75% of additional income for low paid jobs (Panel A). The current in-work benefit scheme reduces effective taxes and increases work incentives by adding up to 25% of total income for those eligible with the lowest earnings. However, the macro effect on poverty remains limited due to the narrow population covered by the current system (2% of social assistance recipients) because high informality requires strict eligibility.

Against that background, reforming unemployment benefits might generate a double dividend: it would improve the functioning of the labour market by providing adequate support for job search and would reduce incentives for informal wage payments. Our simulations show that modifying the unemployment benefit system in line with the government’s proposed reforms under the “New Social Model” would roughly double the level of the average annual replacement rate and would increase the number of benefit recipients by 13%. The reform would be associated with a large increase in the disposable income of those at the bottom of the income distribution and a large increase in the replacement rate at the upper part of the income distribution, as the level of the benefit ceiling is increased (Panel B).

disponsable lithuania

Source: Navicke J., Avram S. and Demmou L., (2016)

This stronger link established with previous earnings would allow in a second step strengthening in-work benefits system by reducing incentives for underreporting wages.

Find out more:

Immervoll, H. and M. Pearson (2009), A good time for making work pay? Tacking stock of in-work benefits and related measures across the OECD, OECD DELSA working paper n.81 

OECD (2016), Economic Survey: Economic Assessment of Lithuania 2016, OECD Publishing

OECD (2015), Investing in Youth :Lithuania, OECD Publishing

Navicke J., Avram S. and Demmou L., (2016), The effects of Reform Scenarios for Benefits Systems on Work Incentives and Poverty in Lithuania, OECD Economics Department working paper forthcoming


Norway… time to prune farm subsidies?

By Philip Hemmings, Head of Norway Desk,
OECD Economics Department

Norway puts a high priority on maintaining high levels of well-being in rural communities, many of which are in remote and challenging environments. While it is broadly successful in achieving this goal, it comes at a high price, most notably in the form of substantial support to farmers. Is there a better way?

Each agricultural holding in Norway receives, on average, support worth nearly € 62 000 each year, according to OECD calculations, making the country’s agricultural sector among the most heavily subsidised in the OECD area. Overall, subsidies to farms represent around 60% of gross farm income (see chart). Farmers are not only supported by government-funded subsidies but also benefit from special tax breaks and from custom’s tariffs on food imports, the latter contributing to Norway’s  comparatively high retail food prices. Furthermore, the status quo in farming is supported by concessions and special rules in legislation, which for instance limit corporate ownership of farms and provide advantageous inheritance laws for farming families.


Norway’s support to agricultural producers is high

norway phil

Note:  Calculations based on policy settings as of 2014. The OECD’s approach to estimating support for the agricultural sector takes into account not only direct payments to farmers from support schemes, but also forms of indirect support, such as customs tariffs and general support (e.g. publically funded agricultural research). This figure shows the producer support estimates, which measures the ratio of transfers from consumers and taxpayers to individual agricultural producers to gross farm receipts (including support, which means, for instance that a 50% PSE means that support equals that of net farm receipts, valued at world market prices).
Source: OECD (2015), “Producer and Consumer Support Estimates”, OECD Agriculture statistics (database).

Reform of Norway’s traditional fishing industry and the country’s hugely successful aquaculture industry demonstrates that the country’s rural communities have capacity for change and an ability to seize opportunity. Subsidies to fishing communities have fallen substantially, thanks to measures encouraging more economically competitive fleets. In aquaculture the lifting of price-setting and investment regulations in the early 1990s were key to the industry’s expansion. Furthermore, there remains considerable potential for Norway to develop rural tourism given its many dramatic and unusual landscapes (such as the fjords and arctic landscapes).

Norwegian agricultural support also now needs substantial reform. Though the current government has taken some welcome steps, a lot more should be done. Import-tariffs should be reduced, which would pare back the implicit subsidy that households pay through food prices. Also direct payments for producing should be lowered and linkages between subsidies and cultural and environmental goals strengthened. The agricultural reform should be central to a wider rural paradigm that is less focused on preservation of the status quo through subsidy and more channeled towards encouraging change that helps rural communities thrive in the long run.

References:

OECD, Economic Survey of Norway, January 2016, OECD Publishing.

Hemmings, P, (2016), “Policy Challenges for Agriculture and Rural Areas in Norway”, OECD Economics Department Working Papers, No. 1286, April 2016.


Public spending efficiency in the OECD

by Richard Dutu and Patrizio Sicari, OECD Economics Department

The falling ratios of workers to retirees in many OECD countries are jeopardising their old-age pension systems. Similarly, the rise in life expectancy and chronic medical conditions are pushing up health expenditures. Demand for education is also high, as productivity gains will need an increasingly educated workforce to be sustained.

While demand for public expenditure keeps rising, government spending in OECD economies was already at a record high of 45% of GDP in 2014, up from 35% in 1970 and 24% in 1937 (Tanzi and Schuknecht, 2000). Meeting those demands while keeping public spending under control will require improving public spending efficiency. But how efficient is public spending in the OECD exactly?

Efficiency in public expenditure can be measured via Data Envelopment Analysis (DEA) whereby a frontier of best-practice countries is constructed based on input-output data. Distance from the frontier measures potential gains in terms of: 1) increasing output holding inputs constant (output efficiency); or 2) reducing inputs holding output constant (input efficiency). In this post we focus on output efficiency. Input efficiency analysis, and more detailed results, can be found in Dutu and Sicari (2016).

The calculation of efficiency scores for health care is done using life expectancy at birth as a proxy of the health system’s outcomes, and controlling for lifestyle factors and the socio-economic environment. The results show significant room for efficiency gains (Figure, Panel A). For instance, several Eastern European countries such as Slovakia and Hungary could, in theory, raise their life expectancy significantly by simply holding their financial inputs constant while spending more efficiently. At the other end of the spectrum, countries like Japan, Switzerland and Korea are already close to the frontier and have little room for efficiency gains.

Potential efficiency gains in public spending¹, 2012

Output inefficiency, per cent
Dutu graphic
1. For specific details on the variables included in the DEA estimates, as well on specific reference periods, see Dutu and Sicari (2016).
Source: OECD calculations.

Potential gains in output efficiency in secondary education are found to be relatively larger than for health care (Panel B). After controlling for the family background, the synthetic PISA score* measuring students’ performance could on average be increased by as much as 7-8%, if per student PPP-measured spending simply followed best-practice. Similarly, significant efficiency gains are achievable in the sphere of “Public administration and general services” (Panel C), especially in Southern and Eastern European countries.

DEA analysis of public spending efficiency has its limits. It is sensitive to the size and composition of the sample, and to outliers. Moreover, important drivers of efficiency such as regulatory policies, the characteristics of tax systems or allocative efficiency are not taken into account for lack of measurability. Despite these caveats, DEA analysis provides a useful ranking of countries regarding public spending efficiency. It also highlights that there is plenty of room for efficiency gains to be reaped before further expanding public spending at the cost of having to raise the taxes to pay for it.

* Obtained by averaging the country scores across the reading, mathematics and science dimensions.

Find out more:

Tanzi V. and L. Schuknecht (2000), Public Spending in the 20th Century: A global Perspective, Cambridge University Press, New York.

Dutu, R. and P. Sicari (2016), “Public Spending Efficiency in the OECD: Benchmarking Health Care, Education and General Administration”, OECD Economics Department Working Papers, No. 1278, OECD Publishing, Paris.

OECD (2015), OECD Economic Surveys: Switzerland 2015, OECD Publishing, Paris.


The economic consequences of Brexit: A taxing decision

by Rafal Kierzenkowski,
Head of the UK Desk, OECD Economics Department

Membership of the European Union has contributed to the economic prosperity of the United Kingdom. Uncertainty about the outcome of the referendum has already started to weaken growth in the United Kingdom. A UK exit (Brexit) would be a major negative shock to the UK economy, with economic fallout in the rest of the OECD, particularly other European countries. In some respects, Brexit would be akin to a tax on GDP, imposing a persistent and rising cost on the economy that would not be incurred if the UK remained in the EU. The shock would be transmitted through several channels that would change depending on the time horizon.

In the near term, the UK economy would be hit by tighter financial conditions and weaker confidence and, after formal exit from the European Union, higher trade barriers and an early impact of restrictions on labour mobility. By 2020, GDP would be over 3% smaller than otherwise (with continued EU membership), equivalent to a cost per household of GBP 2200 (in today’s prices).

In the longer term, structural impacts would take hold through the channels of capital, immigration and lower technical progress. In particular, labour productivity would be held back by a drop in foreign direct investment and a smaller pool of skills. The extent of foregone GDP would increase over time.

Impact of Brexit on the United Kingdom through channels and over time

Difference in real GDP relative to the UK staying in the EU

brexit-overview-ECO

Source: OECD calculations.

By 2030, in a central scenario GDP would be over 5% lower than otherwise – with the cost of Brexit  equivalent to GBP 3200 per household (in today’s prices). The effects would be even larger in a more pessimistic scenario and remain negative even in the optimistic scenario. Brexit would also hold back GDP in other European economies, particularly in the near term resulting from heightened uncertainty would create about the future of Europe. In contrast, continued UK membership in the European Union and further reforms of the Single Market would enhance living standards on both sides of the Channel.

Related material

Read the full OECD report


Improving local infrastructure investments in Poland

by Antoine Goujard, Economist, Poland Desk,
OECD Economics Department

Over the last decade, Poland has significantly upgraded its infrastructure network, and public investment has risen rapidly (Panel A). However, bottlenecks still weigh on productivity growth and environmental and health outcomes, and the perceived quality of transport and energy infrastructure remains lower than in most OECD countries (Panels B and C). The EU 2014-20 programming period is an opportunity to improve the management of investment, as structural and cohesion funds that assist in the financing of numerous infrastructure projects are set to reach nearly 3% of 2013 GDP per year (Panel D).

Public investment and EU funds

poland2

1. Gross general government fixed capital formation.
2. Index from the lowest perceived quality (0) to the highest (7).
Source: OECD (2015), National Accounts Database; World Economic Forum (2015), The Global Competitiveness Report 2014-15; European Commission (2014), Summary of the Partnership Agreement for Poland, 2014-20.

Sub-central governments were responsible for about half of total public investment in 2014, above the OECD average and most other Central and Eastern European countries. As in other OECD countries, municipalities design legally binding local land-use plans. However, the quality of land administration appears relatively low (World Bank, 2015), and around 70% of the municipal territory lacks local spatial plans. Local governments have far-reaching responsibilities in transport and energy policies, but the quality of investment outcomes still needs to improve (OECD, 2015 and 2016).

The decentralisation of the allocation of EU funds over 2014-20 will give an even more prominent role to local governments, and there is a need to increase their administrative capacity, accountability and resources. The OECD (2016) analysis highlights three main areas of reforms:

  1. Strengthening national and local planning.

The authorities have done much to adopt general investment strategies across all levels of governments. However, they are relatively recent and will need regular updates. At the metropolitan level, administrative fragmentation has partly obstructed effective land use planning and transport investments, thereby increasing urban-sprawl and congestion, and reducing a city’s attractiveness for individuals and businesses. A welcome recent law foresees the creation of metropolitan governance associations in 2016, notably for transport and spatial planning, but these will remain voluntary. New mechanisms under the 2014-20 EU perspective would also strengthen coordination in infrastructure delivery. In addition, before the recent elections, a draft law was intended to reduce barriers for municipalities to develop local land use plans, and this reform needs to be resumed swiftly.

  1. Developing effective collaboration across levels of governments and improving public procurement practices.

As many local governments lack in-house capacity, and sometimes the financial resources, to conduct procedures and hire external advisors, relying more on central government assistance for project management would improve infrastructure delivery. Creating a central public-private partnership (PPP) agency, as currently discussed, and developing joint purchasing offices and integrated e-procurement procedures would also be good moves, as local governments have been responsible for most PPP projects and procurement procedures combining several public buyers have been relatively infrequent.

  1. Ensuring long-term infrastructure financing.

Funding of local infrastructure management agencies is provided through central-government transfers fixed annually in the budget process, without reliable long-term commitments. The authorities should pursue reforms of public infrastructure pricing to ensure that long-term costs, including environmental and health externalities, are fully recovered. Road pricing could be expanded to ensure effective competition between transport modes and encourage green investments. In particular, the current legislative framework prevents local authorities from setting congestion fees or urban tolls, while such measures may be especially suitable for addressing congestion and local environmental impacts.

Find out more:

OECD (2015), OECD Environmental Performance Reviews: Poland 2015, OECD Publishing.

OECD (2016), OECD Economic Surveys: Poland 2016, OECD Publishing, Paris.

World Bank (2015), Doing Business 2016: Measuring Regulatory Quality and Efficiency, The World Bank.


Vocational education after transition in Poland

by Nicola Brandt, Head of Poland Desk,
OECD Economics Department

Adapting vocational education to the needs of a market economy has been a challenge in Poland as in other transition countries of Central and Eastern Europe. Average educational attainment and literacy rates were relatively high and vocational education was strong in Poland, when the economic transformation set in. Yet, competencies taught in vocational schools were often specific to enterprises to which they were attached, many of which disappeared.

Meanwhile, it took vocational schools time to establish links to newly created firms, and the process of developing high-quality training in management, IT and other advanced technologies is still ongoing.  Rote learning was widespread, and skills that help people adapt to new circumstances, such as critical thinking, creativity and leadership, were long neglected. Programmes on offer have not always been adapted to labour market needs, leading to shortages of workers in some areas and a surplus in others. As a result, the reputation of vocational education suffered. During the transition young people abandoned basic vocational education in large numbers (Panel A), while a tertiary education boom set in.

Vocational education lost ground during the transition

poland1

1. The data are based solely on Flanders for Belgium and on England and Northern Ireland for the United Kingdom.
2. Mean reading score for 16 year-old students of Polish technical schools (Panel A) from an optional national study for the first grade of upper secondary  school (16 year-olds) complementing PISA and mean PIAAC literacy proficiency score for Polish adults having attended technical schools (Panel B).
3. Mean reading score for 16 year-old students of Polish basic vocational education (Panel A) from an optional national study for the first grade of upper secondary school (16 year-olds) complementing PISA and mean PIAAC literacy proficiency score for Polish adults having attended basic vocational education (Panel B).
4. Mean PIAAC literacy proficiency score for adults with less than upper secondary education.
Source: GUS (2014), Education in the 2013/2014 School Year; OECD (2013), OECD Skills Outlook 2013 Database and OECD calculations.

The government has done much to adapt vocational schools to the needs of the market economy. Since 2012 curricula have been based on learning outcomes rather than on a narrow description of subject content. This has given schools more autonomy to adapt their programmes, including in collaboration with employers.  There is now more emphasis on general competencies, such as basic skills, reasoning, problem-solving and teamwork, and the programmes also include training on setting up a business. The government launched an image campaign recently, and vocational education has started to re-gain some ground as shortages of workers with intermediate skills have become apparent.

But challenges remain. Many weak students are concentrated in basic vocational schools as evidenced by their low literacy scores in the OECD’s PISA test (Panels B and C). Helping them level their skills requires particularly qualified teachers. Offering interesting pay and career opportunities at basic vocational schools would be one option to attract such teachers. While around 65% of students now combine study and work in firms – a considerable increase from earlier years –  the rest still receive their practical training in workshops set up for training purposes. The challenge is to engage Poland’s many small firms to offer work placements and contribute to the development of programmes to ensure that they are relevant for their needs.

Find out more:

OECD (2016), OECD Economic Surveys: Poland 2016”, OECD Publishing.

Mertaugh, M. and E. Hanushek (2005), “ Education and training”, in Nicholas Barr (ed.), Labor Markets and Social Policy in Central and Eastern Europe: The Accession and Beyond, The World Bank, Washington, DC, pp. 207-51.

Nešperová, A. (2000), Employment and labour market policies in transition economies, International Labour Organization, Geneva.