Uncertainty: A persistent drag on trade

By Catherine MacLeod and Elena Rusticelli, OECD Economics Department.

Global trade growth has been surprisingly robust in 2025, boosted by strong demand in new AI-related investment and intense front-loading of activity ahead of new tariff increases, as shown in the latest OECD Economic Outlook. However, at the same time, trade policy uncertainty has risen and without concerted efforts to mitigate it, trade growth may be much lower than otherwise over the next three years.

Uncertainty about trade policy has risen markedly recently, with a peak in April following the announced increase in US bilateral tariffs on all its trading partners that month. Although uncertainty has subsequently drifted lower, it still remains elevated by past standards in many countries (Figure 1).

It is likely that trade policy uncertainty will decrease international trade. Prolonged economic uncertainty is already known to discourage long-term investment (OECD, 2025b) and cause households to delay consumption. Several studies have shown a sizeable decrease in international trade in the nine to 12 months period following a trade policy uncertainty episode (Caldara et al., 2019; Sampognaro, 2025). Nonetheless, in the very short term, uncertainty could provide an incentive for firms to increase imports immediately before anticipated, though unpredictable, costly policy changes. This was a factor behind the 38% annualised rise in US imports in the first quarter of 2025 (OECD, 2025a).

Figure 1. Uncertainty around trade policy remains globally high

Trade policy uncertainty indices

Note: All series shown until October 2025.
Source: Caldara, et al. (2019); Arbatli, et al. (2022); Davis, et al. (2019).

Persistent uncertainty will lower trade

To explore these effects, the impact of trade policy uncertainty on global trade volumes was estimated using a panel vector autoregression (VAR) model with quarterly data for 56 countries – 33 developed economies and 23 emerging market economies – over the period 2017-2025. The model includes the newspaper-based global trade policy uncertainty index of Caldara et al. (2019).

The results from a trade uncertainty shock are shown in Figure 2. Initially, there is a small rise in imports, which is consistent with possible front-loading. A similar pattern is apparent in investment, which again may stem from a wish to bring forward large, planned expenditures ahead of future trade policy changes.  However, over time trade policy uncertainty shocks are associated with lower trade, as well as lower consumption and investment. The downside impact of a trade policy uncertainty shock is estimated to peak after one year, with merchandise import growth being reduced by 4.2 percentage points.

Figure 2. Trade uncertainty is accompanied by short-term front-loading effects

Impact of uncertainty on real imports, investment and consumption growth
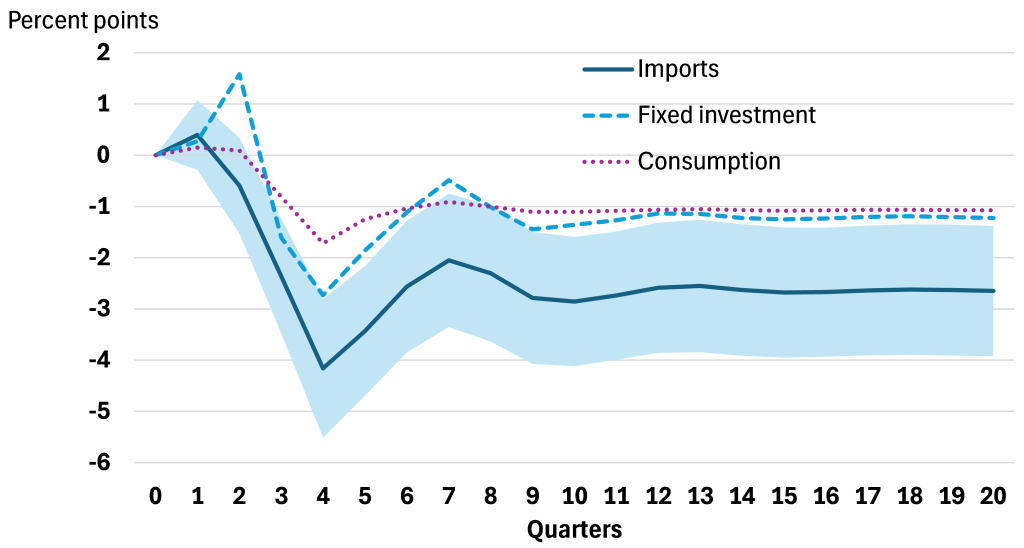
Note: The figure compares the estimated cumulative impact of a one standard deviation increase in the trade policy uncertainty index on the quarterly growth rate of merchandise import volumes, investment, and household plus government consumption volumes computed across 33 advanced countries and 23 emerging market economies. The shaded area depicts the 90% confidence band around the estimates. The dynamic panel VAR model is estimated using a generalised method of moments approach over 2017Q1-2025Q2 and it includes four lags of all variables.
Source: OECD Economic Outlook 118 database; OECD calculations.

Given the wide range of estimates from existing studies of the impacts of trade policy uncertainty, a number of checks were conducted to assess the robustness of these findings. First, the findings are robust even if data from 2024 and 2025 are excluded. Second, a related model using nominal bilateral trade amongst the G20 countries also yielded broadly similar results, albeit with larger negative effects on trade, consistent with the literature (Nana et al., 2025). Finally, the results were found to be robust to using an alternative text-based measure of uncertainty, based on analyst reports, with similar, although not identical, patterns, and without front-loading effects.  

Import tariff announcements amplify uncertainty damage

Announcements of policy changes – even if they are restrictive – could mitigate uncertainty by making policy clear and reducing speculation, or they could add to the trade inhibiting effects of uncertainty by increasing the expected probability of negative trade policy outcomes and expected losses (Handley and Limão, 2022). To test this, we added the number of products affected by an import tariff at the date of announcement as a separate variable in the model. Global merchandise import growth is found to be reduced by an additional one and a half percentage points after 1 year following an uncertainty shock and by two percentage points after 3 years (Figure 3, Panel A).

Finally, there is some evidence that emerging market economies have a higher sensitivity to trade policy uncertainty than advanced economies (Figure 3, Panel B). One possible factor behind this is that several countries in the emerging markets sample are manufacturing hubs, with a sizeable share of imports (foreign value added) in their manufactured exports. Trade in such economies is likely to be particularly sensitive to uncertainty (Nana et al., 2025).

Rules-based trade policies would help address uncertainty shocks

The harmful effects of trade policy uncertainty are occurring against a backdrop of elevated policy uncertainty more generally. This negative impact is likely to have been exacerbated this year by the large number of products and countries potentially exposed to trade policy changes. As stressed in the latest OECD Economic Outlook enhanced international cooperation to bolster and ensure rules-based, fair, trade policies would minimise trade-related uncertainty and likely support trade and investment.

Figure 3. Trade uncertainty has heterogeneous effects across countries and products
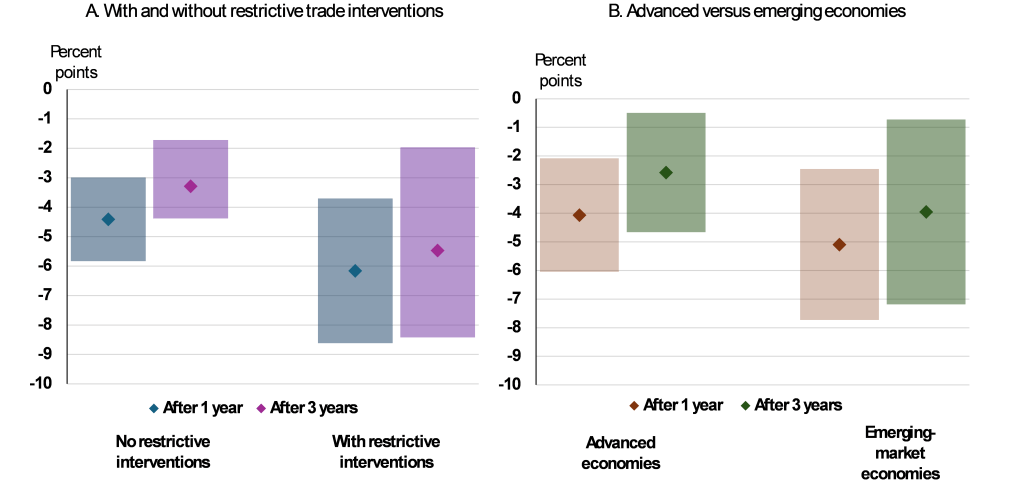
Note: Panel A compares the estimated cumulative impact of a one standard deviation increase in the trade policy uncertainty index on the quarterly growth rate of merchandise import volume with and without accounting for harmful trade policy interventions proxied by the number of imported products affected by a tariff at announcement date. Panel B compares the estimated impact on merchandise import volumes separately for advanced countries and emerging-market economies. Real investment and consumption have been replaced by the industrial production index to enable the inclusion of China in the country sample. The shaded area depicts the 90% confidence band around the estimates.
Source: OECD Economic Outlook 118 database; Global Trade Alert Data Center; OECD calculations.

References

Arbatli Saxegaard, E., S. Davis, A. Ito and N. Miake (2022) “Policy uncertainty in Japan”, Journal of the Japanese and International Economies, Volume 64.

Caldara, D., M. Iacoviello, P. Molligo, A. Prestipino and A. Raffo (2019), “Does Trade Policy Uncertainty Affect Global Econmic Activity?” FEDS Notes September 4, Board of Governors, Federal Reserve System.

Davis, S., L. Dingqian and S. Xuguang (2019), “Economic Policy Uncertainty in China Since 1949: The View from Mainland Newspapers”, Fourth Annual IMF-Atlanta Fed Research Workshop on China’s Economy.

Handley, K. and N. Limão (2022), “Trade Policy Uncertainty,” NBER Working Paper 29672.

Nana, I., R. Ouedraogo, and J.T. Sampawende (2025), “The heterogenous effects of uncertainty on trade”, IMF Working paper, No.139.

OECD (2025a), OECD Economic Outlook, Volume 2025 Issue 2: Resilient Growth but with Increasing Fragilities, OECD Publishing, Paris, https://doi.org/10.1787/9f653ca1-en.

OECD (2025b), OECD Economic Outlook, Volume 2025 Issue 1: Tackling Uncertainty, Reviving Growth, OECD Publishing, Paris, https://doi.org/10.1787/83363382-en.

Sampognaro, R. (2025), “Regardless of the outcome, uncertainty in trade policy will have significant effects on global trade”, OFCE blog, April 2025.



Harnessing the Wisdom of Crowds to Assess Recession Risks in OECD Countries

by Thomas Chalaux, Dave Turner and Steven Cassimon, OECD Economics Department.

Macroeconomic forecasters have struggled to reliably pinpoint the precise timing of business cycle turning points and future recessions. Recognising this inherent difficulty, a growing body of work has shifted focus to probabilistic models, aiming to assess the risk of a future downturn rather than attempting exact prediction.

Researchers from major institutions, including the IMF, ECB, and the Bank of England, have lauded Random Forests (RF), or closely related methods, as the most consistently effective machine-learning method for identifying crisis episodes, often deemed superior to traditional probit/logit modelling [Bluwstein et al. (2020), Hellwig (2021), IMF (2021), Jarmulska (2020)]. However, the OECD Working Paper, Harnessing the wisdom of crowds to assess recession risks in OECD countries” (Chalaux et al, 2025), challenges this prevailing view, demonstrating that a customised algorithm based on enhanced probit modelling can match, and in some key areas surpass, the performance of Random Forests when predicting recession episodes across 20 OECD countries.

The key to this revitalisation of probit modelling lies in embracing the concept of ensemble forecasting, the “wisdom of crowds.”

The Doombot Algorithm and the Power of Averaging

The working paper introduces the latest version of a highly customised algorithm known as Doombot. While Random Forests achieve superior performance by averaging predictions across many decision trees, the newest Doombot algorithm mimics this strategy by averaging predictions from many well-fitting probit equations. This feature, termed the “wisdom of crowds,” boosts the algorithm’s out-of-sample predictive capability. The benefit of averaging is widely acknowledged in the broader forecasting literature, where simple averages often outperform more complex aggregation schemes.

Doombot’s design features substantial customisation. It employs a “brute force” method to test a large number of combinations of explanatory variables. To ensure the resulting predictions are credible and comprehensible to external audiences, the algorithm retains only well-fitting equations with statistically significant variables and imposes sign restrictions to maintain a coherent and consistent economic narrative across countries and forecast horizons.

An advantage highlighted in the paper is that Doombot is built on country-specific models. This contrasts with Random Forests, which performs best when pooling countries to estimate a single common model. The authors argue that country-specific models inherently produce more intuitively appealing properties, enhancing credibility when communicating with stakeholders.

The Predictive “Horse Race”

The OECD research compared the out-of-sample performance of five methods: Probit employing the “Wisdom of Crowds” [hereafter “Probit (WoC)”], the single-equation Probit, Random Forests estimated for individual countries (IRF), Pooled Random Forests (PRF), and LASSO.

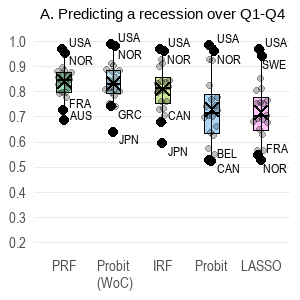
The results show that Probit (WoC) successfully matches the performance of Random Forest methods in rolling out-of-sample quarterly predictions over a two-year horizon, including the turbulent period of the Global Financial Crisis (GFC) (Figure 1).  All methods show a much better performance in predicting a recession in the next 4 quarters compared to the subsequent 4 quarters (comparing panels A and B of Figure 1).  However, the application of the “Wisdom of Crowds” feature clearly improved the performance of the probit model compared to its single-equation predecessor at all horizons.

Disadvantages of Pooling

While pooling Random Forests (PRF) shows a superior performance to estimation of Random Forests using individual country models (IRF) on some conventional metrics like the median Area-Under-the-Curve score (AUC), the study highlights some disadvantages associated with pooling country data:

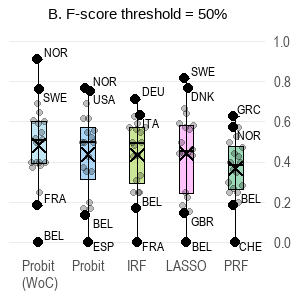
  1. Low Probability Ceiling: PRF rarely generates high recession probabilities that exceed 50%. This makes it difficult to ascertain when a recession is “more likely than not“. When tested using a higher F-score threshold of 50% rather than a low threshold of 15%, PRF dropped from a top performer to the last ranked method (Figure 2), demonstrating its poor ability to distinguish highly elevated risk cases.
  2. High Correlation: PRF predictions are typically highly correlated across countries. This approach may struggle to identify isolated recession risks for single countries or specific groups, such as the concentrated recession risk among European countries observed in 2022 and 2023. The more country-specific Probit (WoC) model successfully picked up a significantly higher differential risk for European countries during this period.


Figure 1. Distribution of out-of-sample AUC scores across 20 countries for 5 methods

Note: The box and whiskers chart summarise the distribution of Area-Under-the-Curve (AUC) scores in the out-of-sample tests for 20 OECD countries: the box shows the interquartile range, the horizontal line is the median; the cross is the average; and the whiskers are the extreme scores. The AUC score is a common measure of evaluating machine-learning models because it shows the accuracy of a model in predicting a binary outcome over different probability thresholds as to whether the occurrence of an event (here a recession) has been predicted or not. The AUC score ranges from 0 to 1, with a higher value indicating better performance. An AUC of 0.5 means the model is no better than chance at distinguishing recession from non-recession quarters, indicating it is essentially uninformative. The ordering of the methods on the x-axis reflects the ranking of their median country scores.


Figure 2. Distribution of F-scores across 20 countries with various thresholds over Q1-Q8

Note: The box and whiskers chart summarise the distribution of F-scores in the out-of-sample tests for 20 OECD countries: the box shows the interquartile range, the horizontal line is the median; the cross is the average; and the whiskers are the extreme scores.  The threshold for the F-score test (15% in panel A, 50% in panel B) reflects the threshold at which a probability prediction is classified as a recession or non-recession. The ordering of the methods on the x-axis reflects the ranking of their median country scores.

What Drives a Recession? Variables and Horizons

The robustness of this research comes from applying the same framework across 20 countries and eight consecutive quarterly horizons. This broad application confirms that the importance of explanatory variables shifts dramatically depending on the forecast horizon (Figure 3).

  • Shorter Horizons (Q1-Q2): Predictors for the immediate quarters are dominated by activity variables such as capacity utilisation, unemployment, and industrial production.
  • Longer Horizons: For horizons further out, financial cycle variables dominate, particularly credit and house prices.
  • Other Factors: Interest rates and inflation variables also make significant contributions. Consistent with previous OECD work, international or global indicators are found to be strong predictors of recession risks.

The Real-Time Data Innovation

Another important feature of this paper is the rigorous use of real-real time data for GDP in out-of-sample exercises. This means the estimation uses the precise vintage of data that would have been available at the point in time the predictions were made, rather than the most recent, often-revised data vintage (quasi-real time data).

The distinction is important because revisions to GDP data can be substantial. The study found that while using the latest vintage of data generally results in a slight aggregate performance gain, it can influence (and likely improve) forecast performance just when it matters most, such as on the eve of the GFC. For example, using the latest data vintage for June 2008 forecasts suggested an additional seven countries had already experienced negative GDP growth in Q1 2008 compared to the data available at the time. This change alone increased the predicted overall recession probability for those seven countries by 15 to 30 percentage points (Figure 4).

Concluding Insights

The findings of this working paper challenge the recent consensus regarding machine-learning superiority in crisis prediction. By harnessing the “wisdom of crowds”, averaging predictions from many well-fitting probit equations, the customized Probit (WoC) algorithm achieves out-of-sample performance comparable to Random Forests.

The country-specific nature of Doombot, combined with its ability to generate high probability predictions (exceeding 50%), offers practical advantages over pooled methods. Furthermore, the detailed, multi-horizon analysis confirms the critical role of financial cycle variables (credit and house prices) in predicting medium- to long-term recession risks, offering granular detail that can inform policy and forecasting. The use of real-real time data adds another layer of rigour, ensuring that forecast evaluations reflect the information environment actually available to policymakers at the time.

References

Bluwstein, K. et al. (2020), “Credit Growth, the Yield Curve and Financial Crisis Prediction: Evidence from a Machine Learning Approach” , Bank of England Working Paper No. 848, January, https://doi.org/10.1016/j.jinteco.2023.103773.

Chalaux, T., D. Turner and S. Cassimon (2025), “Harnessing the wisdom of crowds to assess recession risks in OECD countries”, OECD Economics Department Working Papers, No. 1837, OECD Publishing, Paris, https://doi.org/10.1787/46880adc-en.

Hellwig, K.-P. (2021), “Predicting fiscal crises: A machine learning approach”, IMF Working Papers, 150.  https://doi.org/10.5089/9781513573588.001.

IMF (2021), “How to Assess Country Risk: The Vulnerability Exercise Approach Using Machine Learning“, Technical Notes and Manuals (International Monetary Fund), TNM/21/03,  Washington, DC, https://doi.org/10.5089/9781513574219.005.

Jarmulska, B., (2020), “Random forest versus logit models: which offers better early warning of fiscal stress?”, ECB Working paper No 2408, May, doi:10.2866/214327.


Regulating smarter: OECD Economic Outlook recommendations on regulatory policy reforms

By Young-Hyun Shin, Nivetha Sivakumar and Ben Westmore, OECD Economics Department.

Regulatory policy is critical in shaping the incentives and ability for businesses to innovate and expand and supporting workers to move to the parts of the economy where their skills are needed the most. Assessing regulatory policy settings is thus important in identifying the reasons for the slowdown in labour productivity growth (Figure 1) and business dynamism in OECD economies over the past two decades, as discussed in a special chapter in the December OECD Economic Outlook. This is reinforced by new OECD estimates that highlight that the resources devoted to servicing regulatory compliance have been rising in the United States, the euro area and Australia (Andrews, Turban and Tyros, forthcoming).

But what aspects of regulatory policy need to be addressed? Regulatory environments are multi-faceted and reform priorities will vary across economies. Chapter 3 of the recent OECD Economic Outlook contains country-specific regulatory policy reform priorities. These can be aggregated to give a snapshot by reform category (Figure 2) and highlight two broad types of policy priorities: firstly, the need to reassess the existing stock of regulations and make changes to the methods used to design and implement regulations and, secondly, reducing regulatory impediments in particular markets, especially product markets.

There are also some notable differences between the reform recommendations for advanced and emerging-market economies. For instance, lowering regulatory barriers to firm entry in services sectors, as well as measures that reduce the stringency of housing regulations, are most relevant in advanced economies, while lowering regulatory barriers to foreign direct investment are judged to be particularly necessary in emerging markets (Figure 3).

Delving into the identified country-specific reform recommendations in more detail:

  • The need for reforms to simplify regulatory processes is widely recommended, including for most OECD countries. Efforts to streamline regulatory processes for business registration are judged to be necessary in many countries, including in Argentina, Brazil, Bulgaria, China, Colombia, Estonia, Hungary, Iceland, Ireland, Israel, Japan, Mexico, Norway, Poland, Peru, Romania, the Slovak Republic and Slovenia. In addition, harmonising regulations across levels of government would simplify the regulatory framework in Australia, Germany, India and Switzerland.
  • Institutional arrangements for regulatory design and oversight need to be improved in several countries, including through more rigorous use of evaluations of regulations in the euro area, China, Czechia and Denmark. In China, greater consumer protection is also needed along with better institutional oversight of regulations. Initiatives to improve regulatory enforcement are also recommended in some other emerging-market economies, including Argentina and Thailand.
  • Lowering regulatory barriers to product market entry is commonly needed. This is particularly the case in services sectors, such as in France where there are high barriers to entry for architects and accountants and stringent practice controls for lawyers and real estate agents. Reforms that reduce restrictions on entry to professional services would also be beneficial for growth in Austria, Belgium, Brazil, Czechia, Estonia, Ireland, Israel, Luxembourg and the Slovak Republic. There is also scope for rationalising such barriers in network sectors in some countries, including in Canada, Korea, Lithuania and the United States. Regulatory barriers to inward foreign direct investments could also be eased, including in Costa Rica, Iceland, Indonesia, Korea, Thailand and Viet Nam.
  • To help facilitate firm exit and improve business dynamism, improved insolvency regulations are recommended for several European economies, including Belgium, Hungary, Iceland, the Netherlands and Romania, as well as in South Africa and Türkiye.
  • Reforms to housing regulations are identified as a priority for several advanced economies, such as changes to spatial planning policies in Australia, the United Kingdom and the United States. However, such policies are not identified as a key priority for emerging-market economies.
  • Reducing regulatory barriers to trade, such as those arising from strict local content requirements in Brazil, unwarranted technical requirements on imports in Argentina and slow customs procedures in India, are essential to improving productivity growth. Implementing trade facilitation measures is also highlighted as a priority in other economies, including Iceland and Switzerland.

The summary highlights that smarter regulatory policy, such as reforms that simplify existing regulatory procedures and adjust regulatory design systems and enforcement, are the priority for future growth prospects. While reducing regulatory stringency is also relevant, deregulation should not be the sole focus of policymakers. Indeed, the importance of having regulations in place that effectively target market failures and social objectives, such as safety, environmental and equity concerns, should not be overlooked. Reforms should aim for regulations that serve their objectives and are administered in the most efficient way possible. In the context of an uncertain macroeconomic environment, such an approach can promote the resilience and adaptability of economies to future shocks and long-term economic growth.

References

OECD (2025), OECD Economic Outlook, Volume 2025 Issue 2: Resilient Growth but with Increasing Fragilities, OECD Publishing, Paris, https://doi.org/10.1787/9f653ca1-en

Andrews, D., S. Turban and S. Tyros (forthcoming), “Death by a thousand cuts? New evidence on regulatory compliance costs and productivity”, OECD Economics Department Working Papers.


Thailand’s fiscal crossroads: Time to act before pressures mount

Bangkok, the cover of the 2025 Thailand Economic Survey

By Jens Arnold, Charles Dennery and Philip Hemmings, OECD Economics Department

Thailand’s public debt is set to climb past 65% of GDP in 2025—up more than 25 percentage points since the pandemic and uncomfortably close to the legal ceiling of 70% (Figure 1). Such debt levels would not look particularly high in the context of OECD countries, but they do for an emerging market economy like Thailand with its comparatively low fiscal revenues. Lower revenues mean a larger share of the budget goes to servicing debt, and markets tend to be less forgiving when governments have limited fiscal room.  

At the same time, spending needs will rise over the medium term as social safety nets remain patchy amid a rapidly ageing population and climate-related challenges will require additional public resources. Therefore, putting public debt on a downward path needs to be achieved in tandem with accommodating spending pressures. The recent OECD Economic Survey of Thailand sets out how this can be done. 

Figure 1. Fiscal consolidation is needed to contain the public debt 
Note: The 2025 data is the most recent available as of October 2025. Data refer to Thailand’s fiscal year which runs from October to September. Other refers to the debt of public entities.
Source: Public Debt Management Office; International Monetary Fund; OECD calculations.

One way to reduce the public debt burden is through public-sector efficiency gains that lower costs while maintaining or even improving the quality of public services. Thailand’s National Economic and Social Development Plan ​(NESDC, 2022)​ rightly recognises shortfalls in the efficiency of government. Overlapping functions and limited collaboration within the public sector are one example, but there is also further scope for expanding digital platforms and e-government.

Raising spending efficiency alone will not suffice. Thailand will need a durable expansion of public revenues to meet rising social and development needs. Growth-enhancing public investment—in education, infrastructure and innovation—will depend on greater revenues, as will better healthcare and social protection for an ageing population. 

Expanding value-added tax (VAT) is one of the most promising ways of raising revenue capacity, as evidence suggests that this tax is relatively growth-friendly ​(Johansson, 2016)​ and currently underutilised by Thailand. Thailand introduced a VAT rate of 10% in 1992 but since the Asian financial crisis in the late 1990s a rate of 7% has remained in place. This rate is low compared to regional peers and to the OECD average of 19.2% (Figure 2). Setting the rate to 10% would be a reasonable first step towards additional revenue mobilisation, as suggested in Thailand’s latest Medium Term Fiscal Framework ​(State Fiscal Policy Committee, 2025)​. VAT revenue is also compromised by an extensive list of exemptions whose costs and benefits would warrant a careful examination.

Figure 2. Thailand’s standard VAT rate is relatively low 

Value added tax (VAT) rates in percent, 2024 

Note: The Thai standard VAT rate in the Revenue Code is 10%, but it has been reduced to 7% since 1999 by a Royal decree. 
Source: ​(OECD, 2025)​, primary source OECD Consumption Tax Trends ​(OECD, 2022)​. 

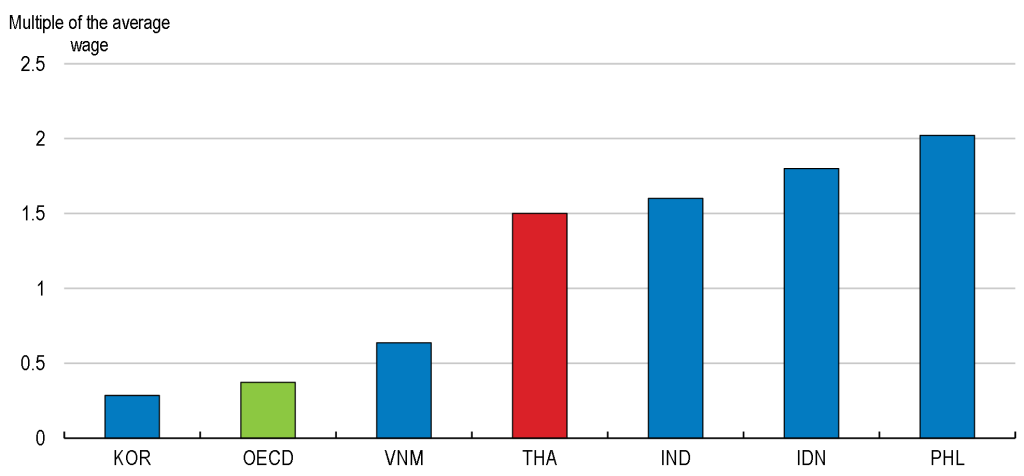
There is also scope for increasing revenues from social-security contributions and personal-income taxes. Social contributions are capped at an income level of THB 15 000 (USD 450), which is 87% of the average monthly wage in the private sector. This ceiling is considerably lower than equivalent ceilings in other Southeast Asian countries and could be increased ​(OECD, 2025)​. This would imply higher contributions from those with better incomes bringing more revenues to fund social security. Similarly, personal income tax kicks in only at roughly 1.5 times the average wage, a threshold far above those in most OECD and emerging-market countries (Figure 3). Lowering this threshold —carefully— could broaden the tax base without harming low-income households.

Figure 3. The tax threshold is relatively high 

Income threshold where single taxpayers start paying income tax  

Note: Monthly wage data is from the ILO and represents the average monthly earnings of employees. The data is for 2024 or the latest available year. Data on taxable income is sourced from the International Bureau of Fiscal Documentation (IBFD).  
Source: International Bureau of Fiscal Documentation (IBFD); International Labour Organization; OECD, Taxing wages 2023. 

Mobilising additional revenue sources can also be part of a shift away from informal, low-productivity activity towards greater formalisation. Strategies to achieve this shift include strengthening educational outcomes, improving the incentives generated by social protection schemes and streamlining business regulations, as covered in depth in the thematic chapter of the Economic Survey

Finally, stronger growth, and especially stronger productivity, would also help to make debt more sustainable. For this, the Economic Survey suggests removing restrictions to FDI, including foreign ownership restrictions in services, and creating a more level playing field between state-owned enterprises and private firms.  

With the right reforms, Thailand can maintain a strong pace of progress even amid global uncertainty. But acting now—before fiscal pressures harden—is vital to ensure that Thailand can spend on those policies that yield the highest dividend.  

For more information, please visit the OECD’s Economic Snapshot of Thailand webpage.

References

Johansson, A. (2016), “Public Finance, Economic Growth and Inequality: A Survey of the evidence”, OECD Economics Department Working Papers No. 1344, https://doi.org/10.1787/094bdaa5-en.

​NESDC (2022), The Thirteenth National Economic and Social Development Plan (2023-27)https://www.nesdc.go.th/article_attach/article_file_20230615134223.pdf. 

OECD (2025), Financing Social Protection through General Tax Revenues, Social Security Contributions and Formalisation in Thailand, OECD Publishing, Paris, https://doi.org/10.1787/b5cc1a43-en.

OECD (2022), Consumption Tax Trends 2022: VAT/GST and Excise, Core Design Features and Trends, OECD Publishing, Paris, https://doi.org/10.1787/6525a942-en.

​State Fiscal Policy Committee (2025), Medium Term Fiscal Framework Budget 2027-2030


Un sector público más digital para una América Latina más productiva

Jens Arnold, Aida Caldera, Priscilla Fialho, Paula Garda, Alberto González Pandiella, Michael Koelle, Alessandro Maravalle, Dimitris Mavridis, Claudia Ramírez y Adolfo Rodriguez-Vargas, Departamento de Economía, OCDE

La última edición de las Perspectivas Económicas de la OCDE ofrece un diagnóstico realista pero esperanzador sobre las economías latinoamericanas. Aunque el entorno global sigue siendo complejo, marcado por tensiones comerciales y geopolíticas, la región tiene oportunidades claras para fortalecer el crecimiento económico a través de las reformas estructurales. Una de las más prometedoras: la transformación digital del sector público para simplificar trámites, reducir costos y mejorar la eficiencia regulatoria.

América Latina muestra resiliencia pero con desafíos persistentes

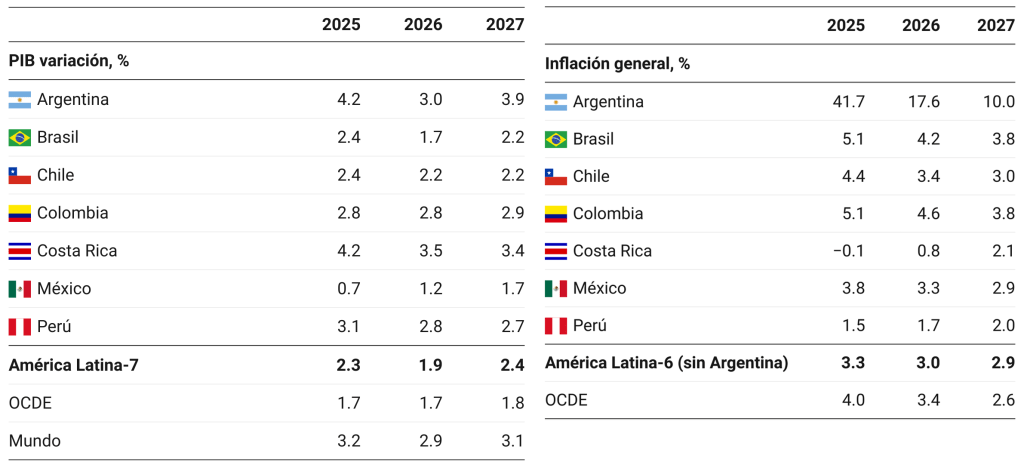
En línea con la evolución de la economía global, tras un crecimiento proyectado del 2.3% en 2025, se prevé una ligera desaceleración al 1.9% en 2026, antes de repuntar al 2.4% en 2027 en las  siete principales economías de la región. Factores como la consolidación fiscal en muchos países de la región, necesaria pero restrictiva, y una elevada incertidumbre política y económica seguirán afectando la demanda interna, la inversión y las exportaciones, principalmente en 2026.

Cuadro. Perspectivas económicas para los países de América Latina

Nota: América Latina 7 es la media ponderada por el PIB a valores de paridad del poder de compra de los 7 países en la tabla para el PIB. América Latina 6 es la media simple de los países incluidos en el cuadro para la inflación excluyendo a Argentina.
Fuente: OCDE Perspectivas Económicas No. 118, diciembre de 2025.

La inflación en los últimos meses ha sido más persistente de lo esperado. En la mayoría de los países se prevé que en 2025 la inflación se mantenga por encima de las metas de los bancos centrales, convergiendo gradualmente hacia las metas en 2026 y 2027. Excepciones son Perú, donde la inflación está controlada hace un año, Costa Rica, que mantiene una inflación negativa en 2025, y Argentina, en donde la elevada inflación seguirá reduciéndose gracias a una combinación de consolidación fiscal y política monetaria restrictiva. La mayoría de los países tendría que mantener una política monetaria prudente basada en datos y orientada a devolver la inflación a sus metas sin generar presiones innecesarias sobre la actividad. En este contexto, los bancos centrales deben mantenerse atentos a la evolución del comercio global, las condiciones financieras, las expectativas de inflación y la orientación de la política fiscal. Al mismo tiempo, será clave que la consolidación fiscal siga avanzando con medidas concretas y más ambiciosas, dada la elevada deuda pública y la necesidad de asegurar su sustentabilidad en un entorno externo incierto y con elevados costos de financiamiento.

Los riesgos económicos están sesgados a la baja:

  • Incertidumbre global derivada de tensiones comerciales y geopolíticas, junto con la incertidumbre política en algunos países de la región asociada al ciclo electoral u otros factores internos, podría afectar negativamente a la inversión y las exportaciones, con repercusiones adversas sobre el crecimiento económico.
  • Desviaciones fiscales podrían subir el coste del servicio de la deuda, socavar la confianza, frenar la inversión y generar presiones inflacionarias.
  • Persistencias inflacionarias limitarían el espacio para reducir las tasas de interés, afectando las condiciones financieras y desincentivando el consumo y la inversión.

Sin embargo, también hay riesgos al alza: una reducción de las barreras comerciales o redirección del comercio hacia la región y una menor incertidumbre geopolítica podrían fortalecer el consumo, la inversión y el consumo.

Aprovechar la revolución digital para avanzar hacia marcos regulatorios más simples y eficientes

El capítulo especial de las perspectivas económicas subraya la necesidad de avanzar hacia marcos regulatorios más simples y eficientes. En este contexto, la transformación digital del sector público emerge como una herramienta clave para facilitar esta simplificación regulatoria, reduciendo la carga administrativa y modernizando procesos normativos. Una implementación eficiente de la gobernanza digital representa una gran oportunidad para América Latina, tanto para mejorar la eficiencia del gasto público y la transparencia, como mejorar el crecimiento económico al impulsar la productividad de las empresas, históricamente baja. Un gobierno digital bien implementado permite:

  • Ofrecer servicios públicos más rápidos, sencillos e inclusivos.
  • Reducir costos administrativos y simplificar trámites gubernamentales, mejorando el entorno de negocios, lo que cual se puede traducir en ganancias significativas de eficiencia al reducir costos y tiempos de espera, ampliar la cobertura y fomentar la competitividad de las empresas. 
  • Fortalecer la transparencia y rendición de cuentas facilitando el acceso ciudadano a la información, la detección de irregularidades, contribuyendo a prevenir el fraude.

Los indicadores de la OCDE muestran que países como Colombia y Brasil lideran el gobierno digital en la región. Colombia ha avanzado significativamente con la puesta en marcha de plataformas en línea, aplicaciones móviles para trámites gubernamentales y datos abiertos, mientras que Brasil ha sido pionero en servicios como el voto electrónico, las declaraciones de impuestos digitales, y más recientemente la centralización del acceso a cientos de servicios y la identificación digital. No obstante, muchos otros países siguen rezagados (Figure 1).

¿Qué se necesita para una transformación digital exitosa del sector público?

Para lograr una transformación digital exitosa en el sector público, los gobiernos de América Latina aún enfrentan retos importantes y requieren redoblar esfuerzos para lograr:

  • Infraestructura digital robusta con cobertura suficiente y sistemas interoperables entre niveles de gobierno para garantizar que todos puedan acceder a los servicios digitales.
  • Coordinación efectiva entre gobiernos centrales y locales. En muchos países de la región, existe una gran brecha en el uso de herramientas digitales entre las instituciones públicas centrales y las locales.
  • Autoridad política clara para liderar la transformación.  El reciente impulso a la agenda digital en México, incluida la creación de la Agencia de Transformación Digital y Tecnológica, es un ejemplo destacado de cómo dotar de liderazgo institucional a estos procesos
  • Regulación ágil y flexible para tecnologías emergentes como la inteligencia artificial.
  • Confianza ciudadana. Garantizar la privacidad y la seguridad de los datos es esencial para que los ciudadanos confíen y utilicen los servicios públicos digitales, aprovechando así al máximo el potencial de la digitalización. Además, publicar datos en formatos reutilizables facilitaría el acceso a información pública completa y confiable, mientras que impulsar la colaboración entre gobiernos, sociedad civil, universidades y empresas, aceleraría la experimentación y mejoraría el impacto de la gobernanza digital.

Casos exitosos como el de Estonia demuestran que una gobernanza digital bien implementada puede generar ahorros al gobierno equivalentes al 2 % del PIB anual.

Digitalizar para transformar

La digitalización del sector público no solo mejora la eficiencia del gasto público. También genera beneficios que se extienden a toda la economía, al elevar la productividad, reducir cargas administrativas para ciudadanos y empresas, facilitar la formalización y mejorar el acceso a servicios esenciales, todos desafíos de larga data en la región. Pero para que la gobernanza digital tenga legitimidad y pueda realmente desplegar todo su potencial, es necesario que todos se conviertan en “ciudadanos digitales”. Esto implica centrarse en las necesidades reales de la población y crear las condiciones para que todos tengan acceso a conexión a internet, dispositivos adecuados y las habilidades necesarias para navegar con seguridad. La transformación digital debe ser ambiciosa. Solo así la región podrá aprovechar todo su potencial y construir un futuro más próspero.

Para más información:

OECD (2025), OECD Economic Outlook, Volume 2025 Issue 2, OECD Publishing, Paris, https://doi.org/10.1787/9f653ca1-en – Reporte completo en inglés con las proyecciones macroeconómicas, los principales desafíos estructurales e información detallada por país.

Perspectivas económicas de la OCDE para países de América Latina

Información detallada por país: Argentina Brasil Chile Colombia Costa Rica | México Perú


Making Reforms Happen in Latin America: Key Insights from the IMF–OECD High-Level Conference

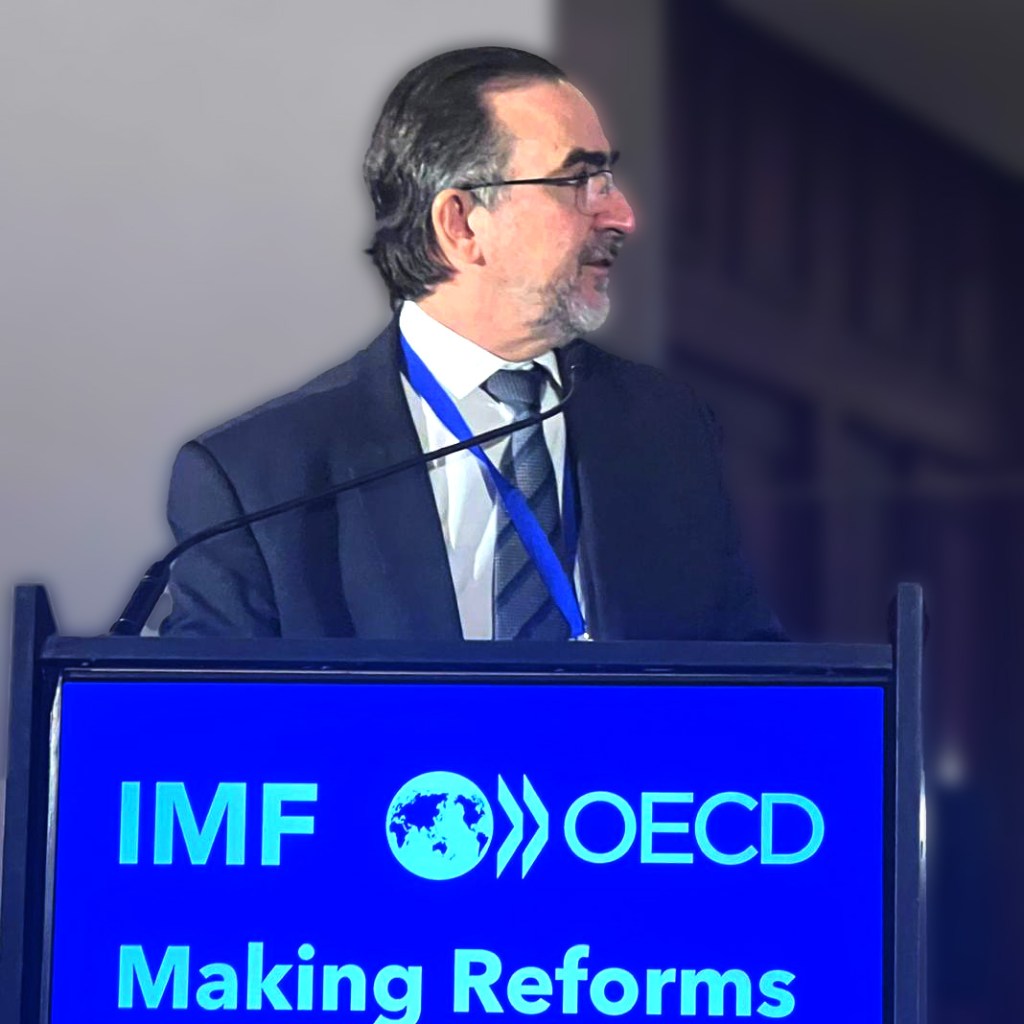
Senior policymakers, ministers, academics and experts gathered in Montevideo on 17 and 18 November for the IMF–OECD High-Level Conference “Making Reforms Happen in Latin America”, an event dedicated to discussing how to advance reforms across the region.

The event highlighted both the region’s significant achievements and the structural challenges that continue to constrain growth.

Despite meaningful progress in poverty reduction, education access and macroeconomic stability, Latin America’s GDP growth has averaged only 2.3% since 2000 among OECD members and accession countries in the region—less than half the pace of emerging Asia.

Latin America’s growth underperformance largely reflects weak productivity. Strengthening productivity and unlocking private investment will require bold, sustained structural reforms, in line with  OECD’s Economic Surveys and the Foundations for Growth and Competitiveness framework. Main take-aways of the conference were:

Labour markets: reducing informality and strengthening skills

Discussions underscored that persistent labour market challenges—high informalitygender participation gaps, and skills mismatches—remain major barriers to inclusive growth.

Speakers highlighted the need to:

  • modernise social protection financing to strengthen formalisation incentives
  • reduce non-wage labour costs, particularly for low-income workers
  • improve active labour market policies
  • better align education and training with economic transformation

Examples such as Costa Rica’s efforts to increase the supply of relevant skills  to underpin its investment strategy illustrated how coordinated policies can support better jobs and productivity gains.

Tax systems: broader bases, stronger institutions

The tax session emphasised that Latin America requires tax systems that are fairer, broader-based, and more supportive of productivity and formalisation.

Key priorities included:

  • reducing inefficient tax expenditures, particularly in VAT
  • strengthening tax administration and state capacity
  • simplifying tax systems to improve compliance and investment climate

Brazil’s recent VAT reform showed how consensus-building and predictability can make ambitious changes feasible.

Competition and regulation: a foundation for productivity

Participants stressed the need to improve competition and regulatory quality, central pillars of the OECD’s Foundations for Growth and Competitiveness flagship.

Priority areas included:

  • simplifying business creation and licensing
  • advancing digital one-stop shops
  • strengthening governance of state-owned enterprises
  • opening markets to foster private investment

The political economy of reform: building trust and long-term commitments

Across several sessions—including contributions from Andrés Velasco, Mariano Tommasi and Omar Licandro—a key message emerged: many constraints to reform are political, not technical.

Speakers highlighted the importance of:

  • capable and credible institutions
  • clear long-term strategies
  • cooperation across ministries
  • strong communication that links reforms to improved public services

Reforms are more likely to endure when supported by broad coalitions and sustained political commitment.

A shared commitment to stronger, more inclusive growth

The OECD will continue working with governments across Latin America to support the design and implementation of reforms that strengthen productivity, competitiveness and social inclusion.

Related documents

IMF-OECD Event Webpage

Opening remarks by the Secretary General of the OECD


Romper el círculo vicioso entre productividad e informalidad en América Latina: Reflexiones de la Conferencia Ministerial 2025 en Lima

Harvesting in Guatemalal

Por Paula Garda, Jens Arnold, Luca Marcolin, Departamento de Economía de la OCDE

Disponible en inglés

Alrededor la mitad de los trabajadores en América Latina se encuentra en empleos informales, una realidad que mantiene la productividad estancada y las desigualdades elevadas. Estos fueron los temas centrales de la Conferencia Ministerial sobre Productividad e Informalidad celebrada el 30 de octubre de 2025 en Lima, Perú. Ministros, altas autoridades públicas, académicos y representantes de organismos internacionales se reunieron en la conferencia ministerial “Hacia Economías Más Productivas: Enfrentando la Informalidad en América Latina”, coorganizada por el Ministerio de Economía y Finanzas de Perú, el Foro Global de Productividad y el Departamento de Economía de la OCDE y el Banco Interamericano de Desarrollo. El evento reunió a más de cien participantes para intercambiar experiencias y extraer lecciones sobre qué políticas han funcionado, cuáles no, y cómo rediseñar las reglas del juego para un crecimiento más productivo e inclusivo.

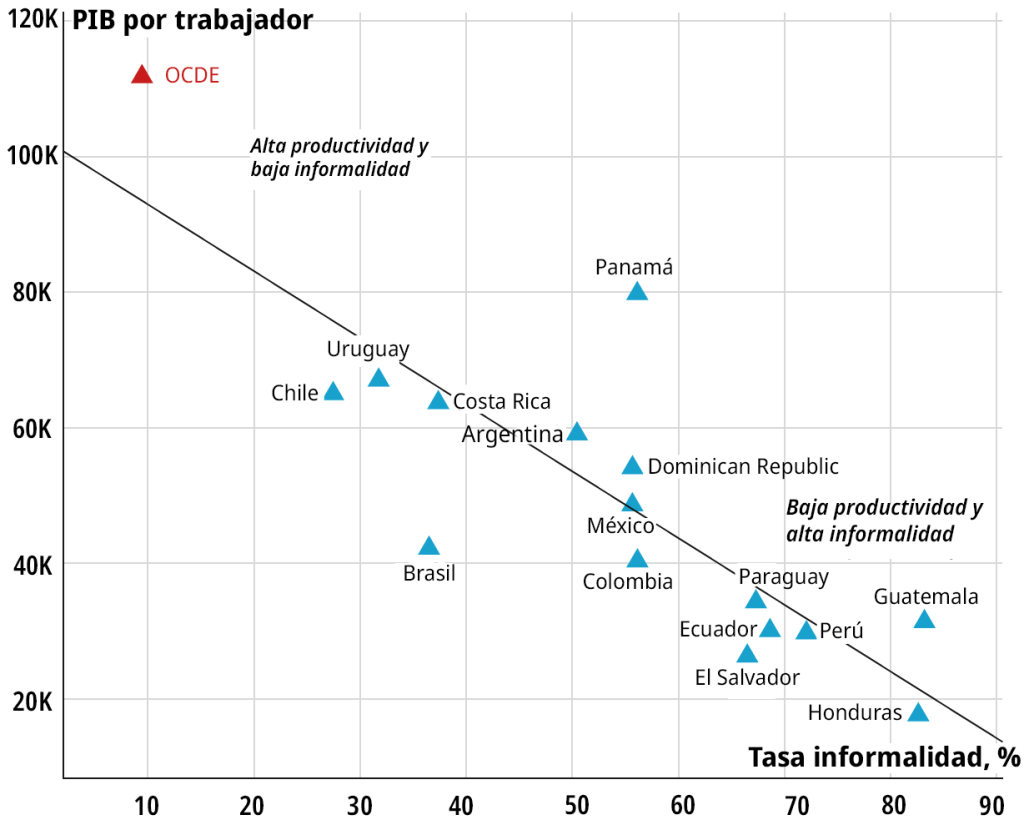
La reunión abordó una pregunta central: ¿cómo puede América Latina romper el círculo vicioso de baja productividad y alta informalidad? La figura siguiente ilustra claramente esta relación, mostrando que los países con mayores tasas de informalidad suelen ser aquellos con menor productividad laboral. Este blog resume los mensajes clave que surgieron del debate para contribuir a convertir la reflexión en decisiones de política pública.

Donde la informalidad es alta, la productividad es baja

La estructura empresarial de la región refuerza la informalidad

Las discusiones resaltaron que el desafío de productividad en América Latina no se relaciona tanto con qué produce la región, sino con cómo se produce. La estructura empresarial está fuertemente sesgada hacia las microempresas: alrededor del 60% de los trabajadores se emplea en firmas con menos de 10 empleados, frente a menos del 20% en los países de la OCDE. En América Latina, el autoempleo representa más de un tercio del empleo total, más del doble que el promedio de la OCDE. La mitad de los puestos de trabajo siguen siendo informales.

Este predominio de unidades pequeñas y de baja productividad refleja desafíos estructurales y también debilidades de política — bajo capital humano, escasa innovación, débil difusión tecnológica, limitado acceso al crédito y regulaciones laborales y empresariales mal alineadas. Estos factores alimentan y se alimentan de la informalidad, atrapando a las economías en un ciclo de baja productividad y alta desigualdad.

Abordar estas debilidades requiere una estrategia integral. A largo plazo, mejorar la calidad de la educación y el aprendizaje a lo largo de la vida es fundamental para fortalecer habilidades transversales y específicas. Las políticas de innovación deben apoyar la adopción tecnológica, la digitalización y la transferencia de conocimiento entre empresas. El acceso al financiamiento también debe ampliarse para permitir que las empresas crezcan e inviertan. A corto plazo, es necesario reducir las barreras que perpetúan la informalidad, como sistemas de seguridad social basados en contribuciones, salarios mínimos altos en relación con la productividad y, en algunos casos, regulaciones laborales rígidas. Las políticas que generan incentivos para que las empresas permanezcan pequeñas e informales, como regímenes tributarios o regulatorios diferenciados según el tamaño, deben usarse con extrema cautela.

La informalidad como síntoma de políticas disfuncionales

La informalidad es menos una causa que una consecuencia de políticas mal alineadas. Incluso en contextos de estabilidad macroeconómica, crecimiento y apertura externa, la productividad puede estancarse cuando los incentivos protegen a empresas pequeñas y de baja productividad en lugar de permitir que las más dinámicas crezcan. La experiencia de México ilustra este fenómeno: a pesar de un crecimiento sostenido y éxito exportador, la productividad agregada permaneció estancada, ya que muchas firmas poco productivas permanecieron en el mercado, y aquellas que salieron fueron reemplazadas por otras igual de poco productivas.

Regímenes tributarios y laborales simplificados dirigidos a empresas pequeñas —como monotributos u otros esquemas similares— pueden inducir a más firmas a formalizarse, pero a menudo desincentivan su crecimiento. En su lugar, los objetivos de productividad e inclusión deben avanzar conjuntamente. Para generar condiciones equitativas, el acceso a la protección social básica debe desvincularse de la situación laboral y financiarse preferentemente mediante ingresos tributarios generales en lugar de contribuciones sobre la nómina. Este cambio reduciría la diferencia de costos entre generar empleos formales e informales, permitiría a las empresas competir en igualdad de condiciones y facilitaría la movilidad laboral sin pérdida de protección.

Proteger a los trabajadores y promover la productividad pueden ir de la mano

Un nuevo libro de la OCDE, Ampliar la protección social y combatir la informalidad en América Latina, muestra que los sistemas de protección social pueden diseñarse para promover tanto la inclusión como la productividad. La clave es garantizar acceso aprotección básica independientemente de la participación en el mercado laboral formal, financiada principalmente con ingresos tributarios generales y complementada con esquemas contributivos progresivos. Estos sistemas reducen los costos laborales no salariales —especialmente para trabajadores de bajos ingresos— y disminuyen el costo adicional de la formalización, al tiempo que apoyan el crecimiento de las empresas y la asignación eficiente de recursos. Una protección social universal, portable y fiscalmente sostenible puede así fomentar la creación de empleo formal, mejorar la equidad y fortalecer la resiliencia. El costo fiscal estimado (1–4% del PIB, según el país) es manejable y probablemente pequeño en relación con los beneficios potenciales.

El libro incluye capítulos específicos para Argentina, Brasil, Chile, Colombia, Costa Rica, México y Perú, con recomendaciones y estimaciones de costo fiscal adaptadas a cada país.

Gobernanza y confianza: el motor invisible de la informalidad

Los países con menor informalidad suelen exhibir también mejor gobernanza, mayor confianza y menor captura del Estado. No es casualidad que los países más productivos sean también los más transparentes y previsibles. La erosión de la confianza en el Estado —su incapacidad para proveer bienes públicos de calidad como educación, justicia e infraestructura— debilita la legitimidad y empuja a millones hacia la informalidad. Las agendas de productividad deben integrar una dimensión de gobernanza para fomentar la inversión y el crecimiento sostenido.

Lecciones de las experiencias nacionales

La conferencia también permitió destacar esfuerzos de reforma en varios países:

  • Brasil está implementando una ambiciosa reforma tributaria que reemplazará cinco impuestos al consumo por un sistema dual de IVA con reglas armonizadas, una base más amplia y menores costos de cumplimiento. Se espera que la reforma mejore la competitividad y la productividad al eliminar distorsiones que obstaculizan el crecimiento y la inversión de las empresas.
  • Chile subrayó que la informalidad se redujo durante periodos de fuerte crecimiento y consolidación de instituciones de apoyo productivo. La Comisión Nacional de Productividad está analizando cómo sostener estos avances en un contexto de menor dinamismo económico.
  • Costa Rica está avanzando hacia convertirse en un verdadero aliado de las pequeñas empresas. Su estrategia combina simplificación regulatoria con servicios de apoyo empresarial — facilitando la formalización, el acceso al financiamiento y el fortalecimiento de capacidades de gestión en micro y pequeñas empresas.
  • Perú enfatizó la necesidad de una estrategia integral. El Plan Nacional de Competitividad y Productividad 2024–2030 busca corregir la fragmentación institucional mediante la modernización de los servicios públicos, la inversión en capital humano, la expansión del acceso al crédito y el impulso a la innovación. Además, se están llevando adelante esfuerzos para generar un shock de simplificación regulatoria con el fin de reducir cargas administrativas y facilitar la formalización y el crecimiento empresarial.

Conciliar productividad y objetivos sociales

El mensaje desde Lima es claro: abordar la informalidad no es solo deseable, es indispensable para impulsar la productividad y un crecimiento más inclusivo. Promover la productividad y

asegurar la protección social son objetivos que pueden reforzarse mutuamente. Una mejor educación y formación, sistemas tributarios que incentiven el crecimiento empresarial, instituciones laborales que faciliten la movilidad y esquemas de protección social de carácter universal pueden elevar la productividad al favorecer la reasignación de recursos, estimular la inversión en capacidades y reducir las distorsiones que mantienen a las empresas pequeñas y poco productivas.

Las reformas incrementales en la dirección correcta son importantes, pero no bastarán para romper el círculo vicioso de informalidad y baja productividad. Lograr un crecimiento sostenido e inclusivo requerirá reformas profundas y coordinadas que alineen los sistemas tributario, laboral, educativo y de protección social, y que reconstruyan la confianza necesaria para que esas reformas perduren.

Para más información:

OECD (2025), Ampliar la protección social y combatir la informalidad en América Latina, OECD Publishing, Paris, https://doi.org/10.1787/b03f2e18-es.

Foro Global de Productividad de la OCDE

Página web LAC del Departamento de Economía de la OCDE


Breaking the vicious cycle between productivity and informality in Latin America: Insights from the 2025 Ministerial Conference in Lima

Harvesting in Guatemalal

By Paula Garda, Jens Arnold, Luca Marcolin, OECD Economics Department

Available in Spanish

Around half of all workers in Latin America are in informal jobs – a reality that keeps productivity stagnant and inequality high. These were the central themes of the 2025 Ministerial Conference on Productivity and Informality held on 30 October 2025 in Lima, Peru. Ministers, senior policymakers, academics, and representatives from international organisations met for the ministerial conference “Towards Productive Economies: Confronting Informality in Latin America”, co-organised by Peru’s Ministry of Economy and Finance, the OECD Economics Department and Global Forum on Productivity and the Inter-American Development Bank. The event brought together over a hundred participants to exchange experiences and lessons about which policies have worked, which have not, and how to redesign the rules of the game for more productive and inclusive growth.

The meeting tackled a central question: how can Latin America break the vicious cycle of low productivity and high informality? The figure below captures this relationship vividly, showing that countries with higher informality rates tend to be those with lower labour productivity. This blog summarises the main messages that emerged from the discussions to help turn reflection into policy action.

Where informality is high, productivity is low

The region’s firm structure reinforces informality

Discussions highlighted that Latin America’s productivity challenge is not so much related to what the region produces, but more to how production is organised. The region’s firm structure is strikingly skewed towards microenterprises: around 60% of workers are employed in firms with fewer than 10 employees, compared with less than 20% in OECD economies. In Latin America, self-employment accounts for more than a third of total employment, more than double the OECD average. Half of all jobs remain informal.

This dominance of tiny, low-productivity units reflects structural challenges but also policy weaknesses — low human capital, limited innovation, weak technological diffusion, scarce access to credit, and poorly aligned labour and business regulations. These factors both stem from and reinforce informality, trapping economies in a cycle of low productivity and high inequality.

Addressing these weaknesses requires a comprehensive strategy: In the longer run, improving education quality and lifelong learning is key to strengthen transversal and job-specific skills, while innovation policies should support technology adoption, digitalisation, and knowledge transfer across firms. Access to finance must also be expanded so that firms can invest and scale up. In the shorter term, barriers that reinforce informality — such as contribution-based social security systems, high minimum wages relative to productivity and in some cases stringent labour regulations — should be addressed. Policies that create incentives for firms to remain informal and small, including size-dependent special tax or regulatory regimes, should be used with extreme caution.

Informality as a symptom of policy incoherence

Informality is less a cause than a consequence of poorly aligned policies. Even in contexts of macroeconomic stability, strong growth, and open markets, productivity can stagnate when incentives protect small, low-productivity firms instead of enabling dynamic ones to expand. Mexico’s experience illustrates this paradox: despite sustained growth and export success, aggregate productivity flatlined as many low-productivity firms stayed in the market, and those inefficient firms that exited were replaced by others that were just as unproductive.

Simplified tax and labour regimes targeted to small enterprises — such as monotributos or related schemes — may induce more firms to join the formal sector, but often discourage them from growing. Instead, social and productivity objectives must advance together. To create a level playing field, access to core social protection should be clearly separated from labour market status and financed preferably through general tax revenues rather than payroll-based contributions. Such a shift would align the cost of creating formal and informal jobs, allowing firms to compete on equal terms and enabling workers to move safely between jobs without losing protection.

Protecting workers and boosting productivity can go hand in hand

A new OECD report, Expanding Social Protection and Addressing Informality in Latin America, shows that social protection systems can be designed to promote both inclusion and productivity. The key is to provide access to basic protection irrespective of formal labour-market participation, financed mainly through general tax revenues, and complemented by progressive contributory schemes. Such systems can lower non-wage labour costs—especially for low-income workers— and reduce the extra cost of formalisation, while supporting firm growth and efficient resource allocation. Universal, portable, and fiscally sustainable protection can thus foster formal job creation, improve equity, and strengthen resilience. The estimated fiscal cost of such reforms (1–4% of GDP, depending on the country) is manageable and likely small relative to potential gains in inclusion, productivity, and resilience. The new OECD report also includes country chapters for Argentina, Brazil, Chile, Colombia, Costa Rica, Mexico, and Peru, providing tailored policy recommendations and fiscal assessments to guide reform implementation.

Strong governance and trust:  hidden driver of informality

Countries with lower informality often also display stronger governance, higher trust, and less evidence of state capture. It is no coincidence that the most productive countries are also the most transparent and predictable. The erosion of trust in the state — its inability to deliver quality public goods such as education, justice, and infrastructure — undermines legitimacy and pushes millions into informality. Productivity agendas should integrate a governance dimension to foster business investment and sustained growth.

Lessons from country experiences: what has worked and what hasn’t

The Lima conference was also an opportunity to highlight the reform efforts of selected countries in the region, as there are no one-size-fits-all solutions.

  • Brazil is implementing an ambitious tax reform, replacing five complex consumption taxes with a dual VAT system that will harmonise rules, broaden the base, and reduce compliance costs. This reform is expected to boost competitiveness and productivity by removing distortions that penalise firm growth and investment.
  • Chile highlighted that informality fell when growth was strong and business support institutions were consolidated. The National Productivity Commission is studying how to sustain the reduction of informality in a context of weaker growth. 
  • Costa Rica focused on becoming a true “ally of small firms.” Its strategy combines regulatory simplification with active business support — helping micro and small enterprises formalise, access financing, and strengthen managerial skills.
  • Peru stressed the need for a comprehensive approach across policy areas. The National Competitiveness and Productivity Plan 2024–2030 aims to address institutional policy fragmentation by modernising public services, investing in human capital, expanding credit access, and promoting innovation. Recent efforts also aim at generating a deregulatory shock to simplify administrative procedures and reduce the regulatory burden on firms, with the goal of facilitating formalisation and business growth.

Bridging productivity and social objectives

The message from Lima is clear: tackling informality is not just a good idea, it’s essential to foster productivity and more inclusive growth. Promoting productivity and ensuring social protection can be mutually reinforcing objectives.  Better education and training, tax systems that encourage firm growth, labour institutions that foster labour mobility, and social protection schemes that are universal can enhance productivity by supporting reallocation of both labour and capital, encouraging investment in skills, and reducing distortions that keep firms small and unproductive.

Incremental reforms in the right direction matter, but they will not be enough to break the vicious circle of informality and low productivity. Achieving sustained and inclusive growth will require deep, coordinated reforms that align tax, labour, education and social protection systems — and rebuild the trust needed to make them last.

FOR MORE INFORMATION

OECD (2025), Expanding Social Protection and Addressing Informality in Latin America, OECD Publishing, Paris, https://doi.org/10.1787/86c1fd38-en.

OECD Global Forum Productivity webpage

Economics Department LAC webpage


The hidden carbon markets: how forests can balance emissions

Positive effects of forests can offset greenhouse gas emissions
How OECD Economic Surveys reveal the drivers of deforestation, and the policy tools to stop it


By Michael Koelle, OECD Economics Department

Tropical forests cover vast swaths of land in many OECD member and accession countries, including more than 75% of Costa Rica’s territory, and over half of Brazil, Colombia, Indonesia and Peru. In these countries, emissions from land use, land use change and forestry (LULUCF), largely driven by forest loss and degradation, account for a large share of total emissions (Figure 1). In fact, land use emissions are in some cases the main driver of national emission trends. But forests can also be part of the solution, as the experiences of Finland and New Zealand, two forest-rich OECD members, teach us.

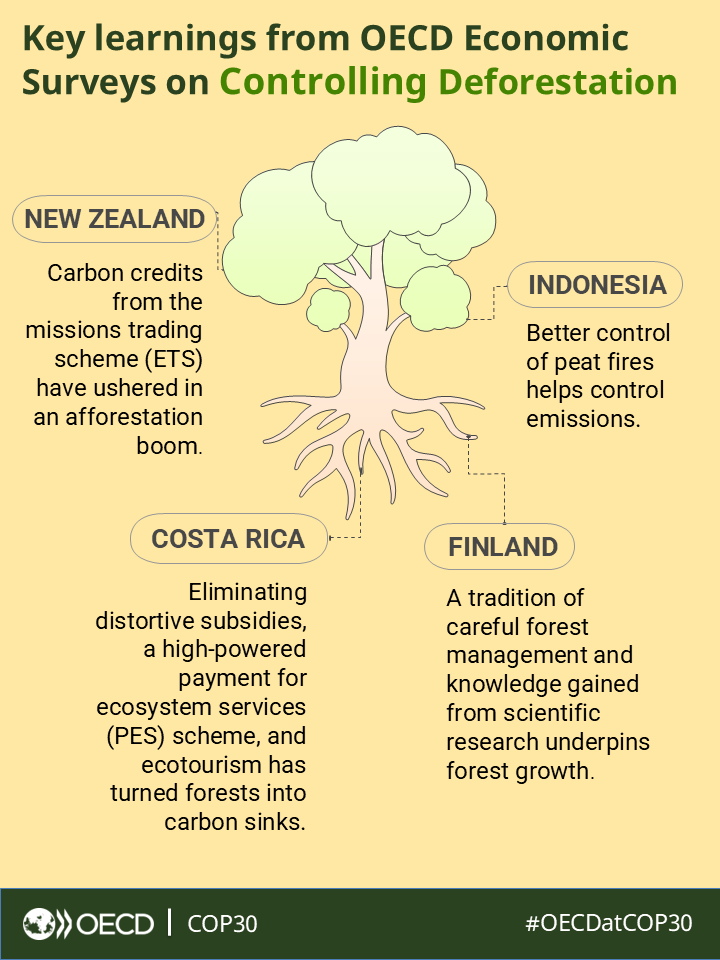
For many countries, forests are no longer just a conservation issue, they are central to climate mitigation plans. Turning forests into carbon sinks is one of the most cost-effective ways to offset hard-to-abate emissions from agriculture, transport and energy. Finland and New Zealand have long had negative LULUCF emissions thanks to sustainable forest management and afforestation. Costa Rica managed to turn around LULUCF emissions, converting its forests into a carbon sink. Indonesia aims to achieve net negative emissions from LULUCF by 2030 while in Peru and Brazil, LULUCF accounts for 65% and 38% of planned emissions reductions by 2050, respectively. The economic case for protecting forests, through stronger enforcement, property rights, sustainable agriculture, and better incentives, has never been clearer. 

Insights from Economic Surveys: What’s really driving deforestation?

What do Brazil, Costa Rica, Colombia, Finland, Indonesia, New Zealand, and Peru have in common? They are all forest-rich economies, and each has been subject of in-depth analysis in OECD Economic Surveys. These studies go beyond emissions reporting. They dig into the underlying economic drivers of deforestation and discuss what can be done to turn forests into carbon sinks. While each country has its own context, common drivers of deforestation emerge. Forest loss is rooted in economic structures and incentives, from the rapid expansion of agriculture to unclear or unenforced property rights and misalignment between individual incentives and broader societal goals. Developing forest-based activities that generate sufficient economic value while keeping forests intact is far from impossible, given that cleared forest land is often used for low-profitability activities. Moreover, as seen in Finland and New Zealand, afforestation can be one of the least costly ways to reduce net greenhouse gas emissions. Tackling deforestation therefore requires structural policy responses that make choosing forests the economically sensible option, not just environmental regulation.

Fostering sustainable agriculture

Across all countries studied the expansion of the agricultural frontier is the main driver of deforestation. In Peru, OECD research shows that 90% of all deforested land is used for agriculture and livestock-rearing (Garcia Soto and Koelle, 2025). Moreover, 75% of these lands are identified as mixed-use, where farmers combine crop growing and livestock grazing on relatively small plots. In Brazil, cattle is a major pressure; in Indonesia, palm oil plantations continue to push into forest areas. Cattle grazing was also a main driver of deforestation in Costa Rica and Colombia. Most of these activities have low productivity and profitability, making extensive use of underpriced land. As Finland’s experience shows, managing soil emissions from agriculture and forestry can become a crucial issue even when forest stocks have stabilised.

To address this, OECD Economic Surveys recommend:

  • Eliminating environmentally harmful agriculture subsidies, such as cattle ranching subsidies, which contributed to successful reforestation in Costa Rica.
  • Improving scientific knowledge of agriculture, soils and forests, which provides the basis for cost-efficient emissions reduction and carbon storage activities in Finland.
  • Boosting productivity on existing land, to reduce pressure to expand the agricultural frontier.
  • Incentivising agroforestry and sustainable land-use practices and enforcing compliance with the law and regulations tied to land rights.

Strengthening property rights

Most deforestation occurs on land that is either publicly owned or of unclear or unenforced property rights. In Peru, state lands without designated purpose are at the highest risk for deforestation. In Colombia, land rights are often unclear and ambiguous after decades of conflict and displacement of rural populations. In Brazil, a strong framework exists, but enforcement is a challenge. Indigenous communities are especially vulnerable in defending their property rights, even if formally recognised.

OECD Economic Surveys recommend:

  • Creating comprehensive land registries using modern technology.
  • Strengthening property rights and law enforcement in remote areas, including based on satellite imagery.
  • Recognising and enforcing indigenous land rights, which are linked to lower deforestation rates.

Aligning incentives with climate goals

Even with secure land rights and strong enforcement, forest conservation must make economic sense. Intact forests need to generate real value for communities and landowners. Payment for ecosystem services (PES) that provide payments to forest owners for forest preservation are an essential policy tool. Costa Rica’s model stands out: funded by an earmarked portion of fuel taxes it covers 40% of all the nation’s forests, even if financing needs to be put on a broader footing. Other countries have significantly underfunded PES systems or rely mostly on international mechanisms like REDD+ and Article 6 of the Paris Agreement that provide a global mechanism for protecting the world’s remaining forests, but implementation is slow and partly untested. The possibility to sell carbon credits through emissions trading schemes (ETS) can provide powerful incentives for reforestation. New Zealand’s pioneering inclusion of forestry in its ETS, where forest owners can earn carbon credits for capturing carbon through tree growth and must surrender credits if they deforest, provides useful lessons on how such schemes should be designed in forest-rich countries. There should be differentiation according to the emissions removal potential of different forest types, and the design should ensure a sufficiently high carbon price to incentivise carbon-efficiency in non-LULUCF sectors.

The OECD Economic Surveys call for:

  • More robust, broader, and sustainably financed payment for ecosystem services schemes and the expansion and integration of emissions trading schemes.
  • Better integration of eco-tourism, agroforestry, pisciculture and sustainable timber industry into regional economic development and planning.
  • Public incentives that complement, not contradict, private-sector logic.

Conclusion

To truly value forests, governments must embed them into national budgets, tax systems and investment frameworks. Forest conservation must be seen as a sensible investment into preserving the nation’s natural wealth and resources. The cost of these investments is often relatively modest but strong leadership and coordination is needed to ensure that institutions and incentives all work in the same direction.  At COP30 in Belem, forest rich countries have a chance to lead, not just in emission reductions, but also in showing how forests can support climate goals and the economy.

Infographic

REFERENCES

OECD Economic Surveys: Costa Rica 2025, https://doi.org/10.1787/048cf07b-en

OECD Economic Surveys: Finland 2025, https://doi.org/10.1787/985d0555-en

OECD Economic Surveys: Peru 2025, https://doi.org/10.1787/76f6eb73-en

OECD Economic Surveys: Colombia 2024, https://doi.org/10.1787/a1a22cd6-en

OECD Economic Surveys: Indonesia 2024, https://doi.org/10.1787/de87555a-en

OECD Economic Surveys: New Zealand 2024, https://doi.org/10.1787/603809f2-en

OECD Economic Surveys: Brazil 2023, https://doi.org/10.1787/a2d6acac-en

Garcia Soto and Koelle (2025): “Deforestation in Peru: Key facts and main drivers”. OECD Economics Department Working Paper No. 1846, https://doi.org/10.1787/e7786877-en


The fiscal impact of population ageing: How can we afford getting older?

By Vassiliki Koutsogeorgopoulou and Hermes Morgavi, OECD.

Populations are ageing in most countries, including emerging economies. The share of population aged 65 years and over has more than doubled between 1960 and 2022 across OECD countries on average, to around 18%, and is projected to reach 30% by 2060. To illustrate the magnitude of the demographic transition, the share of population aged 80 and over will rise even more dramatically, by almost two and half times between 2022 and 2060 (Figure 1).

Note: OECD refers to the simple average among the OECD countries, G20 emerging economies include Argentina, Brazil, China, India, Indonesia, Russia, Saudi Arabia, and South Africa. Other OECD partner countries include Bulgaria, Croatia, Romania, Peru, Morocco, Tunisia, and Egypt. The highlighted area refers to the projection period, starting in 2024. Projections are based on the “medium variant” population projections from the United Nations.
Source: United Nations World Population Prospects: The 2024 Revision.

Living longer and ageing in better health are major accomplishments, boosting people’s potential to remain active and work at a later age, participate in society and live independently for longer (Scott, 2021). However, life expectancy has increased in OECD countries in tandem with steadily declining fertility rates – currently well below replacement levels in most OECD economies (OECD, 2023). The old-age dependency ratio (defined as the number of people aged 65+ per 100 people of working age, 20-64 years old) in the OECD area has more than doubled between 1960 and 2022, as the population aged 65 and over grew at an annualised rate of 2.2% during the period, while the working-age population by merely 0.9% (United Nations World Population Prospects: The 2024 Revision).

From a fiscal perspective, population ageing can have profound consequences for the public finances, according to a recent OECD paper (Koutsogeorgopoulou and Morgavi, 2025). This is because, as previous studies have also shown (Rouzet et al., 2019; Guillemette and Turner, 2021; Guillemette and Château, 2023), age-related government spending, notably on pensions, healthcare and long-term care, exerts substantial pressure on public finances. Defined-benefit, pay-as-you-go pension systems are particularly vulnerable, as contribution rates struggle to keep up with growing retirement cohorts and longer benefit durations. While public spending on long-term care as share of GDP is generally low, it has been rising more rapidly than pension and health care expenditure over the past decades and will continue to do so, especially as the share of population 80 years and over is increasing rapidly (OECD Health database). According to OECD Long-Term Model, in the absence of corrective policy action, fiscal pressure would increase in the average OECD country by nearly 6¼ percentage points of GDP between 2024 and 2060, with ageing accounting for more than 40% (Figure 2).


Policies can help economies to adapt to population ageing, harnessing the benefits of longevity, and address the mounting fiscal pressures stemming from ageing, thereby safeguarding public finance sustainability. While the scope of demographic change varies across countries, a comprehensive policy approach is indispensable. The strategy needs to encompass measures to promote healthy ageing, including through disease prevention policies, fiscal reforms to manage the rise in age-related spending, and structural reforms to boost labour force participation of older workers and other under-represented groups.

Indicative of the large fiscal gains of comprehensive reforms, changes in retirement policies that reduce early exit pathways and link retirement ages to two-thirds of projected increases in life expectancy, in combination with labour market reforms, would lower the fiscal pressure in 2060 by around 4 percentage points of GDP for the average country, compared to a baseline no-policy change scenario, based on OECD Long-Term Model (Source: Update of (Guillemette and Château, 2023) based on OECD Economic Outlook No. 115 May 2024 database).

Policy efforts to address the fiscal implications of ageing can be complemented by measures to boost fertility and immigration. While today’s fertility rates would only raise the share of workers in the population in around two decades, ensuring continuity of support over the child’s early life course by avoiding “spending dips” is essential (OECD, 2024). Immigration can help ageing countries to address labour shortages in the short- or medium-term, though is unlikely to fully offset population ageing (André, Gal and Schief, 2024). Addressing integration challenges and enabling immigrants to reach their potential are essential.

* This blog is based on the paper by Koutsogeorgopoulou, V. and H. Morgavi (2025), “Ageing populations, their fiscal implications and policy responses”, OECD Economics Department Working Papers, No. 1844. The paper was prepared as part the work programme of the OECD Crete Centre on Population Dynamics. The Centre, established in 2023 in partnership with the Greek Government, is dedicated to advancing policy-oriented research and advisory work on demographic issues and their impact on economic prosperity: https://www.oecd.org/en/about/programmes/oecd-crete-centre-on-population-dynamics.html.

References

André, C., P. Gal and M. Schief (2024), “Enhancing productivity and growth in an ageing society: Key mechanisms and policy options”, OECD Economics Department Working Papers, No. 1807, OECD Publishing, Paris, https://doi.org/10.1787/605b0787-en.

Guillemette, Y. and J. Château (2023), “Long-term scenarios: incorporating the energy transition”, OECD Economic Policy Papers, No. 33, OECD Publishing, Paris, https://doi.org/10.1787/153ab87c-en.

Guillemette, Y. and D. Turner (2021), “The long game: Fiscal outlooks to 2060 underline need for structural reform”, OECD Economic Policy Papers, No. 29, OECD Publishing, Paris, https://doi.org/10.1787/a112307e-en.

Koutsogeorgopoulou, V. and H. Morgavi (2025), “Ageing populations, their fiscal implications and policy responses”, OECD Economics Department Working Papers, No. 1844, OECD Publishing, Paris, https://doi.org/10.1787/6aec03b3-en.

OECD (2024), “Fertility trends across the OECD: Underlying drivers and the role for policy”, in Society at a Glance 2024: OECD Social Indicators, OECD Publishing, Paris, https://doi.org/10.1787/fa367bad-en.

OECD (2023), Pensions at a Glance 2023: OECD and G20 Indicators, OECD Publishing, Paris, https://doi.org/10.1787/678055dd-en.

Rouzet, D. et al. (2019), “Fiscal challenges and inclusive growth in ageing societies”, OECD Economic Policy Papers, No. 27, OECD Publishing, Paris, https://doi.org/10.1787/c553d8d2-en.

Scott, A. (2021), “The Longevity Economy”, Health Policy, Vol 2, pp. 828–35.

Further related research

Crowe, D. et al. (2022), “Population Ageing and Government Revenue: Expected Trends and Policy Considerations to Boost Revenue”, Economics Department Working Papers, No. 1737, OECD Publishing, Paris, https://doi.org/10.1787/9ce9e8e3-en.

de Biase, P. and S. Dougherty (2023), “From local to national: Delivering and financing effective long-term care”, OECD Working Papers on Fiscal Federalism, No. 45, OECD Publishing, Paris, https://doi.org/10.1787/578b296f-en.

Morgavi, H. (2024), “Is it worth raising the normal retirement age?: A new model to estimate the employment effects”, OECD Economics Department Working Papers, No. 1823, OECD Publishing, Paris, https://doi.org/10.1787/5f2a3b40-en.

Rawdanowicz, Ł. et al. (2021), “Constraints and demands on public finances: Considerations of resilient fiscal policy”, OECD Economics Department Working Papers, No. 1694, OECD Publishing, Paris, https://doi.org/10.1787/602500be-en.