Forecasting GDP during and after the Great Recession

by Patrice Ollivaud, Economist, OECD Economics Department,  Pierre-Alain Pionnier, Head of Unit, OECD Statistics Directorate and Cyrille Schwellnus, Senior Economist, OECD Economics Department

How was it possible not to see the Great Recession of 2008-09 coming? How could economic forecasters blindly ignore financial developments? These are typical questions asked by the media in the wake of the Great Recession.

The OECD has drawn a number of lessons from the failure to forecast the Great Recession for the monitoring and statistical modelling of near-term economic developments. Crucially, a broader range of information, including financial developments, is now accounted for in OECD forecasts (Lewis and Pain, 2014). In an attempt to systematise this approach, OECD economists have recently estimated state-of-the-art statistical models that allow extracting meaningful signals from a large set of economic indicators, including equity and credit market indicators, real estate and consumer prices, disaggregate industrial production, as well as business and consumer surveys. They compare these models’ ability to forecast quarterly GDP growth during and after the Great Recession with that of the smaller-scale traditional OECD forecasting models (Ollivaud et al., 2016).

The main lesson of this research is that relying on more data does not mechanically improve forecast performance. This is because some economic indicators are redundant and because more data also means more noise to filter out. Identifying which variables are most relevant for the GDP forecast is tremendously difficult in real time, even though with hindsight the relation appears obvious, as for instance with financial market developments during the Great Recession.

Ollivaud et al. (2016) show that traditional OECD forecasting models based on a reduced set of 5-6 economic indicators perform similarly to the state-of-the-art models that exploit up to 150 indicators. While forecasts become more precise as more up-to-date indicators become available, forecast errors during the Great Recession are large for both types of models even around the publication date of GDP (Figure 1).
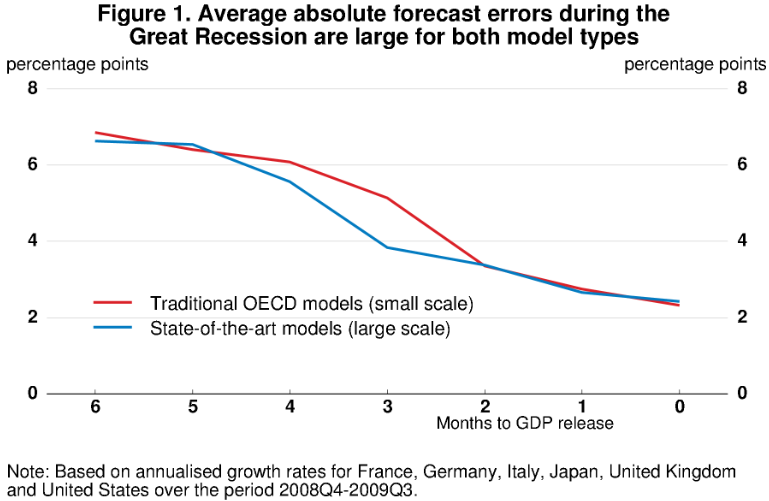
ollivaud-et-companie

As was emphasised at a workshop on complexity and policy recently organised at the OECD, big data and models that include non-linear features can certainly help to better understand economic phenomena and are worth pursuing further. However, the results in Ollivaud et al. (2016) suggest that implementing this approach in practice will be a long endeavour. In the meantime, smaller and simpler models can play an important role in tracking short-term economic developments and also have the advantage that it is easier to understand what is behind any forecast revision.

References

Lewis C., Pain N. (2014): Lessons from OECD forecasts during and after the financial crisis. OECD Journal: Economic Studies

Ollivaud P., Pionnier P.-A., Rusticelli E., Schwellnus C., Koh S.-H. (2016): Forecasting GDP during and after the Great Recession. OECD Economics Department Working Paper No. 1313


Mind the gapS: boost early childcare education and care in Costa Rica

By Alberto González Pandiella, Economist, SDD, OECD Economics Department

Costa Rican well-being indicators are comparable or even above the OECD average in several dimensions (OECD, 2016a). Nevertheless, gaps with OECD countries are large in two dimensions:  labour market participation and education.  This hampers both long-term growth prospects and equity.  Boosting early childcare education and care would help to close both gaps (Gonzalez Pandiella, 2016).

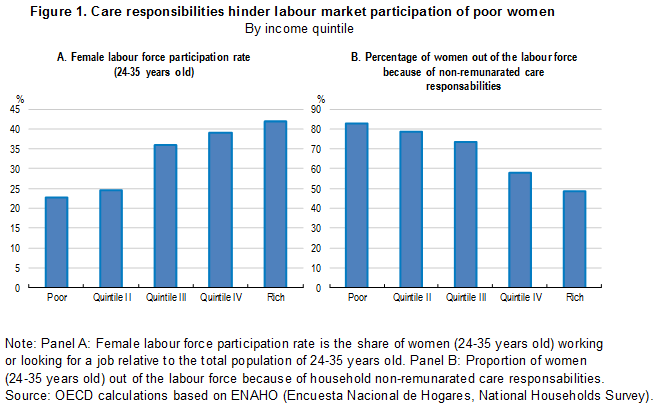
Only slightly over half of the Costa Rican working-age women participate in the labour market. Gaps in participation start at very early ages and remain large thereafter. Women from low socioeconomic background face difficulties to continue in education and tend to drop out of the labour force. Only one out of four women in low income households in the 24-35 age bracket participate in the labour market (Figure 1, Panel A). This low participation is predominantly due to the non-remunerated care responsibilities they have to assume (Figure 1, Panel B). This highlights the need to increase the supply of publicly-funded childcare services, and to target them at women in low income households.

costa-rica-fig-1

Costa Rica shows a strong commitment to invest in education. But the average education attainments remain low. Less than half of the 25-29 cohort has completed secondary education, which is well below graduation rates observed in other Latin American countries such as Colombia, Peru and Panama.  PISA scores are low in all disciplines, indicating that the quality of education is also comparatively low. Moreover, educational gaps depending on households’ income are widening.  These inequalities in education outcomes start early. At the end of primary education, the share of students coming from low income households lagging behind is high, and this is aggravated in lower secondary, when many drop out. Attendance to pre-primary education helps to decreases the likelihood of low performance in secondary education, even after controlling for socioeconomic factors (OECD, 2016b). Thus, boosting attendance to early childhood education and care, with an especial focus on children from low-income households, would also contribute to close educational inequalities and gaps in Costa Rica.

References:
Gonzalez Pandiella, Alberto (2016), “Making growth more inclusive in Costa Rica”, OECD Economics Department Working Paper no. 1300.

OECD (2016a), OECD Economic Surveys: Costa Rica 2016, OECD Publishing, Paris.

OECD (2016b),  Low-Performing Students: Why They Fall Behind and How to Help Them Succeed, PISA, OECD Publishing, Paris, http://dx.doi.org/10.1787/9789264250246-en


Inefficient insolvency regimes: a barrier to creative destruction?

by Müge Adalet McGowan and Dan Andrews, Structural Policy Analysis, OECD Economics Department

Productivity is the ultimate engine of growth in the global economy, but there has been an increasing concern about weak productivity growth in recent years. A key recent OECD work, the Future of Productivity implies that inefficient firms increasingly linger as opposed to exit the market, despite their inability to adopt new technologies. Joseph Schumpeter (1942) introduced the idea that economic progress can be partly attributed to the principle of “creative destruction”, the replacement of old and obsolete technologies, products, methods of production and markets with new ones; and the exit of existing firms that are unable to adopt new innovations.

The productivity costs of barriers to entry and competition are well known, but policy-induced barriers to exit of low productivity firms can also affect aggregate productivity. For example, personal insolvency regimes lacking a “fresh start” provision – i.e. the exemption of future earnings from obligations to repay past debt due to liquidation – increase the costs and the stigma of failure associated with insolvency: this can not only delay exit of failing firms, but also lower incentives for experimentation and entrepreneurs’ ability to start new businesses in the future. To better understand this kind of link between productivity and exit policies, Adalet McGowan and Andrews (2016) has developed an analytical framework to identify the channels through which exit policies affect aggregate productivity growth. Two main insights emerge from it (Figure 1):

  • Exit policies can directly affect aggregate productivity by: i) shaping the strength of market selection, which enables the exit of non-viable firms and the restructuring of viable ones (e.g. judicial efficiency); and ii) shaping the reallocation of resources from failing firms to more productive uses (e.g. via policies facilitating worker mobility).
  • Product market reforms that raise competitive pressures and efficient insolvency regimes will strengthen the contribution of exit to aggregate productivity via both tighter market selection and more effective reallocation, ultimately boosting the effects of other exit policies (e.g. regulations affecting product, labour and financial markets) on aggregate productivity growth.

policies-can-shape-prod

The OECD, which has been a leader in developing indicators on product market regulations, is currently building new cross-country indicators on insolvency regimes, which will be released in early 2017. This will make it possible to estimate the effects of these regimes on productivity and make relevant and specific policy recommendations on how to improve their different design features so as to boost productivity growth.

References:

Adalet McGowan, M. and D. Andrews (2016), “Insolvency Regimes and Productivity Growth: A Framework for Analysis”, OECD Economics Department Working Papers, No. 1309.

OECD (2015), The Future of Productivity, Paris.

Schumpeter, J. (1942), Capitalism, Socialism and Democracy, Harper and Brothers, New York.


Product market reforms under the microscope

by Alexander Hijzen, Senior Economist, Directorate for Employment, Labour and Social Affairs, OECD and  Peter N. Gal, Economist, Economics Department, OECD

Given the secular decline in productivity growth and the persistent weakness of the economic recovery in many advanced economies, increased attention is being paid to the potential role of structural reforms for restoring economic growth. While structural reforms concern many policy areas (e.g. banking supervision, property right laws and employment-protection rules), product market regulation (PMR) feature particularly prominently on the agenda of many advanced economies (OECD, 2015). Understanding the dynamics effects of reforms in this area may provide important insights with respect to the way such reforms are designed, the political economy of reforms and the potential need for complementary policies. In a recent paper (Gal and Hijzen, 2016), we attempt to open up the black box of pro-competition product market reforms by providing a comprehensive analysis of their short-term impacts across firms that differ in terms of the main sector in which they operate, the size of their operations and their financial health.

Our main findings on the impacts of major product market reforms are as follows:

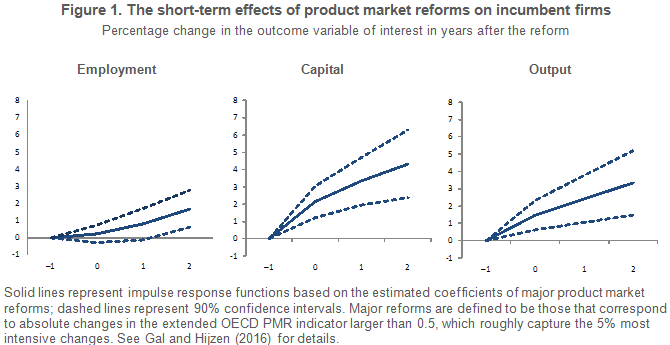
  • First, the short-term, firm-level effects of reducing regulatory barriers to product market competition are positive and strengthen over time (Figure 1). The effects are immediate for both output and investment, and increase further to 4% and 3% respectively after two years. The effects for employment are considerably smaller and only materialize after two years.

gal-on-pmr-1

  • Second, there are systematic and plausible differences in the effects of reforms across firms of different sizes across different industries (Figure 2). More specifically, in network industries, small firms tend to benefit most from pro-competitive product market reforms, while larger ones downsize to reduce costs and maintain market shares. By contrast, in retail trade, large and potentially more efficient firms tend to benefit more from such reforms.

gal-on-pmr-2

  • Third, financial difficulties faced by firms weaken the short-term impact of product market reforms on investment. These findings highlight the importance of addressing the problem of weak bank balance sheets when considering product market reforms, and points to the complementary role of financial sector reform more generally. This is particularly relevant in those countries where the flow of credit is still weak and the case for product market reform is relatively strong (e.g. some countries in Southern Europe).

 In sum, the present findings confirm the positive effects of pro-competitive product market reforms on economic performance in the medium to longer term, while also providing rich new insights on the way the effects of such reforms materialize over time across different types of firms. More specifically, these findings help to understand why it can be difficult to implement product market reforms in certain sectors, but less so in others. For example, the pace of product market reforms could be slowed down in network industries since large incumbent firms have a tendency to lose out in terms of jobs and profitability. The tendency of financial difficulties to mitigate the impact of product market reforms on investment may also suggest that the effects of product market reforms materialize more slowly in times when the economy is depressed and credit is hard to get by.

These insights can be used to enhance the design of product market reforms and to motivate the need for complementary measures to promote aggregate demand, restore bank balance sheets and to alleviate the social cost of adjustment (IMF, 2016; OECD, 2016).

References

Gal, P. N. and A. Hijzen (2016), “The Short-Term Impact of Product Market Reforms : A cross-country firm-level analysis”, OECD Economics Department Working Papers No. 1311.
Also appeared as IMF Working Paper No. 16/116.

IMF (2016), World Economic Outlook, Chapter 3, April, International Monetary Fund, Washington, D.C.

OECD (2015), Economic Policy Reforms: Going for Growth, Organization for Economic Cooperation and Development, Paris.

OECD (2016), “Short-term labour market effects of structural reforms: Pain before the gain?”, in OECD Employment Outlook 2016, OECD Publishing, Paris.


Does decentralisation foster regional GDP convergence?

by Hansjörg Blöchliger, Senior Economist, Policy Studies Branch, Economics Department

The growth pattern of OECD countries and their sub-national entities is puzzling. Between-country differences in GDP per capita are declining, yet the differences across jurisdictions within those countries tend to rise. Put in other words, countries’ GDP converges, while the output of their sub-national jurisdictions tends to diverge (Figure 1). Today differences across countries are smaller than, on average, within a country, which is quite different from the situation 20 years ago.

fisc-decentralisation-gdp

What could explain the puzzle? Agglomeration economies and the unequal geographical impact of globalisation could play a role. Trade and other forms of international exchange are dominated by firms that tend to be located in large agglomerations. Convergence of countries could hence be driven by the convergence of agglomerations that are well-integrated into global value chains. The picture looks different if one looks at a single country. When productivity is underpinned by agglomeration forces, regions with large agglomerations will pull ahead of regions without, and differences in growth rates become self-propelling. As a result, countries converge while regions diverge. Indeed, decomposing GDP suggests that differences in sub-national productivity are the main driver of GDP per capita disparities.

Yet rising GDP disparities are no fate. They depend on a country’s intergovernmental framework and can be tackled by policy. Assigning more fiscal power to the sub-national level – e.g. for spending on education or infrastructure – can contribute to a more balanced development across a country. According to new OECD research, GDP disparities tend to be smaller in more fiscally decentralised countries, and tend to grow more slowly or even to decline there. The type of fiscal decentralisation matters: Assigning more taxing power to the sub-national level underpins convergence, while a large intergovernmental transfer system has the opposite effect. Interestingly, catching-up regions tend to benefit more from decentralisation than the frontier regions. They appear to adopt policy innovations more rapidly and those seem to have a stronger impact. Conversely, intergovernmental grants tend to fuel disparities, probably because they do not provide lagging regions with the right incentives to catch up. The channel from decentralisation to convergence has yet to be investigated; i.e. whether productivity trickles down faster or whether capital and labour moves more swiftly across jurisdictional borders.

Further reading:

Blöchliger, H., D. Bartolini and S. Stossberg  (2016), “Does Fiscal Decentralisation Foster Regional Convergence?“, OECD Economic Policy Papers, No. 17, OECD Publishing, Paris.
DOI: http://dx.doi.org/10.1787/5jlr3c1vcqmr-en


Achieving and sharing the benefits of globalisation

by Catherine L. Mann, OECD Chief Economist, and Ken Ash, Director of the OECD Trade and Agriculture Directorate. This post was also published by the OECD Insights blog

Yesterday’s OECD Interim Economic Outlook warns that trade growth is slowing, contributing to another slowing of global GDP growth in 2016 and with few signs of improvement for 2017. Does it really matter? If we believe the current anti-trade, anti-globalisation rhetoric, we might shrug our shoulders and say “no”. Trade has been so maligned and demonised, some might even be pleased.

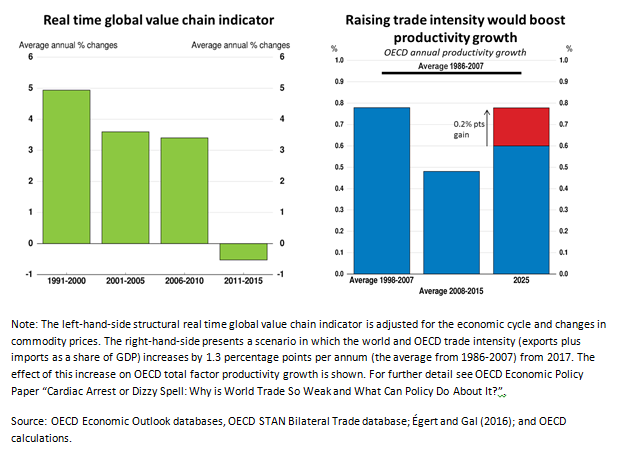
But that would be the wrong answer. Open trade and cross-border investment are key vectors for diffusion of new technologies and competition, which are central to achieving productivity gains and improving well-being. New research published yesterday by the OECD in conjunction with the Interim Economic Outlook suggests that a substantial part of the post-crisis slowdown in total factor productivity growth could be reversed if trade intensity were to recover. In short, weak trade is one of the factors that will keep the economy in a “low-growth” trap where sluggish trade and investment lead to diminished growth expectations and rising financial risks.

Over decades, trade has been responsible for drawing hundreds of millions of people out of poverty – and we mean one and two-dollar-a-day poverty – in emerging and developing countries. Trade could perform this same miracle for the many millions still living in abject poverty in poor countries in Asia and Africa, if other conditions are also right of course. Salaries and working conditions are almost always better in companies that trade than in those that do not, and this is true in countries at all levels of development. Households gain hugely from trade because it increases choice and reduces prices.

The prospects of millions of workers in the global economy depend on their participation in global value chains, as highlighted by statistics developed by the OECD with the WTO on Trade in Value-Added (TiVA). The main insight from these data is first, in order to export efficiently, a company has to also import efficiently. A second key insight is the importance of high quality services to support trade and trade-intensive activities. It should be of great concern that there are signs that the development of global value chains appears to have gone into reverse in recent years.

The OECD paper looks at the reasons for the trade slowdown and back-tracking in the development of global value chains. Several factors are at play, some of them cyclical in nature, others structural like the changing role of China in the global economy. Increasingly murky protectionism is contributing to the slowdown, as is the failure to implement any really ground-breaking global new trade initiatives for more than a decade. Without entering into a rather futile debate about when the slowdown really started or the exact contribution of structural versus cyclical drivers, let us instead ask what governments can do to reverse it.

The OECD Interim Economic Outlook calls for implementation of a package of measures to boost demand, including through collective fiscal action focused on raising investment and productive spending, and structural reforms. Removing barriers to trade and creating the conditions for people to reap the potential benefits of trade should be at the heart of the structural reform agenda.

First, governments should put their weight behind efforts to further lower trade barriers and unnecessary trade costs by implementing the Trade Facilitation Agreement, vigorously pursuing the reduction of restrictions on services trade, including by concluding the trade in Services Agreement (TISA), co-operating to reduce costly and unnecessary regulatory differences, concluding the Agreement on Environmental Goods, and by coming to the table to deliver a good result at the 11th WTO Ministerial Conference a little over a year from now.  They should reduce remaining barriers to foreign direct investment. There are unilateral, bilateral, plurilateral and multilateral channels available if governments want to provide those growth opportunities that are currently lacking.

Second, governments need to step in to ensure that the benefits of trade are fairly shared. Governments should help those affected by the churn and disruption caused by globalisation. Benefits from trade are diffuse and long-term in nature. Losses tend to be sharp and very concentrated on individuals and regions. The people most affected are sometimes those with the least capacity to adjust. An unemployed steel worker does not take much comfort from knowing that programmers in Silicon Valley are thriving, or that T-shirts and smartphones are cheaper. What he or she needs is a decent job, new training and skills, and a robust social safety net to help through the transition.

Making trade work better for more people is not just about persuading them, although clearer and more honest communication is important. It is about ensuring that the full panoply of structural policies is put to work to ensure that people are able to reap the benefits that more open trade, technology, and investment will bring. This means paying attention to infrastructure, well-functioning financial markets, education and skills, clear and transparent institutions and rule of law – all the things that make an economy nimble Trade policy cannot be made in a vacuum but rather must be part of the fabric of domestic policies.  If we are not able to do this, growing public scepticism, particularly in the most advanced economies, may mean that further market opening will be difficult, if not impossible. Such a result would impoverish many across the world.

References:

OECD Interim Economic Outlook, September 2016.

Haugh et al (2016), “Cardiac Arrest or Dizzy Spell: Why is World Trade So Weak and What Can Policy Do About It?” OECD Economic Policy Paper No. 18, September, OECD Publishing, Paris.


Global growth warning: weak trade, financial distortions

By Catherine L. Mann, OECD Chief Economist

The global economy remains in a low-growth trap. In our latest Interim Economic Outlook global GDP growth is set to remain flat around 3% in 2016 and improve modestly to 3.2% in 2017. This is slightly lower than the June Economic Outlook forecast due to weaker conditions in advanced economies, including the effects of Brexit, offset by a gradual improvement in major emerging market commodity producers. More significantly, this string of feeble global growth rates is well-below historical norms.

The prolonged weakness in the world economy generates a self-reinforcing low-growth trap: depressed trade, investment, productivity, and wages in the current weak global environment, in turn lead to an additional downward revision in growth expectations and even more subdued demand. Poor growth outcomes combined with high inequality and stagnant incomes are also further complicating the political environment and increasing challenges facing policymakers.

Weak global trade is a particular concern. World trade was growing exceptionally slowly after the financial crisis, and has collapsed in 2015 and 2016. This weak trade growth is both a symptom of and exacerbates the weak global environment. As I have written separately, trade matters for productivity, living standards and inclusive growth. Returning to robust trade growth requires policy action to deepen global integration, but even more importantly to share the benefits, as detailed in our new paper examining the trade slowdown and policies to boost trade.

ieo-dizzy-trade

Significant distortions in financial markets create vulnerabilities, made particularly stark against the poor performance of the real economy. Short- and long-term interest rates have fallen further in recent months to very low and – in many cases – negative levels. Around USD 14 trillion of government bonds, more than 35% of OECD government debt, is currently trading at negative yields, reflecting, among other factors, expectations for persistently low growth and expected monetary policy.

Low and negative interest rates underpin widespread and substantial increases in asset prices, both internationally and across asset classes. Equity prices remain high and have continued to increase in some economies despite weak profit developments and reduced long-term growth expectations. House prices are also rising rapidly in many economies. Credit spreads have tightened this year even as overall credit quality for corporate bonds has declined.

These financial distortions raise risks. In particular, a reassessment in financial markets of the path of interest rates could result in substantial re-pricing of assets and heightened financial volatility. As it is, sustained negative and low interest rates challenge financial institutions’ business models and sustainability, demonstrated by the underperformance of bank shares relative to the overall market. Low interest rates also pose significant challenges for pension funds and asset managers, with implications for savers and retirement incomes.

Monetary policy is overburdened with associated risks. Hence, central bank policymakers need to calibrate both costs and benefits of increasing unconventional support.

On the other hand, fiscal space has been created by the low interest rates. In many advanced economies, interest rates have fallen by more than GDP growth, thereby raising the sustainable debt level. Low interest rates have reduced interest expenses. Hence, fiscal policy should take advantage of this fiscal space by increasing quality investment to boost human capital, physical infrastructure and equality. Canada, China, Japan and the US have recently announced fiscal expansion and the UK has signalled an easing in the budgetary stance. Euro area fiscal policy also should do more to support growth, such as easing the application of the EU Stability and Growth Pact and excluding net investment spending from fiscal rules.

Structural reform momentum needs to be intensified, rather than continue to slow. At the Hangzhou Summit earlier this month, G20 countries were only around half-way to their target of 2% additional G20 GDP by 2018 due to sluggish progress on implementation. Worryingly, despite concerns about weak trade, the share of trade policy commitments fell to 6% from 14% two years ago. Reforms to boost trade are a key lever to boost growth and need to be supported by complementary policies that ensure the gains from globalisation are widely shared among citizens.

The more balanced policy mix, making greater use of fiscal, structural and trade policies, would put the global economy on a stronger and more sustainable and inclusive growth path. Improved expectations of higher future growth from more fully deployed fiscal and structural policies would help to ease the burden on monetary policy and facilitate an eventual normalisation of interest rates.

Bibliography

OECD Interim Economic Outlook, September 2016.

Haugh et al (2016), “Cardiac Arrest or Dizzy Spell: Why is World Trade So Weak and What Can Policy Do About It?” OECD Economic Policy Paper No. 18, September, OECD Publishing, Paris.


Enhancing Greek exports is key to jobs and growth

By Christine de La Maisonneuve, Economist on the Greek desk, Economics Department

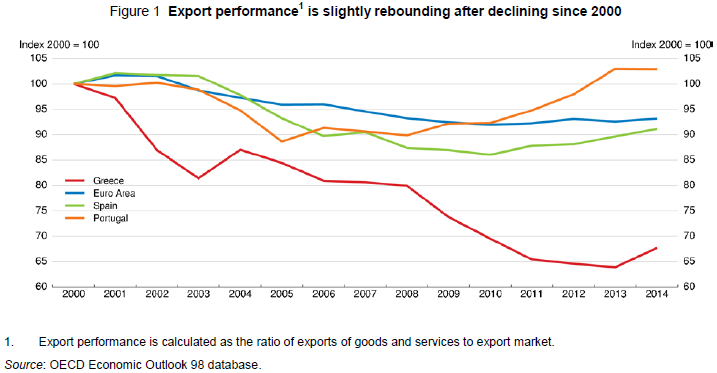
With weak domestic demand and a relatively low export share in the economy there is much potential to raise exports. Despite a recent pick-up Greek export performance deteriorated in the last decade particularly in the service sector and by much more than in the Euro area on average (Figure 1).

DLM Greece fig 1

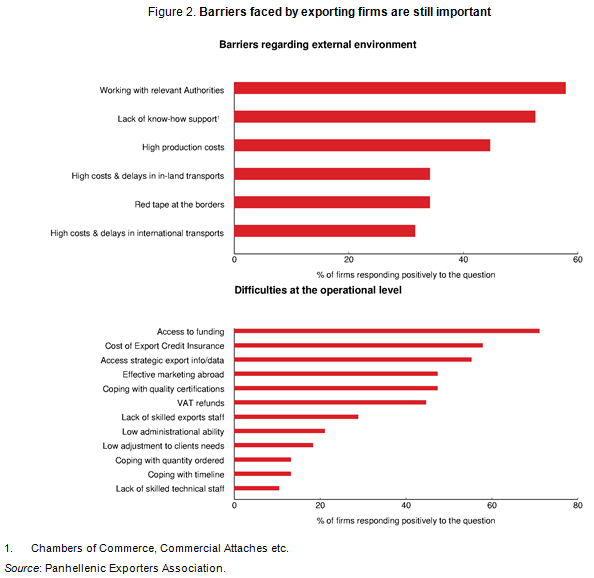
The decline in unit labour costs since 2010 has restored cost competitiveness, but the response of exports has been sluggish due to severe liquidity constraints and lagged price adjustment. While some of the decline reflects drops in oil prices and world shipping demand, structural problems in product markets, barriers to exporting, access to finance and administrative burden affect competitiveness and export performance (Figure 2).

DLM Greece fig 2

Export performance is also affected by low integration in global value chains (GVCs). The small size of the manufacturing sector, low FDI flows, inefficient infrastructure and dominance of small and informal enterprises have contributed to a low technology content of  goods exports  and make integration difficult (Bank of Greece).

Competitiveness and exports can be boosted by policy reforms. Policies that create a business environment where firms can easily enter (and exit) the market and young high-performing firms can thrive and grow are particularly important. Increasing the efficiency of the judiciary system is important to improving the business environment as it reduces uncertainties and transaction costs. The implementation of a ‘national single window’ for exports, as foreseen by the National Trade Facilitation Strategy (NTFS) for Greece, would act as a one-stop shop, specifically for export procedures and is expected to significantly alleviate the high cost and long time periods involved in exports. This would help competitiveness. Liberalising further product markets and better bankruptcy procedures would also help SMEs grow.

Improving investment in human and knowledge-based capital would enhance integration in GVCs. This calls for more support to quality education and skills training. This will require improving the quality of teachers by linking teaching evaluation to effective professional development, making schools more autonomous and accountable and introducing a performance evaluation system for universities. Also innovation and investment in ICT would enable product differentiation and gains in market shares. For instance, only around 10% of Greek firms sell via e‑commerce compared to 21% in OECD countries on average.

As many services particularly related to R&D, product design and development are inputs to export products, it is important to reduce inefficiencies in input markets. Further liberalisation in regulated professions such as engineers would boost high-technology goods exports.  The quality of transport infrastructure could also be improved. The gap is particularly important for railroad and, albeit to a lesser extent, road infrastructure. Reforms have been put in place to enhance the weak transportation sector, but there is still considerable scope for developing port activities as a gateway to the land transportation network, not just for Greece but for the entire region. Boosting investment in logistics should continue. One way forward would be to make better use of public land through concessions or privatisations to facilitate investment in logistics and infrastructure.


References

De la Maisonneuve, Christine (2016), How to Boost Export Performance in Greece, OECD Economics Department Working Paper no. 1299.

OECD (2016), Economic Surveys: Greece 2016, OECD Publishing, Paris.

OECD Economic Outlook 98 Database


Pump-priming productivity through reform: the case of Lithuania

By Ben Westmore, Economist, Country Studies Branch, OECD Economics Department

In the past two decades, the income level in Lithuania has steadily risen toward that of OECD countries. Between 1995 and 2013, GDP per capita rose from one third to two thirds of the OECD average. Productivity catch-up was critical to this process, aided by enhanced integration into the global economy which enabled the adoption of more advanced production technologies from abroad.

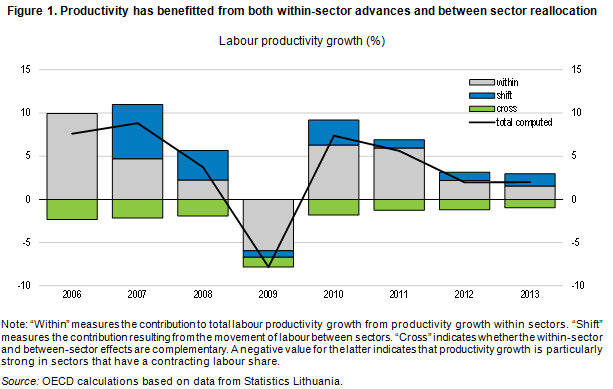
Decomposing Lithuanian labour productivity growth in the 2006-2013 period reveals that both reallocation of resources between sectors and within‑sector productivity growth have been important (Figure 1). The latter can be driven by reallocation between firms in the same sector as well as increases in within‑firm productivity.

Ben lithuania productivity

Compared with other countries, the contribution to productivity growth of between sector reallocation (i.e. the “shift” effect in Figure 1) has been large in Lithuania. This may reflect a series of reductions in regulatory barriers to firm entry over the past decade. According to the World Bank Doing Business indicators, the cost to start a business fell from 4% to 0.6% of income per capita between 2003 and 2015. Specific reforms included the establishment of a new form of legal company (a “small partnership”) that has no minimum capital requirement and a reduced number of regulatory procedures. A one-stop shop for online business registration was also introduced as well as measures to reduce the difficulty of companies to register as a value added taxpayer.

Indeed, new OECD empirical analysis at the industry-level across the 2006-2013 period identifies that these policy changes have been associated with increased contributions to productivity growth through both the “within” and “shift” effect in Lithuania (see Chapter 1 of the Lithuania Economic Assessment for details). One channel through which this likely arose is by such reforms enabling increased entry of young small firms that subsequently obtained market share at the expense of poorer-performing incumbents. This is consistent with the fact that the firm exit rate in Lithuania was around double the European Union average during the period.

The trends from firm-level data fit this interpretation. Firm-level estimates suggest that multifactor productivity growth in Lithuania would have been around one-third lower over the 2000-13 period without new firm entry. Accordingly, these data show a steep pick-up in the proportion of small businesses in Lithuania during the past decade (Figure 2).

Ben proportion of small firms

This is not to say that all the necessary reforms in Lithuania have been undertaken. The level of labour productivity is still around one-third below the OECD average. The education system at all levels can do a much better job at producing graduates with the skills required by firms, state-owned enterprises occupy a relatively large share of the economy (and many of these underperform) and innovation in the business sector is low. However, Lithuania’s recent record of productivity-enhancing product market reforms gives reason for optimism that policymakers can make the policy adjustments needed to further promote convergence and the living standards of the population.

Find out more:

Lithuania productivity country profile

OECD (2016), Economic Survey: Economic Assessment of Lithuania 2016, OECD Publishing, Paris.

OECD (2016), Review of School Resources: Lithuania, OECD Publishing, Paris.

OECD (2015), Regulatory Policy in Lithuania, OECD Publishing, Paris.

OECD (2015), Review of Lithuania’s Position Relative to the OECD Guidelines on Corporate Governance of State-owned Enterprises, OECD Publishing, Paris.


When size matters: scaling up delivery of Czech local services  

By Christine Lewis, Economist, Country Studies, OECD Economics Department

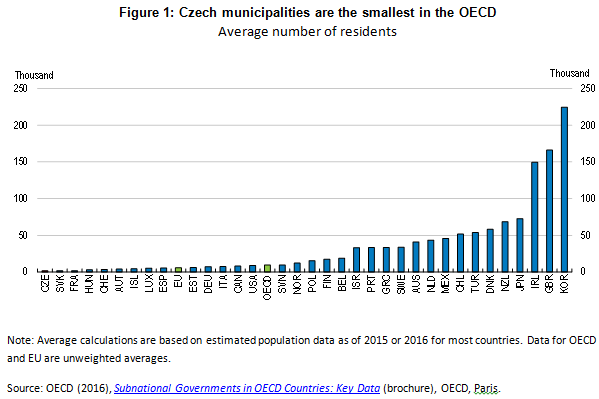
A key argument for small local governments is that they can better deliver the services that their residents want and need. A key question is: what size is too small?  When is the average cost of services too high, the range of choice too narrow or expertise spread too thinly across the country? These questions are especially relevant in the Czech Republic where there are over 6 200 municipalities – the smallest on average in the OECD (Figure 1). Almost one-quarter of municipalities have less than 200 residents; around three-quarters have less than 1 000 residents.

Czech municipalities smallest in oecd

Municipalities have important responsibilities in delivering key services including education, healthcare, transport, public housing and waste removal. It seems that scaling up some services could realise economies of scale and scope. For instance, schools tend to be small – around 60% of basic schools have less than 200 students – which limits their ability to cater to a larger range of needs (Shewbridge et al., 2016). In very small municipalities overheads may be crowding out spending on other services: administration costs per person were 50% higher in 2013 in municipalities with 100-200 residents than those with 1 000-2 000 residents.  Small municipalities also have more difficulties with technical procedures, like public procurement.

Scaling up service delivery does not necessarily mean mergers, although a number of OECD countries have taken this path. In Italy and Hungary certain services must be provided jointly if municipalities are below a threshold size. France provides financial incentives for co-operation. Non-financial incentives could be used to reinforce financial incentives.  Alternatively, service standards could be imposed to guarantee minimum standards across the country and induce greater co-operation to meet these standards. In any case, the central government should create a unit to monitor co-operation and facilitate co-operation between municipalities, with additional support from regional governments and the representative associations of municipalities.  A promising new programme is piloting centres of shared services, which should help mitigate skill shortages, and if successful, should be expanded systematically.

This process should be accompanied by more information about the performance of service providers. Norway’s KOSTRA system is an example of best practice in combining and publishing performance information. In the Czech Republic a lot of data already exist but are fragmented or not published. Publishing performance indicators and using them in benchmarking and in budgetary processes would better inform policymakers and provide stronger incentives to providers to raise service quality. It would also help citizens decide whether the right balance has been struck between municipal size and the service quality that they expect.

Reference:

OECD (2016), Economic Surveys: Czech Republic 2016, OECD Publishing, Paris.

Shewbridge, C. et al. (2016), OECD Reviews of School Resources: Czech Republic, OECD Publishing, Paris, forthcoming.