Unleashing private sector productivity in the United States

By Douglas Sutherland, Head of the United States Desk, OECD Economics Department

With the global economy mired in low- growth and no signs of strong acceleration, a lot of attention has been paid to the meagre pace of productivity growth in OECD countries. In the United States, the most watched indicator of productivity (nonfarm business productivity growth) decelerated about ¾ percentage point from 2009 to 2014 relative to the preceding 5-year period. This is not just the result of the crisis holding back investment. Productivity growth had already been slowing from the early 2000s.

Economic research reveals competitive markets stimulate productivity: faced with competitors, firms survive by becoming more efficient and bringing new products to the market. Competitive markets see a lot of firm entry and exit. However, this dynamism has declined: new firms are not being created as frequently as in the past (See figure, top panel) and the most productive of these firms are not growing as fast as they once did. This matters because advances in productivity typically result from the rapid growth of young dynamic firms. Instead, start-ups appear to be failing more often and the remaining firms are getting older with larger firms increasingly dominating markets (See figure, bottom panels).

sutehrland-prod-and-us

When this happens, markets become more concentrated, with large incumbent firms gaining market power. This has many disadvantages because gains in productivity are not being passed onto consumers in lower prices or to workers in higher wages. Faced with these worrying trends, competition/antitrust policy needs to adapt. This is particularly the case in markets transformed by digitalisation, financial innovation and globalisation – such as e-commerce and those dependent on access to information. The decline in business dynamism sometimes comes from barriers to competition being erected by the States. For example, state-level prohibitions on municipalities creating their own fixed broadband networks have hindered the development of stronger competition in this sector. In other cases, States have blunted competitive pressure through imposing state-specific occupational licensing requirements.

Amongst other factors, changes to bankruptcy laws have also contributed to more sluggish business formation. Reforms in 2005 increased the cost of bankruptcy for failed entrepreneurs and made it more difficult for them to try again (see the recent Ecoscope blog on the importance of this for productivity growth). The reforms appear to have stymied the creation of sole proprietorships and partnership, particularly in States that do not exempt some of the entrepreneur’s assets from bankruptcy proceedings. Given the importance of bankruptcy for long-run prospects, a better balance needs to be stuck between supporting entrepreneurship and creditor rights.

References:

Millar, Jonathan and Douglas Sutherland (2016), “Unleashing private sector productivity in the United States”, OECD Economics Department Working Paper no. 1328.

OECD (2016), Economic Surveys: United States 2016, OECD Publishing, Paris.


What do pro-competitive policies imply for workers?

By Boris Cournede, Senior Economist, Public Economics Division, OECD Economics Department

Reforms that make economies more competitive have become a polarising subject. On one side, they are well established as a core staple of reform programmes: they are known to boost growth. On the opposite side, they often come up as lightning rods for criticism, as some perceive that such reforms make life more difficult for workers. And some people may lose from such reforms.

What do the data say? And what can economic policy makers do to achieve better results? The OECD has gathered, harmonised and probed micro-level data covering individual households in 26 countries over the past two decades to answer these questions.

A key conclusion is that reforms that improve competition in goods and services markets generally boost job-finding chances for people out of work (Figure 1). At the same time, they do not increase job-loss rates much, so that overall they have a small but positive net effect on employment. This micro-level finding that pro-competition reforms boost employment corroborates previous OECD and other research identified at the macro level: such confluence of different studies using different methods is reassuring about the robustness of the conclusion.

cournede-the-chances-to-become-employed

Effects differ a lot across different people. The job-finding benefits of more competitive markets accrue primarily to young workers and women. More competitive markets leave jobless men’s chances to find jobs essentially unchanged.

More competitive markets imply a greater number of job exits for workers who are less qualified or more generally have low earnings capacity (Figure 2). This effect adds to a starting point where, in the absence of reform, low-income workers already face a much higher risk than others to become unemployed or quit the labour market altogether. However, job-finding probabilities also rise, leaving employment unchanged for low-income workers. In other words, more competitive markets imply that low-income workers face higher labour market rotation, with more frequent but shorter spells out of employment, for unchanged average employment prospects over time.

pmr-reforms-cournede

The greater labour market instability that pro-competition reforms generate for low-income workers calls for ensuring that employment assistance programmes reach them and are effective. These programmes are particularly helpful when they develop vulnerable workers’ employability in all situations: this can be done by allowing vulnerable programmes to tap active employment assistance programmes not only when they are unemployed but also when they work or are out of the labour force.

The OECD inquiry into the effects of flexibility-enhancing reforms on workers also delved into labour market reforms, the influence of other policies and specific impacts on workers employed in reformed sectors. These areas have important policy implications that forthcoming blog posts will outline.

References

Cournède, B., O. Denk, P. Garda and P. Hoeller (2016), “Enhancing Economic Flexibility: What is in it for Workers?”, OECD Economic Policy Papers, No. 19, OECD Publishing.

Cournède, B., O. Denk and P. Garda (2016), “Effects of Flexibility-Enhancing Reforms on Employment Transitions”, OECD Economics Department Working Papers, No. 1348, OECD Publishing.

Denk, O. (2016), “How Do Product Market Regulations Affect Workers? Evidence from the Network Industries”, OECD Economics Department Working Papers, No. 1349, OECD Publishing.

Garda, P. (2016), “The Ins and Outs of Employment in 25 OECD Countries”, OECD Economics Department Working Papers, No. 1350, OECD Publishing.

Boeri, T., P. Cahuc and A. Zylberberg (2015), “The Costs of Flexibility-Enhancing Structural Reforms: A Literature Review”, OECD Economics Department Working Papers, No. 1227, OECD Publishing.


Deploy effective fiscal initiatives and promote inclusive trade policies to escape from the low-growth trap

by Catherine L Mann, OECD Chief Economist and Head of OECD Economics Department

For the last five years the global economy has been in a low-growth trap, with growth disappointingly low and stuck at around 3 per cent per year. Persistent growth shortfalls have weighed on future output expectations and thereby reduced current spending and potential output gains. Around the world, private investment has been weak, public investment has slowed, and global trade growth has collapsed, all of which have limited the improvements in employment, labour productivity and wages needed to support sustainable gains in living standards. Overall, a slowdown in structural policy ambition and policy incoherence have slowed business dynamism, trapped resources in unproductive firms, weakened financial institutions and undermined productivity growth. In the face of these limited prospects, the OECD has argued in previous Economic Outlooks that fiscal, monetary and structural policies need to be deployed comprehensively and collectively for economies to grow sufficiently to make good on promises to their citizens.

The projections in this Economic Outlook offer the prospect that fiscal initiatives could catalyse private economic activity and push the global economy to the modestly higher growth rate of around 3½ per cent by 2018. Durable exit from the low-growth tap depends on policy choices beyond those of the monetary authorities – that is, of fiscal and structural, including trade policies – as well as on concerted and effective implementation. Collective fiscal action undertaken by all countries, including a more expansionary stance than planned in many countries in Europe, would support domestic and global growth even for those economies, who by virtue of specific circumstances, need to consolidate their fiscal positions or pursue a more neutral stance.

Some might argue that there is no space for such fiscal initiatives, given the heavy public debt burden in many economies. In fact, following five years of intense fiscal consolidation, debt-to-GDP ratios in most advanced countries have flattened. It is past time to focus on expanding the denominator – GDP growth. This Economic Outlook argues that the current conjuncture of extraordinarily accommodative monetary policy with very low interest rates opens a window of opportunity to deploy fiscal initiatives. Fiscal space has been created by lower interest payments on rolled-over debt, which also increases gauges of market access and of debt sustainability. On average, OECD economies could deploy deficit financed fiscal initiatives for three to four years, while still leaving debt-to-GDP ratios unchanged in the long term. A front-loaded effort could allow deficit finance to taper sooner and put the debt-to-GDP ratio sustainably on a downward path.

The key is to deploy the right kind of fiscal initiatives that support demand in the short run and supply in the long run and address not just growth challenges but also inequality concerns. These include soft investments in education and R&D along with hard investment in public infrastructures. Such fiscal initiatives would improve outcomes for demand and supply potential even more for economies suffering from long-term unemployment, when undertaken collectively, and when fiscal initiatives are complemented by country-specific structural policies put together in a coherent package. The mix is different for different countries, as developed in Chapter 2, with further details in the Country Notes in Chapter 3 of this Economic Outlook.

Against this backdrop of fiscal initiatives, reviving trade growth through better policies would help to push the global economy out of the low-growth trap, as well as support revived productivity growth. In this Economic Outlook trade growth is projected to increase from a dismal ratio of global trade-to-GDP growth of around 0.8 to be about on par with global output growth – remaining much less than the multiple of 2 enjoyed over the last few decades. This sluggish trade growth compared to historical experience shaves some 0.2 percentage point from total factor productivity growth – which may seem minor – but is meaningful given the slow productivity growth of some 0.5% per year during the postcrisis period.

Some argue that slowing globalization would temper the brunt of adjustments to workers and firms. This Economic Outlook suggests that protectionism and inevitable trade retaliation would offset much of the effects of the fiscal initiatives on domestic and global growth, raise prices, harm living standards, and leave countries in a worsened fiscal position. Trade protectionism shelters some jobs, but worsens prospects and lowers wellbeing for many others. In many OECD countries, more than 25% of jobs depend on foreign demand. Instead, policymakers need to implement the structural policy packages that create more job opportunities, increase business dynamism, promote successful reallocation and enhance policies to ensure that gains from trade are better shared. Fortunately, the country-specific policy packages that make fiscal initiatives more effective in promoting demand growth and supply potential also help to make growth more inclusive.

The transition path to a more balanced policy set and higher sustainable growth involves financial risks. But so too does the status quo dependence on extraordinary monetary policy. Pricing distortions in financial markets abound. Yield curves are still fairly flat, with negative interest rates. Pricing of credit risk has narrowed even as issuance of riskier bonds has increased. Real estate prices continue to advance in many markets, even in the face of attempted tempering by macro-prudential measures. Expectations in currency markets are on edge as evidenced by high measures of currency volatility. These financial distortions and risks expose vulnerable balance sheets of firms in emerging markets, and challenge bank profitability and the long-term stability of pension schemes in advanced economies.

The fiscal initiatives in conjunction with trade and structural policies, as outlined in the scenarios in this Economic Outlook, should revive expectations for faster and more inclusive growth, thus allowing monetary policy to move toward a more neutral stance in the United States at least, and possibly other countries as well. The risk of a growing divergence in monetary policy stances in the major economies over the next two years could be a new source of financial market tensions even as growth picks up, thus putting a premium on collective action by countries to revive growth in tandem.

In sum, policymakers should closely examine fiscal space; low interest rates enable many countries to boost hard and soft infrastructure and other growth-enhancing initiatives. Avoiding trade pitfalls, coupled with social measures to better share the gains from globalization and technological change, are key policy priorities. Using the window of opportunity created by monetary policy and following through on fiscal and structural measures should raise growth expectations and create the necessary momentum for the global economy to escape the low-growth trap.

Further reading:

OECD Economic Outlook

Using the fiscal levers to escape the low-growth trap

The effect of the size and mix of public spending on growth and inequality


Time to deploy the fiscal levers actively and wisely

by Catherine L. Mann, OECD Chief Economist, OECD Economics Department

The role of fiscal policy has been at the heart of the policy debate since the financial crisis. With the global economy stuck in a low-growth trap and monetary policy overburdened, it is time to re-assess the use of fiscal policy levers.

Government interest payments have fallen sharply as interest rates have declined to very low levels, freeing up cash. In addition, new OECD estimates show that “fiscal space” – the gap between current government debt and levels at which market access would be compromised – have widened since 2014, as lower interest rates have more than offset headwinds from lower potential growth. This creates a window of opportunity.

fiscal-levers-two

Most OECD governments have space to pursue a ½ percent of GDP deficit-financed “fiscal initiative” to support productivity-enhancing measures for 3-4 years without increasing public debt in the medium term. The withdrawal of deficit financing after the initial fiscal initiative and the outcome of higher growth from the initiative are enough to ensure that debt sustainability does not deteriorate, while the low interest rate environment means that stimulus is not crowded out.  The benefits are greater if boosting short-term activity helps to avoid high and persistent unemployment, if countries reduce regulatory burdens, and if countries undertake these efforts collectively.

fiscal-matrix

While it may be easy to relax the fiscal stance, the success of the fiscal initiative to promote growth, enhance long-run potential output, and improve debt sustainability depends on an effective strategy of additional spending or tax reductions to achieve more inclusive and higher growth.

Several major economies are now using the fiscal levers more actively, following the consolidation of the years following the crisis. But, some countries – notably in Europe – have yet to seize the opportunity.

However, are countries using the fiscal levers more wisely? The evidence of recent years is that many countries have cut the share of spending on investment and education, while increasing the share of taxes that are most harmful to growth and equality. A shift toward a more effective mix is needed.

The OECD is today releasing new research on the mix, size and quality of public investment, including a new dataset on the composition of public spending. Soft investment, such as skills and R&D, together with well-governed public investment in infrastructure, can yield large growth gains. Good institutions enhance the effectiveness of government spending and tax policy.

The policy debate will continue, but now is the time to deploy the fiscal levers actively and wisely !

References:

OECD (2016), “Using the fiscal levers to escape the low growth trap“, in OECD Economic Outlook, Volume 2016 Issue 2, OECD Publishing, Paris.

Mourougane, A., J. Botev, J-M. Fournier, N. Pain and E. Rusticelli (2016), “Can an increase in public investment sustainably lift economic growth?” OECD Economics Department Working Papers, No. 1351, OECD Publishing, Paris.

Botev, J., J-M. Fournier and A. Mourougane (2016), “A reassessment of fiscal space in OECD countries“, OECD Economics Department Working Papers, No. 1352, OECD Publishing, Paris.


Most countries have room to increase public investment

by Jean Marc Fournier, Economist, Public Economics Division, OECD Economics Department

Public investment benefits current as well as future generations. My research shows that public investment is a game changer, when it comes to boosting long-term growth. Increasing the share of public investment in primary government spending by one percentage point (offset by a reduction in other spending) would increase the long-term GDP level by about 5%. For countries that are catching-up to the productivity frontier, there is also evidence that public investment can substantially speed up the pace of convergence.

Public investment is good for economic activity because it stimulates private investment. Indeed, a recipe that mixes public and private investment produces a bigger economic pie. For instance, roads and railways connect firms. This suggests that the most relevant investment projects are those with the largest spill-overs. For instance, investment in health (hospitals and their equipment) is found to have a large effect as healthier workers are more productive. Investment in research and development also can have a particularly large effect as public research can spur private innovation.

The long-term effect of public investment depends on the initial level of the public capital stock, which includes, for instance, roads, schools or patents. In countries where this initial level is relatively low compared with the size of the economy, there is more scope for high-yielding investment projects. The analysis shows that virtually all countries have room to expand the public capital stock, with the exception of Japan, where it is already very large (Figure).

estimates-of-decreasing-returns-to-public-investment

The evidence that the public capital stock is below its optimal level means that public investment should rise above the pre-crisis level. However, the opposite has happened. In most countries, public investment has declined substantially during the recent fiscal consolidation period. In 2015, net investment was even negative in Germany, Italy, Portugal and Spain. This means that public investment does not suffice to compensate for the natural depreciation of the existing public capital stock in these countries. In the United States, net investment has reached an almost record low level of 0.5 per cent of GDP in 2015, so that the public capital stock grows much less than GDP.

Major challenges are to identify the right investment projects, and to implement them in an efficient way. For this, governments need sound public investment policies (provide the right incentives, carry out cost/benefit analysis underpinned by good data). Moreover, the focus should be on projects with high spill-overs.

References:

Source: Fournier, J.M. (2016), “The Positive Effect of Public Investment on Potential Growth”, OECD Economics Department Working Paper, No. 1347, OECD Publishing, Paris.

Related material see:

The effect of the size and mix of public spending on growth and inequality

Using the fiscal levers to escape the low-growth trap


The gig economy will not abolish working 9 to 5

by Rory O’Farrell, Economics, OECD Economics Department
Today’s post is also being published by the OECD Insights Blog

gig-economy2

There is little new about the ‘gig economy’. The word ‘gig’ originates from 1920s jazz musicians who played a small concert or ‘engagement’ at a venue. Dolly Parton may have sung about working 9 to 5, but her life was moving from one gig to another.  We have always had plumbers, electricians, and lawyers who do temporary work, and are not paid by clients when they are idle. However, do new apps such as Uber or Deliveroo mean the end of the 9 to 5 job, and do these platforms need to be regulated?

Similar to the introduction of the Yellow Pages phone directory, new smart phone apps lower the cost of collecting information and searching for a worker. Apps can show when people are available, their current location, and offer reviews of a worker’s reliability. Such ease of use may increase demand for gig services, and estimates of those working through such apps range from 0.5% to 3.5% of the workforce in advance economies. This, combined with scalability, allows new services to be provided such as food delivery from small restaurants, whereas before the market lacked the depth to be viable.

Though apps have been described as providing large scale efficient marketplaces, they may have market power. Certain aspects can lead apps to become a natural monopolies, and they may warrant regulation. As an app reduces search costs there is little point in having several apps providing related information. Apps benefit from ‘network externalities’, whereby the value of being connected with an app increases with the number of other users. Over time one app could become the access point for a gig service, similar to how supermarkets are for food.

There may also be high switching costs for gig workers, allowing app owners to extract rents. In an information age, reputation can be a worker’s most valuable asset. If a worker has established a reputation (via online reviews) with one platform, this reputation capital may be lost if the worker switches platforms. App owners can extract some of the value of the reputation. However, allowing the “portability” of workers’ existing good ratings from one platform to another would lessen the dependency of workers upon single platforms.

As much work happens in spurts, employers often value flexibility, and apps can help firms outsource tasks. Managers trade off the cost of having a worker on standby against the cost of disruption when a crucial worker is unavailable in a crisis. This is why factories often permanently employ electricians, and banks hire IT specialists. Though apps can lower the length of such disruptions, the effect is likely to be small. Having employees is like insurance, and is cheaper for lower paid workers.

Despite the advantages of flexibility, firms still hire staff. Search costs remain, especially for high-skill jobs. Reviews on apps do not provide the information that a standard job interview does. Once a firm finds a suitable worker, it may be cheaper to offer them a full-time job than pay the costs of constantly searching for staff, and giving firm-specific training. The cost of integrating a worker in a team is also likely to increase with the complexity of the job.

Also, whether someone does a good job can be difficult to monitor, and apps have not overcome this. This is especially the case for high-skill jobs and it can take a long time to discover whether the worker is doing a good job or not. This helps explain why people use legal firms rather than directly employ lawyers for complicated tasks (as the law firm itself has built up a reputation) but a local lawyer for conveyancing or drawing up a will. Self-employment works best when it is easier to assess the service provided than the effort a worker expends on providing it. This is why truck drivers were self-employed before on-board recorders were invented, but now tend to be employees.

Although the ‘gig economy’ refers to self-employed workers, in recent years firms have looked for more flexibility among employees, especially in the low-paid retail and hospitality sectors. There has been a move to an “on demand” or “just-in-time” workforce. While many of these long-term changes were likely driven by changes in regulation (such as for shop opening hours), technology has cut the cost of posting rosters, allowing them to be changed more frequently. Employers can now use software to notify staff of rosters, rather than phoning each member of staff, and it is now common for such workers to be texted their hours at the beginning of the week.

Maintaining a pool of idle workers so as to have such flexibility in the economy is not free, and firms will try to shift such costs on to the workforce and the social welfare system.  Ever since employers have had the obligation to pay social security contributions or give paid holidays, there has been a need to define whether a worker is self-employed or an employee. In a recent court case in London, it was found that Uber drivers were employees due to their lack of control over their work, such as the ability to set fares. Though some workers (such as students) may want flexible work, there is strong evidence that most low-pay, low-hours workers want more hours, or at very least certainty over weekly rosters. There is a paradox of flexibility. Irregular rosters can make it more difficult for workers to arrange childcare, take on a second job, or have a normal social life. Apps may help to reduce some of these frictions, but will not eliminate them.

Unfortunately research on the ‘gig’ economy has been hampered by the lack of data. Important questions remain, such as to what degree do consumers benefit from apps, who bears the costs of flexibility, and what level of flexibility is optimal. Such research will likely be an ongoing project, not a one-off gig.

References:

Eurofound, (2015), New forms of employment, Publications Office of the European Union, Luxembourg.

Katz, L. F. and A.B. Krueger (2016), “The Rise and Nature of Alternative Work Arrangements in the United States, 1995-2015”, National Bureau of Economic Research Working Paper Series, No. 22667. doi: 10.3386/w22667

Manyika, J., S. Lund, J. Bughin, K. Robinson, J. Mischke, and D. Mahajan (2016) Independent Work: Choice, Necessity, and the Gig Economy, McKinsey Global Institute.

OECD (2016), “Anticipating Change: Work, Skills and Job Quality”, Background Document: Meeting of the Council at Ministerial Level 1-2 June 2016, DELSA/ELSA(2016)8/REV1

Smith, R., and S. Leberstein (2015), Rights on Demand: Ensuring Workplace Standards and Worker Security In the On-Demand Economy, National Employment and Law Project.

STEFANO, V. D. (2016), “The rise of the ‘just-in-time workforce’: On-demand work, crowdwork and labour protection in the ‘gig-economy’”, Conditions of Work and Employment Series, No. 71 .


Boosting productivity is key for Malaysia to attain high-income-country status

By Hidekatsu Asada, Head of the Southeast Asia desk, Country Studies Branch, OECD Economics Department

Productivity growth is essential for living standards to durably improve. Malaysia has reached a development stage where growth needs to be driven more by productivity gains than the sheer accumulation of capital and labour inputs. The 11th Malaysia Plan (2016-20) sets an ambitious labour productivity growth target of 3.7% per year, well above than the 2% average growth recorded from 2011 to 2015 (Figure 1). The first OECD Economic Assessment of Malaysia calls for coordinated structural reforms to achieve the productivity improvements needed for Malaysia to attain high-income-country status.

malaysia-blog-2-fig-1

To boost productivity, three priority areas for further reform stand out.

First, enhancing the quality of education is critical to increase the availability of skilled workers and improve Malaysia’s attractiveness for investment in higher value-added activities. Improvement in teachers’ evaluation, training and upskilling is necessary to raise basic education outcomes. Enrolment in tertiary level education has expanded, but graduates often lack the skills required by industry. To narrow the skills mismatch in the labour market, more focus should be put on vocational education and training.

The second priority is improving the regulatory framework. Malaysia’s efforts to create a more business-friendly environment through regulatory reform resulted in the country ranking 18th in the World Bank’s Ease of Doing Business 2016. But observation of OECD best practice suggests Malaysia could do even better. Implementation of competition policy could be strengthened further by enhancing the independence and funding of the regulator. Productivity could be boosted by facilitating the entry of innovative firms and the exit of unproductive ones. With this in mind, a key recommendation is the reform of rigid bankruptcy laws in line with OECD standards.

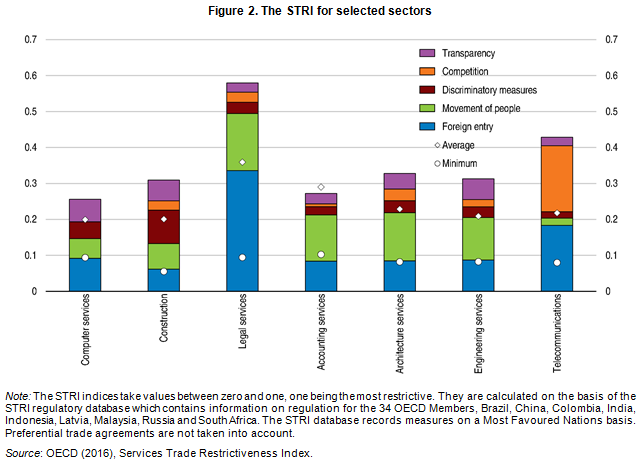
Thirdly, further investment liberalisation will also boost growth in the services sector and enhance competitiveness. Indeed, a set of indicators measuring restrictions to services sector trade (the OECD’s Services Trade Restrictiveness Index ‒ STRI) was computed for the first time for Malaysia, revealing that the country has more restrictive regulations than the average of OECD member countries and major emerging economies (Figure 2).

malaysia-blog-2-fig-2

Reference

OECD (2016), OECD Economic Surveys: Malaysia 2016: Economic Assessment, OECD Publishing, Paris.


Successful macro transformation in Malaysia, but challenges remain

By Mohamed Rizwan Habeeb Rahuman, Economist, Southeast Asia Desk, Country Studies Branch, OECD Economics Department

Malaysia has sustained rapid and inclusive economic growth for close to half a century, as documented in the OECD’s first Economic Assessment of Malaysia (OECD, 2016). Real GDP growth has averaged 6.4% per year since 1970, outperforming most of its regional peers (Figure 1). In the process, the Malaysian economy has undergone a dramatic transformation from dependence on agriculture and commodity exports to a more diversified and open economy with strong links to global value chains. Growth has been driven by a series of structural reforms that began in the 1970s. Malaysia harnessed its favourable geographical location on global trade routes to promote export-oriented industrialisation, encouraging regional integration through a relatively open environment to trade and investment. This has facilitated the development of manufacturing, boosting growth, employment and productivity by expanding access to global markets, capital, knowledge and technology. More recently, real GDP growth averaged 5.3% per year between 2011 and 2015, led mainly by domestic demand, with the services sector now representing more than half of GDP.

malaysia-blog-1-fig-1

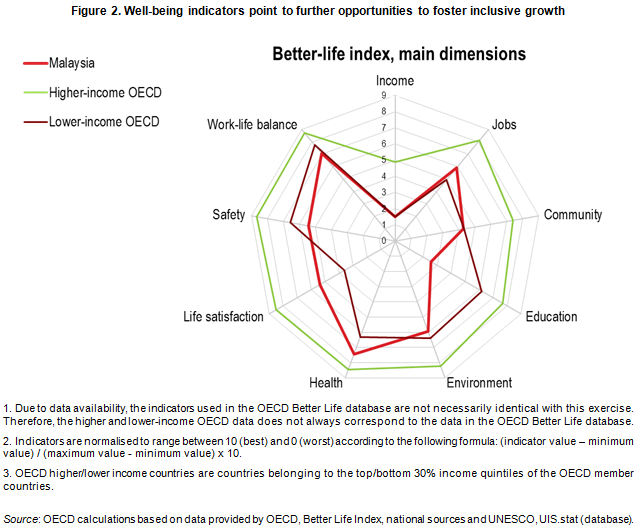
Malaysia’s aspiration to attain high-income country status involves striving for greater inclusiveness. It scores well on some indicators in the OECD Better Life Index, in particular long-term unemployment. However, the index illustrates relative weakness in areas such as educational attainment and skills, as well as personal earnings. It also highlights the need to further improve healthcare to increase healthy life expectancy (Figure 2).

malaysia-blog-1-fig-2

In the face of external headwinds, growth slowed down to just over 4% year-on-year in the first half of 2016 but is projected to remain resilient at around this pace in the remainder of 2016 and in 2017 thanks to the continuing strength of domestic demand, even though momentum will be held back by the subdued pace of the global economy and still low commodity prices. Trade will continue to grow at a slower rate than GDP in line with slowing global trade, which affects the growth potential of trade-exposed emerging market economies like Malaysia (134% of GDP in 2015).

The balance of risks to growth is tilted to the downside and stems mainly from external factors. A more rapid than foreseen normalisation of United States monetary policy would entail a downside risk to the projections, as open emerging market economies such as Malaysia are vulnerable to capital outflows. While Malaysia has diversified its economy and reduced its dependence on oil for government revenue, 19% of exports were agricultural and mining goods in 2015 and around 15% of government revenue is still oil-related in 2016. Thus, if commodity prices were to fall further, the trade balance, corporate profits and fiscal revenue would be negatively affected. On the upside, higher crude oil prices, accelerating inflows of tourists from Asia, or higher-than-forecast palm oil prices if unfavourable weather conditions continue to affect production, could see growth exceed projections.

Reference

OECD (2016), OECD Economic Surveys: Malaysia 2016: Economic Assessment, OECD Publishing, Paris.


Unleashing private sector productivity in the United States

By Douglas Sutherland, Head of US Desk, OECD Economics Department

With the global economy mired in low-growth and no signs of strong acceleration, a lot of attention has been paid to the meagre pace of productivity growth in OECD countries. In the United States, the most watched indicator of productivity (nonfarm business productivity growth) decelerated about ¾ percentage point from 2009 to 2014 relative to the preceding 5-year period. This is not just the result of the crisis holding back investment. Productivity growth had already been slowing from the early 2000s.

Economic research reveals competitive markets stimulate productivity: faced with competitors, firms survive by becoming more efficient and bringing new products to the market. Competitive markets see a lot of firm entry and exit. However, this dynamism has declined: new firms are not being created as frequently as in the past (See figure, top panel) and the most productive of these firms are not growing as fast as they once did. This matters because advances in productivity typically result from the rapid growth of young dynamic firms. Instead, start-ups appear to be failing more often and the remaining firms are getting older with larger firms increasingly dominating markets (See figure, bottom panels).

sutehrland-prod-and-us

When this happens, markets become more concentrated, with large incumbent firms gaining market power. This has many disadvantages because gains in productivity are not being passed onto consumers in lower prices or to workers in higher wages. The US is often considered as a very competitive and dynamic marketplace – and it is to a large extent – but it has become less so for some time because of developments such as digitalilisation facilitating “winners take all” and anti-trust becoming less stringent than it used to be. Faced with these worrying trends, competition/anti-trust policy needs to adapt. This is particularly the case in markets transformed by digitalisation, financial innovation and globalisation – such as e-commerce and those dependent on access to information. The decline in business dynamism sometimes comes from barriers to competition being erected by the States. For example, state-level prohibitions on municipalities creating their own fixed broadband networks have hindered the development of stronger competition in this sector. In other cases, States have blunted competitive pressure through imposing state-specific occupational licensing requirements. As a result dynamism and competition can vary across states because of the importance of local administration in regulating markets with some states being very dynamic whereas others are not.

Amongst other factors, changes to bankruptcy laws have also contributed to more sluggish business formation. Reforms in 2005 increased the cost of bankruptcy for failed entrepreneurs and made it more difficult for them to try again (see the recent Ecoscope blog on the importance of this for productivity growth). The reforms appear to have stymied the creation of sole proprietorships and partnerships, particularly in States that do not exempt some of the entrepreneur’s assets from bankruptcy proceedings. Given the importance of bankruptcy for long-run prospects, a better balance needs to be struck between supporting entrepreneurship and creditor rights.

References:

Millar, Jonathan and Douglas Sutherland (2016), “Unleashing private sector productivity in the United States”, OECD Economics Department Working Paper no. 1328.

OECD (2016), Economic Surveys: United States 2016, OECD Publishing, Paris.


Labour mobility in the European Union: a need for more recognition of foreign qualifications

by Jan Stráský, Economist, OECD Economics Department

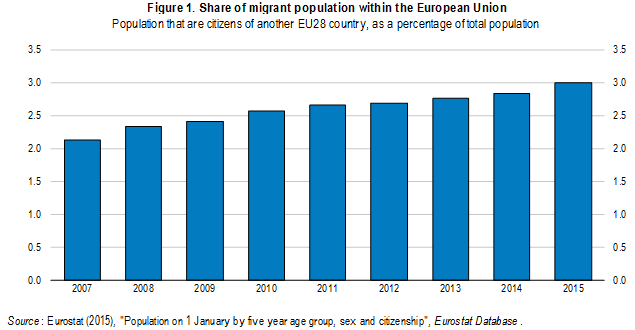
Labour market mobility in the European Union is increasing (Figure 1), but it remains too low to provide sufficient adjustment in the face of diverging labour market developments. This situation reflects non-policy factors, such as linguistic and cultural differences, but also policy barriers. In particular, difficulties in the recognition of professional qualifications are still a major hurdle.

eu-stratsky-1

Improvements in foreign language proficiency take time and require long-term policies. Publicly funded language courses aimed at cross-border workers are a useful tool, and should be provided. Even more important is to improve foreign language proficiency at an earlier stage, for example by considerably expanding the Erasmus student exchange programme that currently benefits only about 5% of European graduates.

Policy barriers to labour mobility in the EU have been reduced by a broader use of electronic procedures, such as the European Professional Card and the planned electronic passports for services. However, more is needed. The European Professional Card needs to be extended to other qualifications, such as engineers. Countries should be restricted in their ability to invoke “public interest” to discriminate against foreign suppliers of regulated professional services. Regulatory barriers arising from diverging legal form and other organisational requirements should be addressed. Most reforms in services between 2012 and 2014 took place in countries under financial assistance, while other countries did not act on their recommendations.

The differences in regulation across the EU remain high and affect also the number of recognitions of professional qualifications. Some countries have awarded a large number of recognitions, while others did not, despite being parties to the same mutual recognition directives (Figure 2, panel A). Moreover, countries with the lowest barriers to entry into professions may face the highest barriers to providing services abroad. For instance, when engineering is not a regulated profession, the barriers to entry are low for nationals and foreigners alike. Countries that regulate engineering through licensing, however, often create insurmountable obstacles to engineers from unregulated countries.

Although in the EU as a whole only some 5% of applications for recognition of qualifications eventually get rejected, there are considerable differences in rejection rates across the member states (Figure 2, panel B). Slow and overly heterogeneous procedures can still constitute a barrier to labour mobility, even if decisions are eventually positive. The EU should monitor improvements and best practice and develop further the possibility of partial recognition instead of rejection, complemented by shortened additional education. Bolder changes to the existing process would involve extending the scope of automatic recognition to other professions and making wider use of the European framework for comparison of national qualifications.

eu-stratsky-2

References:

OECD (2016), Economic Survey of the European Union 2016, OECD Publishing, Paris.

Stráský, Jan (2016), “Priorities for completing the European Union’s single market”, OECD Economics Department Working Paper no. 1315.