The Best vs. the Rest: The Global Productivity Slowdown Hides an Increasing Performance Gap across Firms

By Dan Andrews (Senior Economist, Economics Department), Chiara Criscuolo (Senior Economist, Directorate for Science, Technology and Innovation) and Peter Gal (Economist, Economics Department)

Well-known global companies such as Google, Apple and Amazon of the digital era as well as more traditional ones of the likes of BMW, L’Oreal and Nestlé have recorded impressive productivity gains over the 2000s as they created more and more revenue per employee. At the same time, aggregate productivity growth in the OECD – that reflects the performance of all businesses not just the few most successful ones – has stagnated. What explains this discrepancy?

We reconcile the apparent success of a few firms with the poor performance of the economy as a whole. Our analysis based on several million company accounts indeed shows that very strong labour productivity performance of the best firms (the frontier) has been accompanied by a persisting large productivity gap between them and all the other businesses. Worryingly, this gap has been growing over time. This pattern also remains after accounting for differences in investments (in machinery, equipment and structures as well as R&D, data and software) and market power across frontier and non-frontier firms. This suggests that the productivity divergence may in fact be driven by a growing difference in innovation performance in a broad sense.

What could explain these patterns? Ongoing structural trends in the global economy – namely digitalisation, globalisation and the rising importance of tacit knowledge – likely have contributed to the rapid productivity gains at the global frontier. Indeed, multifactor productivity (MFP) divergence is strongest among information and communication (ICT) services (Figure 1). These are sectors where “winner-takes-all” dynamics are likely to be more relevant, given very low marginal costs. This makes upscaling a product or service much easier and cheaper, and combined with powerful network effects can lead to the most successful producer capturing the whole or the large part of the market. The examples of Google as the main search engine or Amazon as the largest online retailer illustrate this point.

winner-takes-all-prod

Yet, aggregate productivity performance was significantly weaker in sectors where divergence was more pronounced, suggesting that these patterns do not solely reflect frontier firms pushing the technological boundary. Instead, it could reflect a slowdown in the diffusion of best business practices from the frontier to other firms. One symptom of stalling diffusion is that it has become more difficult for laggard firms to join the frontier. More broadly, this phenomenon could be a reflection of increasing costs for laggard firms of moving from an economy based on production to one based on ideas.

This brings us to the role of incentives of the laggard firms to adopt best practices. A key concern is that market contestability has weakened, given the decline in firm entry and increasing share of firms surviving on the margins of exit. This highlights the potential for policy to boost growth by promoting market competition, especially in services which are generally more sheltered from international markets. This would also create better conditions for growth-enhancing reallocation through the entry of more productive businesses and the exit of less successful ones. In fact, we find the rise in productivity divergence between the best firms and the rest to be much more extreme in sectors where the pace of pro-competitive product market reforms was slowest (Figure 2). In sum, while structural changes in the global economy meant that technological diffusion became more difficult for the typical firm over the 2000s, these difficulties were compounded by policy weakness that needs to be remedied if aggregate productivity has to rise faster than in the recent past.

role-of-policy-prod

References

Andrews, D., C. Criscuolo and P. Gal (2016), ” The Best versus the Rest: The Global Productivity Slowdown, Divergence Across Firms And the Role of Public Policy”, OECD Productivity Working Papers, No. 5, OECD Publishing, Paris. DOI: http://dx.doi.org/10.1787/63629cc9-en


Inequality in Denmark through the looking glass

By Mikkel Hermansen, Structural Surveillance Division, OECD Economics Department

Although Denmark is one of the least unequal countries in the world, it has like many other OECD countries experienced a rise in income inequality. But by exactly how much has the Gini coefficient risen over the last decades? There is significant disagreement between various official sources (Figure 1): The Danish government and Statistics Denmark report a substantial increase, of 5.7 Gini points, since 1990, whereas the OECD figures only convey a rise of 3.1 Gini points (close to the OECD average; see OECD, 2015). And while national sources agree on the trend, they diverge on the level by almost 2 Gini points (26.2 for Danish government vs 27.9 for Statistics Denmark in 2013). While such measurement muddle may seem uninteresting, it emphasises how crucial methodological choices can be for inequality assessments. In this respect, Denmark is an interesting laboratory due to high-quality administrative data and almost full population coverage. In Causa et al. (2016) we therefore uncover the methodological differences behind the development illustrated in Figure 1.

gini-denmark

The differences between inequality trends reported by international and national sources are mainly due to differences in the treatment of:

  • Negative income elements: e.g. from indebted households paying interest expenses and from self-employed experiencing transitory income losses. Negative income elements are set to zero by the OECD to ensure cross-country comparability, which significantly raises the inequality level compared to the Danish government in the 1990s and early 2000s. One can think of individuals with high interest expenses, who typically also have high incomes from employment and therefore appear even more affluent from this adjustment.
  • Unmeasured housing services enjoyed by homeowners relative to tenants: to ensure comparability in living standards between homeowners and tenants it is possible to estimate the value of self-provided housing services and add this to homeowners’ income – the so-called imputed rents. National statistics include imputed rents, whereas they are excluded from OECD figures because of poor cross-country comparability. Along with the decline in interest rates from 2000 onwards and a house price boom in Denmark, imputed rents have driven up the Gini coefficient reported by national sources compared to the OECD.

Two other methodological differences mainly influence the reported level of inequality:

  • What defines a household? International standards define a household as a group of people living together, while the Danish institutions also impose that they have family ties and this tends to raise inequality because of more and smaller households.
  • How much economies of scale do people living together enjoy? A household of four can share many goods and do not need to spend four times as much on heating and electricity as a lone-person household. Material living standards of households of different sizes can be made comparable by use of an “equivalence scale” (for OECD figures calculated as the square root of household size). In the case of Denmark, the three institutions use three different scales.

Who is right about inequality in Denmark then? Well, that would depend on the purpose. For international comparisons one should obviously use OECD figures that comply with the same international statistical protocols and conventions. But from a national perspective, statistics produced by the government and Statistics Denmark are better tailored to the data source and can provide a more comprehensive picture.

References

Causa, O., M. Hermansen, N. Ruiz, C. Klein, and Z. Smidova (2016), “Inequality in Denmark through the Looking Glass”, OECD Economics Department Working Paper, No. 1341, OECD Publishing, Paris, http://dx.doi.org/10.1787/5jln041vm6tg-en.

Ministry of Economic Affairs and the Interior (2015), Familiernes økonomi: fordeling, fattigdom og incitamenter 2015 (Household Finances: Distribution, Poverty and Incentives 2015), Copenhagen.

OECD (2015), In It Together: Why Less Inequality Benefits All, OECD Publishing, http://dx.doi.org/10.1787/9789264235120-en.

Statistics Denmark (2016), Indkomster 2014 (Household Incomes 2014).


Weighing up the Growth Dividends from Structural Reforms

by Balázs Égert and Peter Gal, OECD Economics Department

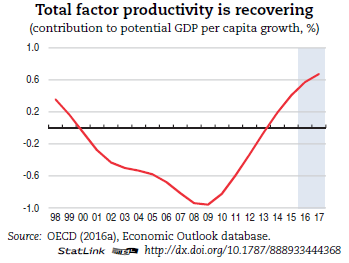
In many OECD countries, economic growth has yet to recover the lost ground suffered in the aftermath of the financial crisis. In some of them, unemployment has been persistently high, investment rates disappoint, and productivity is extremely sluggish – a “low growth trap”. Put differently, all three sources of sustainable long-run growth under-perform. This jeopardizes societies’ ability “to make good on its promises to current and future generations – to create jobs and develop career paths for young people, to pay for health and pension commitments to old people”. (OECD, 2016). While this partly reflects the persistent weakness of demand in some cases (Mann, 2016), there are policy tools available that affect the long-run productive capacity of the economy, or potential growth. Our recent work takes a fresh view on the relative payoffs in terms of raising future growth (Égert and Gal, 2016). We study how various product and labour market policies and regulations affect per capita income growth over different horizons and through the three supply-side channels: multi-factor productivity (MFP), capital deepening and employment.

We find that product market regulation (PMR) reforms have the largest overall direct policy impact: reducing regulatory barriers to competition induce a cumulative increase of 0.7% of GDP per capita over a 5-year horizon. Other policies with considerable overall effects include increased spending on active labour market policies (ALMPs), a reduction in labour tax wedge, in the minimum wage or in the length of maternity leave with impacts ranging from 0.3% to 0.5%. Typical reforms in other policy areas tend to have a smaller impact on per capita income (Figure 1).

impact-reforms-on-gdp-egert1.

Different policies have different impacts on the separate supply-side components. For instance, PMR affects each of them, while labour market policies tend to impact only employment. Exceptions are ALMPs, which affects both productivity and employment, and EPL, which drives both capital deepening and employment. Finally, the corporate tax has an effect only on capital deepening, while R&D impacts only productivity (Figure 2).

The policy effects differ over longer horizons. For instance, the overall long-term effects on GDP per capita of PMR, employment protection (EPL) and ALMP spending are considerably larger than the 5-year impacts. This is mainly due the fact that MFP and capital are slower to react to reforms, compared to employment (Figure 1).

These results are based on past policy changes and assume that the impacts are uniform across countries and various institutional settings. But the estimation results shown in Figures 1 and 2 could be used as a starting point to provide precious help for policy makers for the elaboration of comprehensive structural reform packages. Depending on the ease with which reforms can be implemented, policies could be picked to reach policy objectives in terms of overall impact on per capita income. A natural follow-up to our paper would be to extend it to take into account country specificities and differences in the initial policy and institutional settings. Also, the enriched framework could be used to build an interactive policy simulator, which would help policy-makers to figure out the impact of planned reforms and to design comprehensive policy packages to achieve objectives such as a given increase in per capita income over a given horizon.

struc-ref1struc-reform-gal

Note: *Typically observed reforms are measured as the average improvements in the policy indicators over all two year windows that show improvements in both periods (see Table 5, column 4). The employment rate effects use all three aggregation approaches, and the size of the effects is indicated by numbers for the aggregation using demographic groups. See details in Egert and Gal (2016)
Source: Égert, B. and P. Gal (2016), “The quantification of structural reforms in OECD countries: a new framework”, OECD Economics Department Working Papers, No. 1354, OECD Publishing, Paris.

References

Égert, B. and P. Gal (2016), “The quantification of structural reforms in OECD countries: a new framework”, OECD Economics Department Working Papers, No. 1354, OECD Publishing, Paris.

Mann, C. L. (2016), “Deploy effective fiscal initiatives and promote inclusive trade policies to escape from the low-growth trap” ECOSCOPE, November 28.

OECD (2016), “Economic Outlook”, Vol 2016(1).


The Walking Dead: Zombie Firms Stifle Economic Recovery Prospects

By: Müge Adalet McGowan, Dan Andrews and Valentine Millot – Structural Policy Analysis Division, Economics Department, OECD.

With the global economy stuck in a low growth trap, it is crucial to understand the factors behind the weak recovery in potential output growth, and particularly the barriers to productivity growth. New research shows that this dynamic can be partly understood in terms of the increasing survival of zombie firms – i.e. those firms that would typically exit in a competitive market but are being kept alive by creditors or policy weakness. Today, a key risk is that zombie firms may depress creative destruction, crowd-out growth opportunities for healthy firms and underpin a period of macroeconomic stagnation, just as they did in Japan in the 1990s (Caballero et al., 2008).

In a number of countries, the prevalence and productive resources sunk in “zombie” firms – defined as old firms that have persistent problems meeting their interest payments – has risen since the mid-2000s (Figure). In Italy, for example, the share of the industry capital stock sunk in zombie firms rose from 7% to 19% between 2007 and 2013. This is problematic because zombie firms can congest markets and reduce industry profitability – by inflating wages relative to productivity and depressing market prices – which deters the expansion of healthier firms, especially recent entrants.

zoombie-walking-dead

Econometric analysis shows that when more industry capital is sunk in zombie firms, the typical non-zombie firm undertakes less investment than otherwise. But the story does not end there because zombie congestion disproportionately crowds-out the growth of more productive firms, thus slowing productivity-enhancing capital reallocation and aggregate multi-factor productivity (MFP) growth.

The rise of zombie congestion can be connected to the collapse in OECD potential output via two key channels: weaker business investment and MFP growth. For example, simulations show that had the zombie capital share not risen from its pre-crisis levels:

  • Investment of a typical non-zombie firm in Italy could have been around 6% higher in 2013. This can account for one-quarter of the actual decline in aggregate private non-residential business investment in Italy between 2008 and 2013.
  • Aggregate MFP could have been 0.7% to 1% higher in Italy and Spain respectively, owing to more efficient capital reallocation. This is significant given that in both countries, MFP subtracted significantly from potential growth over the past decade.

In some countries, these problems are likely to be symptomatic of weak insolvency regimes and a slowdown in the pace of product market reforms. But zombie firms may also be kept alive by bank forbearance and the persistence of crisis-induced SME support policy initiatives. While reforms in these areas may help revive productivity growth, it is crucial that they are flanked by well-designed active labour market policies, which have been shown to be effective at returning workers displaced by firm exit to work (see recent Ecoscope blog).

References

Adalet McGowan, M., D. Andrews and V. Millot (2017), “The Walking Dead? Zombie Firms and Productivity Performance in OECD Countries”, OECD Economics Department Working Paper No. 1372.

Caballero, R., T. Hoshi and A.K. Kashyap (2008), “Zombie Lending and Depressed Restructuring in Japan”, American Economic Review, 98(5), pp. 1943-1977.


Does growth lead to inequality? It depends.

By Orsetta Causa, Mikkel Hermansen and Nicolas Ruiz, Structural Surveillance Division, OECD Economics Department

Widespread increases in inequality over the past three decades have raised the question of whether growth in itself is a driver of income inequality. Considering that correlation often tells little about causation, this question is less trivial than may appear at first glance. Indeed, the concomitant rise in GDP per capita and income inequality does not, per se, imply any causal relationship from the former to the latter. Research efforts have offered mixed conclusions so far and the growth and inequality question has been at the centre of a long-standing controversy among economists (Dollar et al. 2015). New OECD research by Hermansen et al. (2016) shows that in order to provide a convincing answer, the question needs to be framed more specifically.

First, the mechanisms that link growth and inequality are likely to differ depending on the location of inequality, i.e. at the bottom, in the middle, or at the top of the income distribution (Barro, 2000). Hence, a single inequality measure such as the Gini coefficient may end up capturing relatively unimportant average effects. Second, the mechanisms that link growth and inequality are likely to differ depending on the sources of growth, in particular whether growth in GDP per capita is driven by growth in productivity or growth in employment. Third, they are also likely to differ depending on whether one considers income inequality before or after government redistribution, that is, inequality in market incomes, i.e. income derived before taxes and transfers, or inequality in disposable income, that is, income after taxes and transfers.

Using a novel empirical framework, Hermansen et al. (2016) shed new light on the old growth and inequality nexus by assessing the impact of growth on household incomes across the distribution, that is, progressively encompassing poor, middle class and rich households. Their conclusion is that that there is no single answer to the growth and inequality question. Labour productivity growth is found to have contributed to rising market income inequality, while this was partly mitigated through government redistribution, on average across OECD countries over the past three decades (Chart 1, Panel A). By contrast, employment growth is found to have had an equalising impact, benefiting mostly and importantly households in the lower part of the income distribution (Chart 1, Panel B). Overall, these two forces have tended to offset each other and resulted in a broadly distribution-neutral impact of GDP per capita growth, on average across OECD countries over the last three decades. So, with reducing inequality remaining a defining challenge of the post-crisis era, promoting job creation is a key policy goal, in particular where employment rates still fall short of pre-crisis levels. But, perhaps more importantly, in looking for ways to revive productivity growth, governments need comprehensive policy strategies to ensure that the gains are more broadly shared across the population.

distribution-of-growth-dividends

References

Barro, R. J. (2000), “Inequality in a panel of countries”, Journal of Economic Growth, 5: 5-32 (March 2000).

Hermansen, M., N. Ruiz and O. Causa (2016), “The Distribution of the Growth Dividends”, OECD Economics Department Working Papers, No. 1343, OECD Publishing, Paris, http://dx.doi.org/10.1787/7c8c6cc1-en.

Dollar, D. T. Kleineberg and A. Kraay (2015), “Growth, Inequality and Social Welfare: Cross-Country Evidence”, Economic Policy, Vol. 30, pp. 335-377.


Mexico’s reforms are paying off, but there is much left to do

By Sean Dougherty, Mabel Gabriel, Patrick Lenain, and Julien Reynaud, OECD Economics Department

The overall economic and social situation has improved in recent years, but important challenges remain, such as high levels of poverty, extensive informality, low female participation rates, insufficient educational achievement, financial exclusion, weak rule of law, and persistent levels of corruption and crime. To address these problems, the government has rolled out major structural reforms since 2012 aimed at improving growth, well-being and income distribution. The initial wave of reforms, kicked-off by the multi-partisan political commitments in the Pacto por México, led to notable progress across a range of areas and put Mexico at the forefront of reformers among OECD countries. Key laws and constitutional amendments were approved, and secondary laws or regulations passed.

blog-reform-mexico

Reforms have already brought short-term benefits, especially on productivity growth, and helped to mitigate exteproductivityrnal headwinds such as lower oil prices and rising US interest rates. The OECD estimated in the last Economic Survey that a subset of the Pacto por México reforms could add one percentage point to GDP growth after five years. An additional set of selected reforms could add another percentage point to GDP. Strong progress has been made to open sectors such as energy and telecoms to more competition. Institutional designs have been improved with a new National Productivity Commission, a strengthened competition authority, and expanded sectoral regulators. Initial progress has been made with education and poverty alleviation, although parts of these plans ran into difficulties that are now being addressed.

growth-disparaties

Nonetheless, large differences prevail across sectors, states, and firms – a situation not unlike that in many OECD countries. Mexico’s most productive firms are performing well, such as in the sector of transportation equipment manufacturing, but the majority of firms are still struggling to perform better, leading to a growing dispersion in productivity,  with a few leading sectors pulling ahead. Inequalities continue to grow across states and sectors, emphasising the divergence of a modern Mexico – highly productive, competing globally, mostly located at the border with the United States, in the central corridor and in tourism areas; and a traditional Mexico, less productive, with small-scale informal firms, mostly located in the South. As a result, growth has not been inclusive enough to achieve better living conditions for many Mexican families.

Addressing this divergence is the main focus of the new Economic Survey (OECD, 2017).

References:

OECD (2017), Economic Surveys of Mexico, OECD Publishing, Paris.

OECD (2015), The Future of Productivity, OECD Publishing, Paris.


Structural reforms can be inclusive; it all depends on the details

By Orsetta Causa,  Mikkel Hermansen and Nicolas Ruiz, Structural Surveillance Division, OECD Economics Department

Structural reforms are regularly assessed based on their ability to boost GDP per capita. This emphasis relies on the assumption that higher GDP per capita is systematically associated with rising living standards for the vast majority of citizens. This view is increasingly being challenged. The worrying evolution of income inequality in many countries suggests that distributional considerations need to be more systematically taken into account in policy making. In a nutshell, what are the policy options for making pro-growth policies inclusive?

New research by Causa et al. (2016) sheds some light on this question by adopting a more granular approach to the evaluation of pro-growth policies. First, the analysis delivers the effect of reforms on household incomes at the bottom, the middle and the top of the distribution. This helps to better understand the distributional implications from pro-growth reforms. In particular, it allows for distinguishing reforms that boost incomes across the whole distribution but relatively more among the rich than among the poor from those that boost incomes in the middle class and among the rich but have no effect or depress incomes among the poor. Second, the analysis considers the channels of macroeconomic growth by decomposing the policy effect into growth in employment and growth in labour productivity. This provides a better understanding of the mechanisms through which policies benefit household incomes at different points of the income distribution.

This new research conveys policy relevant messages for the growth and inequality nexus:

  • Most pro-growth policies are good for the middle class inasmuch as they tend to lift all incomes around the middle of the distribution.
  • By contrast, a number of pro-growth policies that are good for the middle class can in fact hurt the poorest. This is mostly the case of reforms to social protection and labour market policies. In particular, reductions in the generosity of unemployment benefits and social assistance are found to leave poor households behind even when such reforms generate aggregate employment gains. Policy packages can in this case be designed to mitigate trade-offs between raising work incentives and ensuring income adequacy for vulnerable households, that is, through well-targeted job-search assistance and training programmes with a view to raising employability and pay prospects among those with low skills and the long-term unemployed.
  • Other reforms can also have the opposite effects, raising income for everybody but more so for the poor than for the middle class. Such is the case of increasing public spending on education (Chart 1, Panel A), in particular on childcare and early childhood education, as this boosts growth and at the same time enhances women labour market inclusion, resulting in a decline of income inequality.

causa-ssd

Whether pro-growth reforms act via boosting productivity, employment, or both matters: this shapes their distributional implications by compounding their final effects. For example, spurring productivity by easing barriers to firm entry and competition in product markets produces strong macroeconomic gains which accrue to households at large and are fairly equally shared. Yet this reflects two distributionally-offsetting effects: higher labour productivity, which tends to benefit the most affluent households disproportionately, and higher employment, which tends to benefit the less affluent households disproportionately (Chart 1, Panel B).

So, making reforms for inclusive growth is about exploiting synergies, and designing policy packages to mitigate trade-offs. It is thus all about details. At the current juncture there is a crucial need for more growth but also to make it more inclusive. This is not out of reach as countries exhibit large room for packaging structural reforms to target both growth and equity objectives.

References

Causa, O., M. Hermansen and N. Ruiz (2016), “The Distributional Impact of Structural Reforms”, OECD Economics Department Working Papers, No. 1342, OECD Publishing, Paris, http://dx.doi.org/10.1787/5jln041nkpwc-en .


Coping with Creative Destruction: Reducing the Costs of Firm Exit

By  Dan Andrews, Head of Productivity Workstream, OECD Economics Department

Creative destruction, the process through which a market economy replaces failing firms with successful ones, is a key driver of productivity growth. Reversing the current slowdown in productivity growth will therefore partly depend on structural reforms to recharge the engine of creative destruction. This will necessarily entail a more intense churning of jobs, which implies benefits for workers via improved job-worker matching but also costs through heightened job destruction. In this context, a key question is what happens to workers who lose their jobs due to firm exit – how quickly are they re-employed and what are the policies that can aid this process?

New research shows the probability that workers displaced by firm exit are re-employed one year later ranges from at least 70% in Denmark and Switzerland to around 50% in Greece and Spain. These estimates suggest that some countries are more effective at coping with creative destruction than others. What explains these differences?

As it turns out, public policy plays a key role. Higher spending on active labour market policies (ALMPs) – e.g. retraining and job placement services – tends to boost the re-employment probability of displaced workers, while the reverse is true for spending on passive measures (e.g. generous and long-lasting unemployment benefits). This implies that a (revenue-neutral) reform that partially switches the composition of labour market expenditures towards ALMPs could be desirable in countries where spending is overly tilted toward passive measures.

Crucially, ALMPs are more powerful at raising the re-employment prospects of workers displaced by firm exit than other displaced workers. This is significant given that the former are considerably older and have been tenured at the firm for longer – characteristics which ordinarily make transitioning to other jobs more difficult. Job loss due to firm exit is also politically salient since it is typically viewed as an exogenous event that is not specifically due to the actions of the worker. One implication is that for every worker who is laid out due to firm exit, many more may fear a similar fate, which may create political resistance to reforms that intensify job reallocation.

Thus, it is crucial that structural reforms which unleash the benefits of creative destruction are flanked by well-designed ALMPs. But labour market policies alone are insufficient to cope with creative destruction. Indeed, the effectiveness of ALMPs in returning displaced workers to work is significantly enhanced by reductions in administrative entry barriers in product markets (Figure 1), which tend to stimulate job creation, particularly by young firms.

creative-destruction-dec-2016

Andrews, D and A. Saia (2016), “Coping with Creative Destruction: Reducing the Costs of Firm Exit,” OECD Economics Department Working Paper No. 1353.


Making growth more inclusive by enhancing social protection: the case of Malaysia

By Abu Zeid Mohd Arif, Economist, Country Studies Branch, OECD Economics Department

Growth can be more inclusive by pursuing policies that enable improvements in a country’s living standards while sharing gains more equitably across the population. Inclusive growth incorporates a focus on relative – not just absolute – income and wealth inequality, and on well-being, which depends on both monetary and non-monetary conditions, such as access to quality education, employment, housing and healthcare.

Malaysia’s success in alleviating poverty has been achieved despite the absence of an integrated and comprehensive social protection system. Households benefit from near-universal access to electricity, clean water, healthcare and transport, but income support for disadvantaged persons (such as the unemployed, single parents, disabled and elderly) remains ad hoc, insufficiently targeted and inadequate in providing basic living standards (OECD, 2016a).

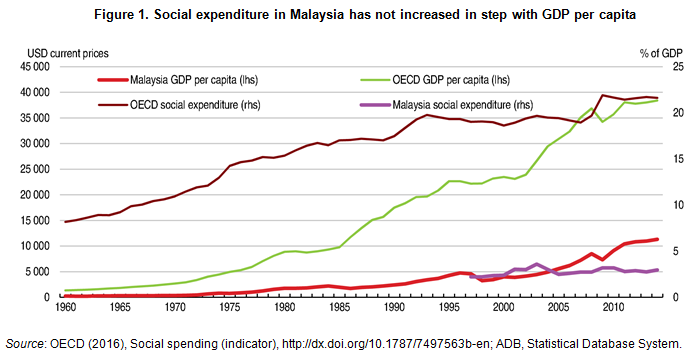
Malaysia’s social protection expenditure is lower than in all South East Asian countries for which data are available and than in all but a handful of countries in the Asia Pacific region. Public expenditure on social protection as a proportion of GDP typically rises in step with GDP per capita, as observed in OECD countries. Malaysia displays a different pattern (Figure 1). This would be the case even when adding in zakat, a compulsory Islamic charitable mechanism that in 2013 represented over one fifth of the level of government social spending excluding health.

malaysia-blog-3-fig-1

The low level of social protection expenditure is further reflected in the low redistributive power of the tax-and-transfer system: pre and post‑tax and transfer Gini coefficients for income barely differ, like in Turkey (Figure 2).

malaysia-blog-3-fig-2

Social expenditure is highly fragmented, being provided through a multitude of small-scale, specific-purpose programmes by a diverse range of ministries. It is essential that Malaysia develop a comprehensive social protection and income transfer system that provides targeted and timely support to those in need, while retaining strong incentives and facilitation mechanisms to maximise labour market participation. This calls for undertaking a comprehensive assessment of social protection needs and optimal strategies to meet them. Malaysia could utilise global best practice toolkits such as the Inter Agency Social Protection Assessments toolkit (ISPA, 2016) and draw lessons from the OECD Development Centre’s work to develop social protection systems in the region (OECD, 2016b).

A key priority is the introduction of an employment insurance scheme that integrates job‑matching services, reskilling and income smoothing to prevent a temporary setback from becoming an entrenched disadvantage. This scheme should also include temporary income smoothing payments to further reduce financial barriers to re-employment and overall income inequality.

References

ISPA (2016), Inter Agency Social Protection Assessments.

OECD (2016a), OECD Economic Surveys: Malaysia 2016: Economic Assessment, OECD Publishing, Paris.

OECD (2016b), The EU Social Protection Systems Programme, OECD Publishing, Paris.


Unleashing private sector productivity in the United States

By Douglas Sutherland, Head of the United States Desk, OECD Economics Department

With the global economy mired in low- growth and no signs of strong acceleration, a lot of attention has been paid to the meagre pace of productivity growth in OECD countries. In the United States, the most watched indicator of productivity (nonfarm business productivity growth) decelerated about ¾ percentage point from 2009 to 2014 relative to the preceding 5-year period. This is not just the result of the crisis holding back investment. Productivity growth had already been slowing from the early 2000s.

Economic research reveals competitive markets stimulate productivity: faced with competitors, firms survive by becoming more efficient and bringing new products to the market. Competitive markets see a lot of firm entry and exit. However, this dynamism has declined: new firms are not being created as frequently as in the past (See figure, top panel) and the most productive of these firms are not growing as fast as they once did. This matters because advances in productivity typically result from the rapid growth of young dynamic firms. Instead, start-ups appear to be failing more often and the remaining firms are getting older with larger firms increasingly dominating markets (See figure, bottom panels).

sutehrland-prod-and-us

When this happens, markets become more concentrated, with large incumbent firms gaining market power. This has many disadvantages because gains in productivity are not being passed onto consumers in lower prices or to workers in higher wages. Faced with these worrying trends, competition/antitrust policy needs to adapt. This is particularly the case in markets transformed by digitalisation, financial innovation and globalisation – such as e-commerce and those dependent on access to information. The decline in business dynamism sometimes comes from barriers to competition being erected by the States. For example, state-level prohibitions on municipalities creating their own fixed broadband networks have hindered the development of stronger competition in this sector. In other cases, States have blunted competitive pressure through imposing state-specific occupational licensing requirements.

Amongst other factors, changes to bankruptcy laws have also contributed to more sluggish business formation. Reforms in 2005 increased the cost of bankruptcy for failed entrepreneurs and made it more difficult for them to try again (see the recent Ecoscope blog on the importance of this for productivity growth). The reforms appear to have stymied the creation of sole proprietorships and partnership, particularly in States that do not exempt some of the entrepreneur’s assets from bankruptcy proceedings. Given the importance of bankruptcy for long-run prospects, a better balance needs to be stuck between supporting entrepreneurship and creditor rights.

References:

Millar, Jonathan and Douglas Sutherland (2016), “Unleashing private sector productivity in the United States”, OECD Economics Department Working Paper no. 1328.

OECD (2016), Economic Surveys: United States 2016, OECD Publishing, Paris.