Harnessing skills for more inclusive growth

by Jan Strasky, Luxembourg Desk, OECD Economics Department.

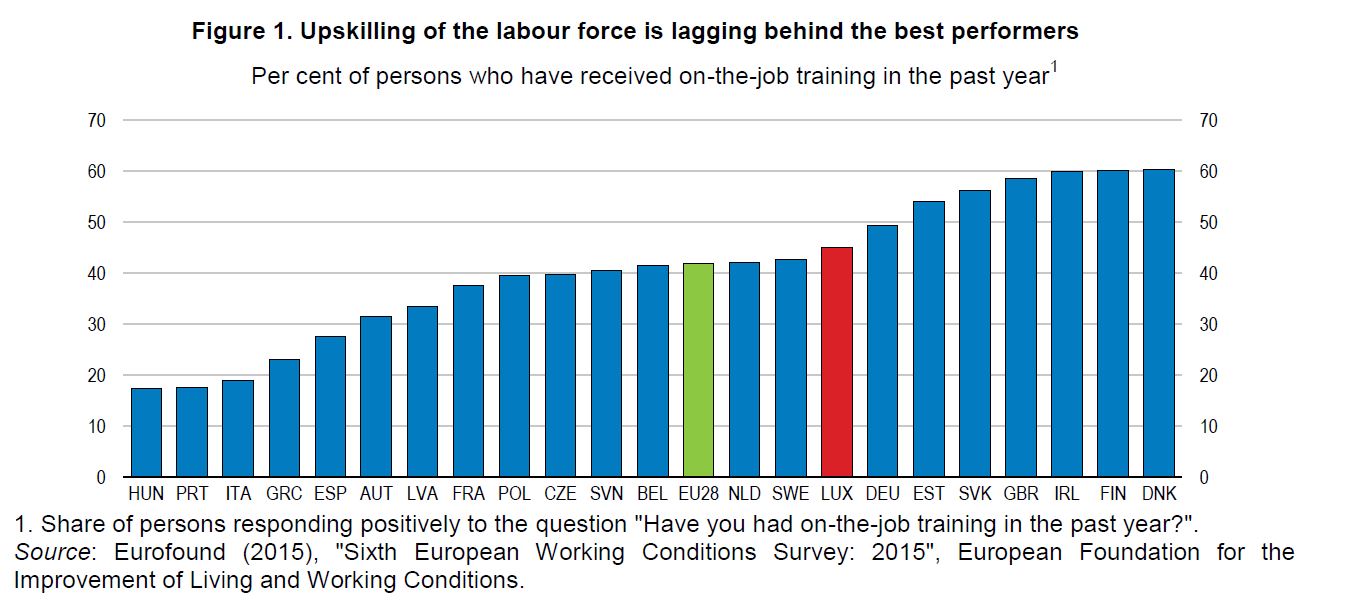
Strong economic performance, comfortable fiscal situation and well-run institutions make life good for most residents of Luxembourg. Average earnings are the highest in the OECD, while labour market insecurity and income inequality are low. Yet, the development of the digital economy is constantly expanding the domain of tasks that can be automatized and affecting both jobs and the skill sets need to perform them. The recent long-term strategy of the government develops an ambitious vision for a smart green digital society, but in order to equip workers with adequate skills, this modernisation strategy will also require improvements in education outcomes and better upskilling of workers over their lifetime (Figure 1).

Figure 1. Upskilling of the labour force is lagging behind the best performers
Lux graphic2 2017

The recently released OECD Economic Survey of Luxembourg 2017 argues that improvements in the education and training system should focus on lowering the high rate of grade repetition and improving the mobility between various education programmes. Grade repetition is internationally high and concentrated in vocational secondary education, often reflecting language handicaps. Although it is sometimes still regarded as an assurance of quality, the empirical evidence shows that grade repetition is costly and ineffective in raising educational outcomes. More productive strategies focus on providing early, regular and timely support during the school year and limiting repetition to subjects and modules failed.

Vocational education and training should equip young people with technical and professional skills that meet labour needs, but also open opportunities for further learning. Programmes imparting similar generic skills as in more academic upper secondary programmes, better linked to the other parts of the education system, would help closing the skills gap between graduates of academic and vocational tracks.

The world of work is changing fast and in ways that are difficult to anticipate. Flexibility in re-skilling and lifelong learning is likely to become key for successful careers in the future. In Luxembourg, like in many countries, those in employment and with better skills tend to profit most from lifelong learning. To improve participation in lifelong learning, providers should make more use of online and distance learning, along with part-time and modular courses. Individual learning accounts and expanded individual study leave could also enhance access to lifelong learning for low-skilled adults and employees from small firms.

Finally, to make better use of existing skills and to reduce the number of long-term unemployed, the disincentives to work should be reduced further. Inactivity traps are high, especially for part-time workers and low income earners, complicating increases in work effort and transitions from unemployment to employment. Furthermore, the system of joint taxation of spouses and registered partners discourages work of second earners, who are often women. Recent changes in policy, such as the introduction of optional individual taxation and the reform of the minimum income scheme, go in the right direction and should be complemented by further adjustments to the tax and benefit system, and pension system to reduce disincentives to work for low-skilled youth and older workers.

References

OECD (2017), OECD Economic Surveys: Luxembourg 2017, OECD Publishing, Paris.


Collective bargaining in Iceland: sharing the spoils without spoiling the shares

by Urban Sila, Iceland Desk, OECD Economics Department

Icelandic labour market is flexible with high labour market participation, low unemployment, and labour supply dynamically responds to the economic cycle. Iceland is the most highly unionised country in the OECD and wage bargaining is a cornerstone of the economy. Strong unions have contributed to very low inequality, high inclusiveness and gender balance. Successful social pacts have protected the lowest paid workers during crises, and on occasion helped fight inflation.

Paradoxically, however, the Icelandic bargaining model has been less successful in times of economic boom, and Iceland suffers from recurrent bursts of social tensions and labour unrest. During such periods trade unions approach collective rounds fragmented and with little regard for wider consequences of their demands. Wage demands by one union trigger topping-up demands by others, resulting in excessive awards. Recently, Iceland has again experienced a period of elevated tensions. In the 2015 bargaining round, doctors and teachers obtained three-year wage awards of around 25-30%, which led to demands by other unions for 50% pay increases. A bitter dispute erupted resulting in negotiated three-year nominal wage awards – that set the minimum over the settlement period – of more than 20% on average. Wages have been rising steeply ever since and together with króna appreciation, this has caused external competitiveness to plummet (Figure 1).

Iceland is a very small open economy prone to boom and bust cycles, and the pro-cyclical wage pressures add fuel to these harmful dynamics. The recently released OECD Economic Survey of Iceland 2017 argues for changes to the structure of collective bargaining to help sustain the benefits of the system for future generations.

Iceland2017blog

Labour negotiations often break down because parties differ in their view of the economy. They frequently disagree even on what exactly has been agreed in the past. Iceland has been through a challenging decade during which trust in politicians and among the social partners has been undermined. Trust and mutual respect can however be rebuilt by active and regular participation of the social partners in a tripartite macroeconomic council – to discuss issues of collective bargaining, welfare policy and social reform. Greater trust can also be fostered by setting up a “technical committee” that can provide impartial and accurate statistics on wages, economy, productivity and competitiveness to be used as a reference point in negotiations.

Wage coordination in Iceland is low. Labour unions tend to be very small and a large number of agreements need to be reached, creating the potential for co-ordination failure. Other countries ensure wage coordination for example by letting the sector that is exposed to foreign competition negotiate first, while other sectors follow (Nordic countries), or by linking wage increases to developments in neighbouring countries, to maintain competitiveness (Belgium). Recognising the Iceland specific context, the OECD Survey proposes that at the beginning of each negotiation round peak worker and employer organisations together issue “wage guidelines”, taking into account the information provided by the technical committee.

A strong role of the state mediator is needed, however, to underpin such a system. The Icelandic state mediator is relatively weak compared to other Nordic systems. The state mediator should be seen as a promotor and protector of the wage guidelines and when issuing conciliation proposals, they should be in line with the wage guidelines.


References

Holden, S. (2016), “A new model for wage formation in Iceland”, Report commissioned by the SALEK group, preliminary version, 9 August 2016, mimeo.

OECD (2017), OECD Economic Surveys: Iceland 2017, OECD Publishing, Paris.

OECD (2015), OECD Economic Surveys: Iceland 2015, OECD Publishing, Paris.


New Zealand has recently enjoyed strong economic growth, but housing and population ageing pose challenges

by David Carey, New Zealand Desk, OECD Economics Department.

New Zealand enjoyed strong economic growth during 2016, driven by high net inward migration, solid construction activity, booming tourism and supportive monetary policy, although in per capita terms growth has been more in line with that in other advanced economies. The terms of trade have rebounded to near record levels, boosting income growth. Growth eased somewhat during the last quarter of 2016 and the first quarter of 2017, in part due to temporary factors including the impact of unfavourable weather conditions on agricultural output and disruption from the November 2016 Kaikōura earthquake. The OECD projects that growth will return to around 3% in 2017‑18, supported by export growth from strong tourism demand and increases in dairy exports. However, slower net immigration is likely to curtail both consumption and residential construction, and the wind-down in the Canterbury earthquake rebuild will curb construction expenditure, more than offsetting the boost from the Kaikōura rebuild and the recently announced increases in infrastructure spending. The unemployment rate is expected to edge down to 4 ½ per cent by the end of 2018 and wage growth to rise moderately. Consumer price inflation should rise sustainably to 2% by the end of 2018, as the effects of oil price falls pass and capacity constraints bite.

While appropriate on the basis of the Reserve Bank of New Zealand’s inflation projections, current monetary policy settings have the downside of fuelling increases in house prices and household debt. As discussed in the accompanying housing blog, both have reached high levels by historical standards and in comparison with most other countries. Further progress is needed to reduce housing supply restrictions, and macro-prudential policy may need to be tightened further, notably by the implementation of debt-to-income limits to reduce financial stability risks.

The government’s prudent approach to fiscal policy puts New Zealand in good stead to cope with future global shocks and natural disasters. Like other countries, New Zealand also faces large spending pressures from public pensions and health-care costs in the longer term. To this end, the government has announced its intention to increase the age of eligibility for the public pension by six months each year from 2037, reaching 67 by 2040. Budget savings would be larger and inter-generational equity greater if this increase were to be brought forward, the transition period lengthened and the pension age subsequently indexed to life expectancy. The planned focus on increasing public-sector productivity should help to contain long-term increases in health-care outlays.

NZmacroblog

References
OECD (2017), OECD Economic Surveys: New Zealand, OECD Publishing, Paris.


Lifting New Zealand’s game on productivity

by Andrew Barker, New Zealand Desk, OECD Economics Department

Productivity growth will be the main driver of global economic growth and prosperity over the coming decades. For New Zealand, this represents both a challenge and an opportunity, as NZ productivity is below that of leading OECD countries (Figure 1). This problem is not new, and previous OECD work has shown that distance from markets is a substantial part of the explanation. The key question, considered in the 2017 OECD Economic Survey of New Zealand, is what can be done to improve generally sound policy settings in New Zealand so as to boost productivity, in spite of the economic challenges posed by its remote location.


NZ prod 1

Overcoming distance barriers means that New Zealand needs to do everything possible to increase benefits from international connections. As a small country, it is reliant on foreign direct investment to provide access to global supply chains and markets, promote local competition and drive technological, skills and managerial quality transfers. New Zealand’s comprehensive foreign investment screening regime should be narrowed, while reducing compliance costs and increasing predictability for investors. Although New Zealand has few other barriers to trade, there would be benefits from cutting remaining tariffs, strengthening trade facilitation measures and improving recognition of foreign licenses to practice. Digitalisation offers increasing opportunities for trade that is not affected by distance, heightening the importance of continuing efforts to modernise information technology infrastructure.

Facilitating international connections would also deliver benefits through increased competitive pressures, which can improve productivity through resource reallocation to the most productive firms, greater diffusion of existing technologies to laggards and increased incentives for innovation. Competition could also be improved by giving the Commerce Commission the power and resources to undertake market studies and through improving the efficiency of the insolvency regime.

Another key factor in New Zealand’s poor productivity performance is a low rate of capital investment. Options to address low investment include decreasing the high effective corporate tax rate through lowering the statutory rate, and increasing national saving through reducing taxation of non-housing saving vehicles. Reforms to urban planning and infrastructure funding arrangements will be important to address the drag on productivity from inflated house prices.

Finally, innovation is a key driver of productivity growth. Government support for R&D is low in New Zealand, and there is a low level of collaboration between firms and higher education and research institutions (Figure 2). Fiscal support for R&D should be increased, firm-level caps on R&D grants need to be removed, and support for successful collaboration between research institutions and industry should be maintained or increased.

NZ prod 2

References

OECD (2017), OECD Economic Surveys: New Zealand, OECD Publishing, Paris.


The downsides of New Zealand’s inflated house prices

by David Carey and Andrew Barker, New Zealand Desk, OECD Economics Department

In real terms, house prices in New Zealand increased more than in any other OECD country between 2010 and 2016 (Figure 1). While house price increases have supported economic growth through wealth-induced consumption growth, they have also created a number of social and economic problems. Housing affordability has been undermined, particularly for those with low incomes: housing costs for the bottom fifth of households reached 54% of income in 2015, up from under 30% in 1990. Driven by mortgage growth, the ratio of household debt to disposable income now exceeds the level recorded prior to the global financial crisis and is high compared with other OECD countries (Figure 2). This raises financial stability risks. House price increases also undermine productivity growth by inhibiting people from moving into economically successful, highly productive urban areas.


NZ housing 1

NZ housing 2

Price increases have been most pronounced in Auckland. Around half of all new migrants settle in Auckland, exceeding its (one third) share of the national population. Since 2008, new housing construction in Auckland has failed to keep pace with population growth. Prices in the rest of New Zealand, on the other hand, have risen despite little or no increase in the population-to-dwelling ratio. Throughout the country, record low interest rates have magnified house price increases.

The long-term solution, for Auckland in particular, is to address supply constraints. The recent Auckland Unitary Plan will allow greater densification and some expansion of urban development limits. However, insufficient infrastructure has constrained the extent to which densification is possible in central parts of Auckland. As in other parts of the country, infrastructure provision is primarily the responsibility of local governments, which face financial constraints and weak incentives to invest in amenities to facilitate growth. Options to broaden funding sources for public infrastructure should be explored, including more user charging, targeted property taxes, more cost-reflective developer contributions, sharing in a tax base linked to local economic activity and further recourse to alternative delivery models such as public-private partnerships. Reforms to the urban planning system are also needed – recommendations from the OECD’s Environmental Performance Review and the Productivity Commission’s Inquiry into Land Use Planning should be considered in order to deliver a more responsive and efficient planning system.

Relieving supply constraints takes time, however, so demand-side measures are also important to address financial stability risks. The Reserve Bank has progressively tightened restrictions on loan-to-value ratios, constraining the maximum amount that banks can lend to most customers. House price increases have moderated since the last round of tightening in October 2016. Debt-to-income restrictions, which complement loan-to-value ratios by limiting further debt as house prices increase relative to incomes, may be necessary if house price increases resume, and should be added to the Reserve Bank’s toolkit following analysis demonstrating that benefits would outweigh costs.

References

OECD (2017), OECD Economic Surveys: New Zealand, OECD Publishing, Paris.

OECD (2017), Environmental Performance Review: New Zealand, OECD Publishing, Paris.

NZPC (2017), Better Urban Planning, Inquiry Report, Wellington.


Make trade work for all

By Catherine L. Mann, OECD Chief Economist and Head of Economics Department

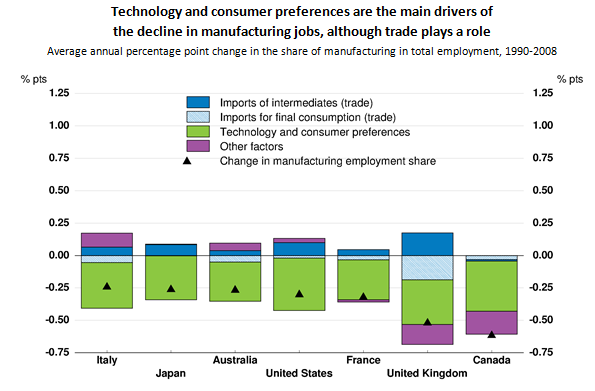
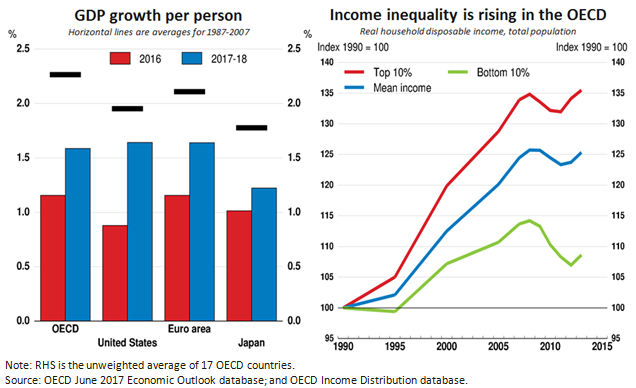
The special chapter of the June 2017 Economic Outlook calls for action to diagnose and respond to structural trends, focussing on globalisation.  International trade has been a powerful engine of global economic growth and convergence in living standards between countries. Despite these benefits, there has been a widespread backlash against trade and political support for protectionist measures has gained ground in G20 countries. Rising inequality and stagnant incomes provide the background to this discontent. Many OECD households have seen little or no gain in disposable income since the early 2000s with a hollowing out of middle-skill jobs. Manufacturing employment has been on a declining trend, falling from 16% to 12% of employment in OECD countries since 2000.

Deeper trade integration has come along with rapid changes in specialisation patterns. The share of OECD economies in world exports of goods declined from 80% to below 60% between 1995 and 2015. At the same time, trade in business and financial services has grown around 1.5 times faster than for goods. OECD countries have strengthened their specialisation in services and moved up the complexity ladder in their goods exports. Since the 1990s, while emerging market economies have increased the complexity of their product mix and the share of knowledge-intensive activities in their manufacturing sectors, they still remain behind major OECD countries in these areas.

Rising trade integration, like technological progress, has brought benefits for firms and consumers but also economic disruptions. Untangling the role of trade in shaping the trends in employment and inequality from the effects of technology and shifting consumer preferences is difficult. New analysis conducted in this Economic Outlook shows that competition from imports has had a relatively modest impact on manufacturing jobs. The main drivers of jobs losses have been technological progress and a rising share of consumption going to services. Countries well integrated in global value chains and importing intermediate goods for export, such as Germany, Czech Republic, Slovakia and Estonia, have generally tended to experience a lower decline in manufacturing jobs than other economies.

tech blog

Even if trade-related job losses are limited, their costs are amplified by the fact that they fall heavily on some people and regions due to the geographical concentration of manufacturing activities. Regions that experience steep declines in manufacturing employment rates often do not create new jobs in other sectors to offset the job losses, and skill requirements may also differ. As a result, some local economies, particularly rural areas, suffer long-lasting losses from shocks to their manufacturing industries. Countries that have lost more manufacturing jobs – due to stronger import competition, technological change or the evolution of consumer preferences – have experienced a greater increase in income disparity across regions.

tech2

This Economic Outlook argues that an integrated policy approach combining actions at the international, national and sub-national levels is needed to make trade work for all. Addressing concentrated economic disruptions will require stronger efforts to help vulnerable workers move to new jobs and to equip them with the skills to succeed in a changing world. In particular, actions to enhance the productivity and employment capacities of lagging regions should be stepped up to promote a more equal sharing of the large gains from trade and technological progress. Coherent packages of measures should be pursued to assist displaced workers, promote inclusiveness and create new opportunities by encouraging new firm entry and innovation, as highlighted in the OECD Going for Growth 2017. In addition, the regional dimension of policy packages should be more systematically addressed. Finally, domestic policy should be complemented by international agreements that help level the playing field.


References:

OECD (2017), “How to make trade work for all”, in OECD Economic Outlook, Volume 2017 Issue 2, OECD Publishing, Paris.

Araujo, S., T. Chalaux and D. Haugh (2017), “Who’s in Your Export Market? The Changing Pattern of WorldTrade in the Age of GVCs”, OECD Economics Department Working Papers, OECD Publishing, Paris (forthcoming).

Demmou, L., C. Thubin and Y. Kalantzis (2017), “De-industrialisation in OECD Countries: A Simple Accounting Approach”, OECD Economics Department Working Papers, OECD Publishing, Paris (forthcoming).

Rusticelli, E., A. Arquie, D. Haugh and D. Turner (2017), “Going Local: A Regional Perspective on International Trade, Labour Markets and Inequality”, OECD Economics Department Working Papers, OECD Publishing, Paris (forthcoming).


Global Economic Outlook: Better, but not good enough

By Catherine L. Mann, OECD Chief Economist and Head of Economics Department

Global growth is projected to rise modestly from 3% in 2016 to just over 3½ per cent by 2018 in our latest Economic Outlook. The mood in the global economy has brightened during the past year, with confidence indicators and industrial production increasing, and investment and trade picking up from low levels. Growth is broad-based, including among major commodity producers.

There are now upside risks from investment to improve the quality of capital with more advanced technology, with rapid rises in demand for high-tech products since the second half of 2016. If this is sustained, it would improve cyclical conditions and support a revival of investment-intensive global value chains, boosting domestic demand and productivity.

The projected pick-up in growth is welcome as the global economy has been stuck in a low-growth trap, but would still leave global growth below the historical average of 4% for the two decades prior to the crisis. In addition, when viewed in per capita terms, GDP growth for the OECD is even further from past norms and income inequality continues to rise. And while business and consumer confidence have generally picked up, these “soft” indicators have become less reliable in predicting “hard” activity, particularly for emerging economies.

EO101blog

Employment growth has recovered relatively well and headline unemployment rates have decreased in most countries. However, along some dimensions, such as hours worked and part-time working, job quality is more precarious and underemployment remains high. Real wage growth is sluggish and has stagnated for most firms, and is associated with widening productivity gaps to frontier firms, so there are weak foundations for robust consumption growth and widespread improvements in well-being.

Financial stability risks persist and could derail the modest recovery. Policy and political uncertainties are high. Geopolitical shocks and trade protectionism could catalyse snap-backs in asset prices and realise downside risks. High and rising private credit growth for emerging economies, particularly China, is a concern. Rapid increases in house prices in some advanced economies could lead to financial vulnerabilities. Solving non-performing loans in Europe would help to hasten the recovery.

Inflation in advanced economies is generally below central bank targets. After the global interest-rate cycle turned in mid-2016, monetary policy is appropriately moving toward a more neutral stance in the United States, and Europe and Japan are using forward guidance. However, current market expectations imply a rising divergence in short-term interest rates between the major advanced economies in the coming years. This creates risk of sharp exchange rate movements, or other instabilities in financial markets.

In this environment, policy needs to promote inclusive growth and manage financial risks. Countries should implement fiscal policy initiatives that mitigate inequalities and provide long-run benefits, such as boosting education, child care, training and mobility. “High-multiplier” public investments in research and infrastructure would catalyse business activity to strengthen growth. An effective fiscal mix also improves the fiscal position and future output to boost debt sustainability in the longer term.

Each country has its own policy priorities to boost productivity, jobs and inclusiveness as set out in our Going for Growth report. Worryingly, the pace of reform has slowed in recent years and much more can be done to boost competition, skills and innovation. The benefits for inclusive growth can be strengthened through coherent policy packages which maximise synergies if implemented together, such as how active labour market policies do more to raise employment and share gains widely if pursued jointly with greater competition between firms.

The global cyclical upturn is not yet assured: the higher productivity and greater inclusiveness needed to improve well-being for all remain elusive. Policymakers cannot be complacent.

References

OECD Economic Outlook, June 2017.


Solving Non-Performing Loans in Europe to speed up the recovery

by Pierre Beynet, Head of Division, Country Studies Branch, OECD Economics Department

Almost 10 years after the outset of the financial crisis in summer 2008, European growth remains modest, constantly underperforming the OECD average. Several factors explain this disappointing performance. The pace of fiscal consolidation was rapid in the countries most affected by the crisis while structural reforms were not sufficiently pursued in other countries. One key factor that may continue to cripple growth is the persistently high level of non-performing loans (NPLs or impaired assets) in several countries (Figure 1). Impaired assets are a legacy of the crisis, but also a cause of the weak recovery as they limit bank capital available to more productive and innovative firms (Aiyar et al., 2015; European Commission, 2017). The negative impact of impaired assets on bank credit may worsen from 2018 as the new accounting standards (IFRS9) and more forward-looking provisioning rules should lead to faster recognition of losses (Constâncio, 2017).

Given this context, it is urgent to pursue a more aggressive policy to resolve NPLs, preferably at the European level. This requires introducing more flexibility in EU rules, including state aid rules, which may otherwise block the most ambitious options to resolve NPLs, as discussed below and outlined in the last OECD economic survey on the euro area (OECD, 2016).

non per loans beynet

To free-up maximum capital for new lending, banks need to sell NPLs at a sufficiently high price. This is tricky since potential buyers not knowing the exact level of risk associated with NPLs are likely to offer the lowest possible price and banks may consider the offered price too low, ending up in no transaction. The longer NPLs stay on the books, the lower is the value obtained after removal from the bank, which could make transactions increasingly difficult overtime.

To facilitate transactions, setting up an asset management company (AMC) can be very effective. AMCs’ expertise for valuing impaired assets allows banks, especially smaller ones, to get a better price. Establishing an AMC at the European level would maximize economies of scale and diversify asset recovery risks (OECD, 2016; Haben & Quagliariello, 2017; Constâncio, 2017). Since a European AMC could imply cross-country risk sharing, some financial sector conditionality could be imposed on countries benefiting from it, to make it acceptable to all Euro Area countries.

Another option would be to continue setting up AMCs at the national level. Public support (participation of the State in the capital of the AMC or guarantees granted) may be needed to allow AMCs to buy impaired assets at a sufficiently high price and to reduce risks faced by private investors participating in the capital of AMCs. However, European rules could hinder such public support. Under the new bank recovery and resolution directive (BRRD), selling assets to AMCs above market price is considered state aid, and it triggers the implementation of a restructuring plan for the bank, a “bail-in” of junior creditors (i.e. their financial participation in the recapitalization of the bank) and, since January 2016, possibly a bail-in of senior creditors as well.

Hence, the combined application of the BRRD and state aid rules creates a significant hurdle for governments to participate in the setting up of AMCs since it could result in sizeable fiscal costs in  the event of public bail-out of the bank, in addition to bail-in of private creditors. It could also create huge political costs if private creditors who participate in the bail-in end up being bank retail customers who were not aware of the risk when they purchased some financial products. It appears that several banks have misled their individual clients by selling such products as safe assets…

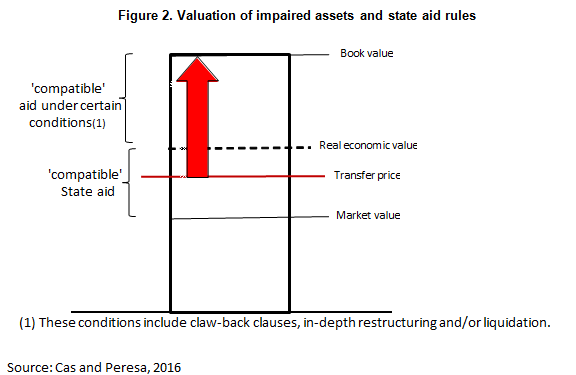
In this context, introducing flexibility in EU rules to solve NPLs without triggering bail-in and resolution procedures should be considered. A very high level of NPLs should be considered a serious economic disturbance and warrants a waiver of bail-in and resolution procedures. Alternatively, a more lenient definition of the price level triggering state aid – and hence resolution – could be used. Currently, the European Commission assumes state aid for any purchase of impaired assets by a state-supported AMC at a price above the estimated “market price” (Figure 2; Cas and Peresa, 2016). For example, when the market prices are uncertain and depressed by stressed conditions, resolution requirements could be applied only for prices above the “real economic value” or a level half way between the “market price” and the “real economic value”. Member states benefitting from this exceptional treatment could in return be required to make their insolvency regimes more efficient, facilitating a faster recovery of collaterals and enabling the AMCs to get a higher price for impaired assets.

Valuation Beynet

References

Aiyar, S. et al. (2015), “A strategy for resolving Europe’s problem loans”, IMF Staff Discussion Note, No. SDN/15/19, International Monetary Fund, Washington DC.

Cas, M. et I. Peresa (2016), “What Makes a Good ‘Bad Bank’? The Irish, Spanish and German Experience”, European Economy Discussion Papers, No. 036, Brussels.

Constâncio, V. (2017), “Resolving Europe’s NPL burden: challenges and benefits”, Keynote speech, Brussels, 3 February.

Haben, P. et M. Quagliariello (2017), “Why the EU needs an asset management company”, Central Banking, London.

European Commission (2017), Quaterly report on the Euro Area, Institutional Paper 049, Brussels.

OECD (2016), OECD Economic Survey of the Euro Area, OECD Publishing, Paris.


Enhancing financial stability amid slowing growth in China

By Margit Molnar and Ben Westmore, China Desk, OECD Economics Department

Growth in China has been slowing gradually, but GDP per capita remains on course to almost double between 2010 and 2020. As a result, the Chinese economy will remain the major driver of global growth for the foreseeable future. Patterns across the country vary, however: in some areas slowing investment has brought down growth, while in other, mainly less-developed ones, both investment and GDP are growing at or close to double-digit rates (Figure 1).

china slowdown g and i

Growth in recent years has been fuelled by fast-rising credit and has come at a cost. Financial risks are mounting on the back of an inflating housing bubble, high and rising enterprise debt, expanding non-bank activities and enormous over-capacity in some sectors. Liquidity expanded rapidly over the past couple of years as the reserve requirement ratio was lowered gradually (Figure 2). Mortgage lending soared, fuelling housing prices, in particular in the largest cities. A burst of the housing bubble would hurt the real estate, construction and several manufacturing industries. However, household indebtedness remains moderate and prudential regulations for mortgage loans are stringent, so the financial sector could likely absorb the shock. Consumer finance has also grown rapidly, spurred by the expansion of online peer-to-peer lending platforms. Some of these new lenders are loosely regulated and do little to verify the repayment ability of borrowers. While financial institutions should be encouraged to lend only to people able to service their debt, improvements in household financial literacy are also needed.

China high liquidity

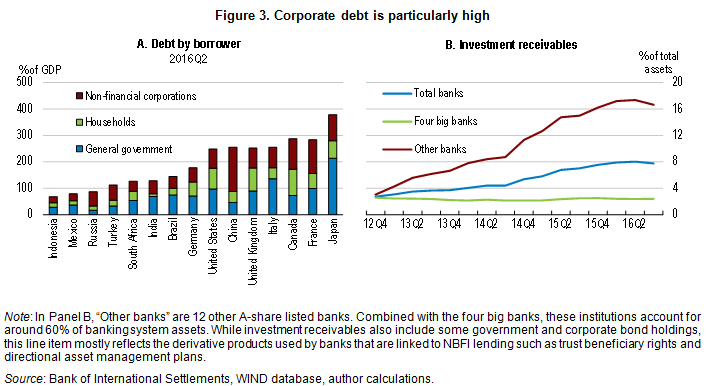
In contrast to moderate household debt, non-financial corporate debt rose from less than 100% of GDP at the end of 2008 to 170% by mid-2016 (Figure 3). This sharp pick-up was due in large part to increased leverage of SOEs. The rapid accumulation of corporate debt combined with a slowdown in economic activity and some of the practices of financial institutions have significantly heightened systemic risks. Under the macroprudential framework announced in January 2016, banks are required to disclose wealth management product exposures on their balance sheet, which will benefit systemic stability. To further contain risks, more effective monitoring and control of leveraged investment in asset markets is required.

China corp debt

The authorities have initiated debt-to-equity swaps in heavily indebted enterprises and approved the issuance of credit default swaps that pay out if there is a default on the underlying loan. A debt-to-equity swap will be initiated for enterprises that cannot service their immediate debts but are considered to be financially sustainable in the medium to long term by the lender. Only a limited group of firms conform to both these conditions, restricting the potential scale of such measures. Indeed few swaps have gone ahead so far as banks have been unwilling to take on the increased risk associated with becoming equity holders. The securitisation of NPLs has also been encouraged, which may be preferable to debt-to-equity swaps insofar as it reduces the exposure of banks to underperforming corporates and the NPLs are acquired by an entity with greater expertise in restructuring the company. Nevertheless, China’s securitisation market is relatively shallow at present, limiting the potential scale of such transactions.

The recently published 2017 OECD Economic Survey recommends enhancing prudential regulation by requiring lenders to take into account borrowers’ repayment ability when extending loans. It also advocates restricting leveraged investment in asset markets.

Reference

OECD (2017), OECD Economic Surveys: China, OECD Publishing, Paris.


Does everybody enjoy Pura Vida? Decomposing income inequality in Costa Rica

By Mabel Gabriel and Alberto Gonzalez Pandiella, OECD Economics Department

Despite strong economic growth, Costa Rica’s income inequality has increased in the past decade, in stark contrast with other Latin American countries (OECD, 2016 and González Pandiella and Gabriel, 2017).

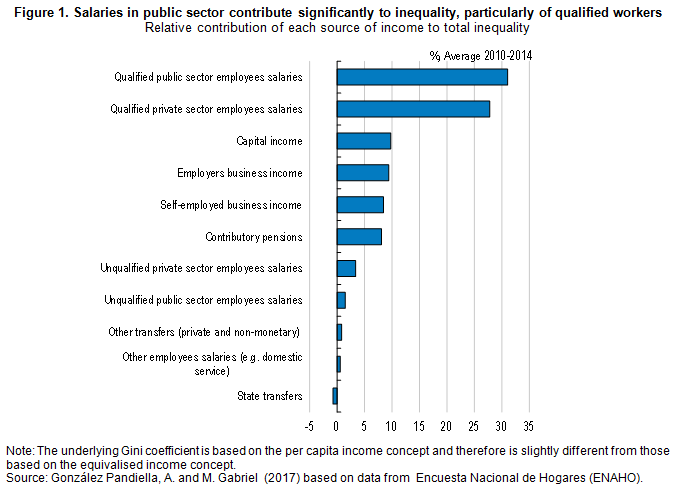
What explains this? A decomposition of income inequality by income sources reveals, surprisingly, that public sector wages are largely behind the country’s high level of income inequality (Figure 1). High wages paid to those employed by public agencies outside the central government contributed the most. Inequality has also been driven by large and increasing skills premiums in the private sector. Workers holding a tertiary degree earn, on average, nearly four times as much as those with only primary education. Social programmes, such as non-contributory pensions, help to reduce inequality, but their impact is limited given their small share in households’ total income.

CRI1

What to do about it? One fundamental advantage of decomposing inequality by income source is that it allows quantifying how marginal changes in a particular income source would affect overall income inequality, which can be useful to guide policies. For Costa Rica, the largest reduction in inequality would come from an increase in wages of low qualified workers in the private sector (Figure 2). Hence, progress to ensure a higher compliance with the minimum wage level would help to reduce inequality. Given that the Costa Rica’s minimum wage system is complex (OECD, 2016), a simplification of its structure would facilitate compliance. A more comprehensive strategy to reduce informality, which is increasing and affects predominately low-qualified workers, would also help to curb inequality.

CRI 2

On the other hand, increases in wages of qualified workers in the public and private sectors would result in the highest increase in inequality. Hence, further increases in public wages of qualified workers do not seem optimal from an inequality perspective. In the private sector, strengthening the links between education and the labour market would help to reduce existing high skills mismatches (Gonzalez Pandiella, 2016) and would also contribute to lower inequality by reducing skill premia.

References: