Boosting economic opportunities and wellbeing in Latvia: why housing matters

by Andrés Fuentes Hutfilter, Germany-Latvia Desk, OECD Economics Department

Unemployment is still above 8% in Latvia and contributes to poverty, in part because many unemployed have been without a job for an extended period of time. High unemployment and poverty are concentrated in some regions (Figure 1).
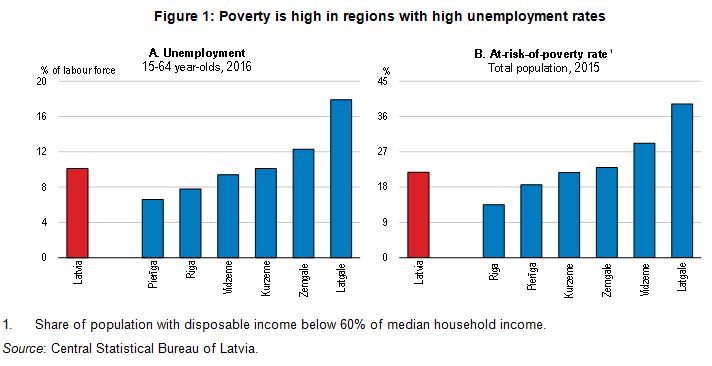
Latvia1Housing policies shape residential mobility and can encourage workers’ movement to jobs (Andrews et al, 2011). The 2017 Economic Survey of Latvia therefore argues that good housing policies help reduce unemployment in high-unemployment areas. By helping workers find better jobs, they can also boost productivity and wages. Housing policies are particularly relevant for young people since they have a naturally higher propensity to move. Good housing policies could also encourage young people to seek opportunities in Latvia rather than emigrate.

Affordable quality housing is also important for wellbeing. Overcrowded housing is widespread among low- and middle-income households in Latvia. The share of households’ housing spending in total expenditure (26%) is high, and higher than in other countries with similar income level, such as Estonia. Policies are therefore needed to make quality, affordable housing available in neighbourhoods which are well connected to employment opportunities.

Few households rent their homes, even among low-income households (Figure 2).  Home owners from high-unemployment areas are likely to find it difficult to afford buying housing in areas with good employment opportunities, where house prices are likely to be higher. There is little development of new housing for rent. Legal uncertainty and long legal procedures hold back the development of the private rented housing market. Reducing tax evasion and fostering long-term lease contracts could also make contracts more reliable and make rented housing more attractive for tenants. Several OECD countries have also successfully expanded affordable housing by requiring private developers to allocate a proportion of the dwellings as affordable units (Salvi del Pero et al., 2016).Latvia2

Social housing is scarce and waiting lists are long, especially in the Riga area, where unemployment is low and good jobs more abundant. Government spending on social housing and on cash housing benefits for low-income households is low. Support only covers a small share of the low and middle income population. More funding for low-cost rented housing in areas of expanding employment would boost employment and lower poverty. An eligible person can only apply for assistance in the municipality where she resides, limiting labour and residential mobility. A nation-wide register that allowed eligible persons to apply for social housing where they expect better job opportunities could support residential mobility.

References:

OECD (2017) Economic Survey of Latvia.

Salvi del Pero, A., Willem, A., Ferraro, V., Frey, V. (2016), “Policies to promote access to good-quality affordable housing in OECD countries,” OECD Social, Employment and Migration Working Papers, OECD Publishing, Paris.

Andrews, D., A. Caldera Sánchez and Å. Johansson  (2011), “Housing Markets and Structural Policies in OECD Countries“, OECD Economics Department Working Papers, No. 836, OECD Publishing, Paris.


How to make Belgian firms more productive

by Manav Frohde, Economist, OECD Economics Department

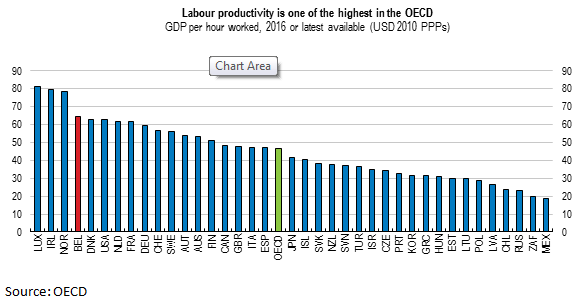
A combination of market-based policies and a redistributive welfare state have helped Belgium achieved among the highest living standards in the OECD. While the economy remains highly productive, productivity growth has slowed  over the past two decades (Figure 1 & 2). Reinvigorating productivity growth will be necessary to sustainably increase economic prosperity over the coming years.

Belgium Manav1

Belgium Manav2With a particular focus on the business environment and skills and labour market policies the 2017 OECD Economic Survey of Belgium identifies several measures that could help improve long-term productivity growth.
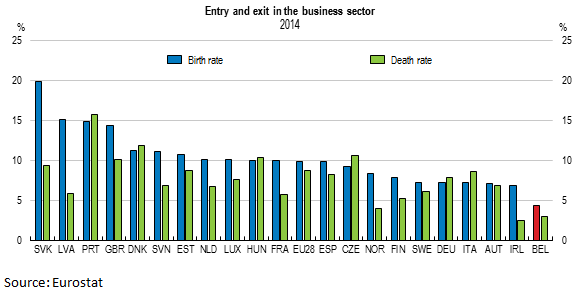
The general framework conditions in Belgium are by and large favourable for private sector activity. Nevertheless business dynamism, as measured by entry and exit rates, is weak (Figure 3). This is important because international evidence suggests that young firms contribute more than proportionately to innovation, productivity growth and job creation. The low rates of entry and exit in the business sector may reflect a dominating presence of large, established firms. Relatively high administrative burdens on start-ups, including the low threshold from which firms are required to register for VAT, and a high minimum capital requirement for establishing a firm also act as barriers to entry. Many young, innovative firms also face financing constraints, particularly in the scale-up phase, suggesting that increased access to venture capital would enhance firm dynamism.

Belgium Manav3

At around 2.5% of GDP Belgium’s spending on research and development (R&D) is above both the EU and OECD averages. However, it falls short of the Lisbon target of 3% of GDP. Moreover, the share of business enterprise R&D in total R&D spend

ing has declined over the past two decades. Public support programmes for R&D and innovation could be streamlined to improve their effectiveness, while the effectiveness of existing tax incentives for private companies should be critically assessed. Public sector entities at the different levels of government could also step up their innovation co-operation, and could do more to foster collaboration between universities and research centres, and private companies.

Belgium Manav4Productivity growth has also been held back by low public investment, particularly in transport infrastructure. Public investment declined from close to 6% of GDP in the early 1970s to just above 2% of GDP since the 1990s (Figure 4). Antwerp and Brussels are among Europe’s five most congested urban centres. Given limited fiscal space, public investment could be financed through a combination user fees, well-designed public-private partnerships, reductions in inefficient public spending, and higher non-distortionary taxes.
References:

OECD (2017), OECD Economic Surveys: Belgium 2017, OECD Publishing, Paris.


Economic research on international capital flows: where do we stand 10 years after the Global Financial Crisis started?

Stéphanie Guichard, our guest author, is a former Economic Counsellor to Catherine L. Mann, OECD Chief Economist.

Financial globalisation has given international capital flows a central role in the functioning of the global economy, leading to considerable economic research over the past 30 years. Making the most of these capital flows has always been a challenge, as they can bring both good and bad. On the one hand, they can support long-term growth through a better international allocation of saving and investment, through technology and management improvements associated with FDI inflows or through enhanced transparency and corporate governance due to the exposure of flow recipients to international investors. On the other hand, they complicate macroeconomic management of recipient countries, increase financial vulnerabilities and amplify domestic distortions, and can lead to financial crises and sudden stops with negative implications for economic growth.

This challenge has become even more acute after the Global Financial Crisis financial revealed the complexity of global financial relations and their role in shock transmission. The crisis also questioned the ability of fundamentals to protect countries from financial instability and the global financial cycle. Overall it showed that global financial integration has not only led to an increase in the size of capital flows (annual gross cross-border capital flows increased from about 5% of world GDP in the mid-1990s to around 20% in 2007) but has also affected the drivers of these flows as well as the transmission and contagion mechanisms.  For instance, there has been a growing decoupling between gross and net flows since the late 90s which means that surplus countries do not necessarily “finance” deficit countries, and economies with a balanced current account may still get important financing from abroad and be vulnerable to sudden stops. These changes have implications for a wide range of policies from surveillance, to how to best deal with inflows and outflows in order to reap their benefits while reducing associated risks. Moreover, over the past few years, while financial globalisation has marked a pause, the nature of capital flows has continued to evolve and new concerns have emerged.

The new OECD working paper Findings of the Recent Literature on International Capital Flows: Implications and Suggestions for Further Research takes stock of recent empirical and theoretical research. It assesses how this literature helps assess the current situation, associated risks and policy needs.  The main findings are as follows.

  • Foreign debt accumulation by EMEs non-financial corporation has become a potential source of instability. Foreign debt accumulated by EMEs non-financial corporation (NFC) has increased substantially since 2010. There is also evidence suggesting a significant part of this debt has been financing financial assets acquisitions or deposited in local banks rather than investment in fixed assets, supported by the favourable carry trade opportunities resulting from the low dollar interest rates. A USD appreciation and an increase in dollar interest rates could hence lead to a fast unwinding on some of these positions.
  • The protecting role of good fundamentals is being questioned. The capital inflow surge to EMEs that followed the implementation of QE in advanced economies, the “taper tantrum” episode, the vulnerabilities associated with EME corporate borrowing have all revived the debate on EMEs vulnerabilities to global financial shocks, especially the monetary policy stance in advanced economies. The analysis of push (global) and pull (local) factors has focused on the mechanisms by which push factors affect EMEs and whether some fundamentals affect the sensitivity of countries to these factors. and mitigate the impact of the global financial cycle. However, findings have been mixed, potentially questioning the traditional view that good fundamentals necessarily protect countries from financial turbulences.
  • The ability of exchange flexibility in mitigating the risks associated with capital inflows is also questioned. The existence of a global financial cycle that affects countries independently of their exchange rate regime has questioned the ability of the move towards more exchange rate flexibility by many EMEs over the past two decades to shield them better from financial turbulences than the less flexible regimes of the 90s. This is especially the case as exchange rate fluctuations may amplify the impact of financial shocks via balance sheets effects. While this point is largely shared by recent analyses, the further implications for policy making including monetary policy and capital controls is under debate. While some argue that under full capital mobility, countries outside the US lose monetary autonomy, even with flexible exchange rate, and call for a greater use of prudential and capital flow management tools, (e.g. Rey 2016), others reject this view and rather stress that central bankers have to deal with worse trade-offs related to financial stability issues (e.g. Banerjee et al. (2015) and Obstfeld (2015)).
  • While capital controls have been increasingly considered as a complementary policy tool to deal with international capital flows, evidence on their impact remains inconclusive. The reliance on capital controls or more generally capital flow management measures remains an important, and yet unsettled, policy debate regarding international capital flows. As the risks associated with international capital flows have become more obvious, there has been a slow shift in the post-Bretton woods consensus view that capital should be allowed to move freely across countries and that the use of capital control, even in face of large inflows or sudden stops, was unwarranted. However, most of the issues regarding the use, effectiveness and spillover effects of capital control remain largely open, as empirical results point to different directions, partly because of the diversity of the measures of capital controls that have been used, the different time horizon and countries under review.
  • International policy coordination is essential. Deeper global financial integration means that monetary and financial shocks are transmitted through the financial system across countries and that imbalances or credit booms abroad can affect the domestic economy and its stability, as seen during the financial crisis. Domestic policies, especially monetary and financial policies, may spill over to other countries and even have spillback effects on the domestic economy. Hence international cooperation and coordination of policies have been put forward to deal with international capital flows in three main areas: monetary policy; capital control management and more broadly financial policies; the global safety nets.

The paper points to many areas where further investigation is needed to guide policy making. They include the role of fundamentals in protecting countries against the risks associated with capital account openness, the impact of exchange rate fluctuations taking into account the balance sheet transmissions channels, the costs and benefits of capital controls, financial policy spillovers, the costs and benefits of the global financial safety net, the drivers of capital outflows — especially as China is further liberalising its capital account–, how the characteristics of the sectors receiving/exporting inflows affect the drivers of the flows and their impact on the economy.

References:

Banerjee, R., M. Devereux and G. Lombardo (2016), “Self-oriented monetary policy, global financial markets and excess volatility of international capital flows“, BIS Working Papers, No 540 Jan.

Guichard, S. (2017), “Findings of the recent literature on international capital flows: Implications and suggestions for further research“, OECD Economics Department Working Papers, No. 1410, OECD Publishing, Paris.

Obstfeld, M. (2015), “Trilemmas and Tradeoffs: living with financial globalization” in Global Liquidity, Spillovers to Emerging Markets and Policy Responses, edited by C. Raddatz, D. Saravia, and J. Ventura, Santiago, Central Bank of Chile.

Rey, H. (2016), “International Channels of Transmission of Monetary Policy and the Mundellian Trilemma”, IMF Economic Review, Vol. 64, Issue 1.


The Italian banking system at a turning point – The Italian View

by the Italian Ministry of Economy and Finance, Pier Carlo Padoan, Italy’s Minister of finance, was OECD Deputy Secretary-General and Chief Economist from 2009-2014).

The Italian banking system has long since been waiting for a comprehensive reform addressing structural inefficiencies and structural rigidities. As of 2014, the Government has defined a comprehensive reform plan while also tackling the crisis affecting several banks.

Narrow path2

To begin with this latter topic, three interventions involved seven banks that were experiencing major strains. The first intervention required the resolution of four small and mediumsized regional banks that led to the formation of “bridge banks” in charge of continuing operations, thus rescuing 12 billion euros in savings for about 1 million customers.

The resolution procedures ended in April 2017 with the sale of three “bridge banks” to a larger bank (UBI). BPER acquired the fourth in June 2017. Buyers were selected through a fair, open and transparent procedure. This resolution did not imply any State aid, thus requiring a major effort by the banking sector. The private sector provided 4.7 billion euros to avoid bankruptcy and its social and entrepreneurial consequences, preserving the issue of loans to over 200,000 small and medium-sized businesses, small retailers and craftsmen.

More recently, the Government intervention was addressed to the liquidation of Banca Popolare di Vicenza and Veneto Banca. After the ECB recognized the two banks as “failing or likely to fail”, the Single Resolution Board stated – under the EU Banking Recovery and Resolution Directive – that the crisis had to be dealt with according to national insolvency rules, since a resolution was not applicable. Consequently, the Italian Government started a liquidation procedure assisted by public resources combined with the sale of some assets and liabilities of the two banks to Intesa Sanpaolo. The Government, after having shared the burden of the intervention with shareholders and junior bondholders, committed around 4.8 billion euros in cash and around 12 billion euros in guarantees for that purpose. As in previous cases, the procedure preserved the flow of credit to clients of the insolvent banks (families, businesses, craftsmen), and limited the impact on the social and business environments of one of the best performing regions in the Country.

Eventually, the precautionary recapitalization of Monte dei Paschi di Siena was approved at the beginning of July by the European Commission, as part of the restructuring plan 2017- 2021, including the disposal of 28.6 billion euros of gross bad loans. The recapitalization was needed to put the bank in conditions to successfully face the adverse scenario of the stress tests that the ECB ran in 2016. The precautionary recapitalization includes 3.9 billion euros of direct capital injection and up to 1.5 billion euros of compensation in favor of retail subordinated bondholders, meeting certain conditions, whose bonds are mandatorily converted into equity.

By facing each case with a suitable solution, according to the specific nature and magnitude, both European and Italian rules could be implemented offering the best possible solutions. Improvements in the banking industry are a different matter altogether, they require a deeper and more thorough approach, to be pursued through structural reforms designed to reduce inefficiencies and address the issue of non-performing loans (NPLs).

The reform of large cooperative banks (the so-called “Popolari”), introduced as early as January 2015, aims at consolidating and bolstering the Italian banking system. Banks included in the cluster were forced to transform into joint stock companies, and as a result, two of them merged, creating the third largest group in Italy. The reform of smaller cooperative banks promotes consolidation in the industry, as well as the adoption of more efficient business models reducing the exposure to market risks. Finally, the self-reform of banking foundations is meant to put greater emphasis on the community-based initiatives of the foundations in place of interfering with the management of participated banks.

Alongside such structural reforms of the banking sector, the Government has adopted measures to encourage the creation of a market for non-performing loans, which helps to reduce the burden of those assets and restore an adequate flow of lending to the real economy.

These provisions include the institution of a guarantee on the Securitization of Bad Loans (GACS), which is a State guarantee on ABS’ senior tranches granted upon request by the banks. Changes to Italian insolvency rules and to foreclosures procedures also may help in creating a market for NPLs, as they improve the efficiency of insolvency proceedings and streamline the enforcements of creditors’ rights. The legislation now includes a series of measures to reduce lead-time for foreclosures such as: competition in pre-bankruptcy agreements with creditors; acceleration of sale transactions to ensure higher NPLs value; new rules for debt restructuring; easier access to credit for troubled companies; amendment of the regulations governing the deductibility of credit losses; and agreements secured by real estate assets, where parties may agree that transfer of the assets will become effective upon default by the borrower.

Even after facing a long recession, the Italian banking sector has proven to be sound and resilient. The stock of NPLs is shrinking at an increasing pace, while the origination rate of new exposure is approaching pre-crisis level. Those comprehensive interventions on specific banks and on the industry as a whole reduced and in some cases excluded major sources of risk. Overall, after years of adjustments, the Italian banking industry is returning to positive, effective and promising levels of performance.

Further reading:

The Narrow Path | Issue #2 | August 2017 | www.mef.gov.it | Italian Ministry of Economy and Finance


The middle-income plateau: trap or springboard?

Rauf Gönenç and Vincent Koen, OECD Economics Department

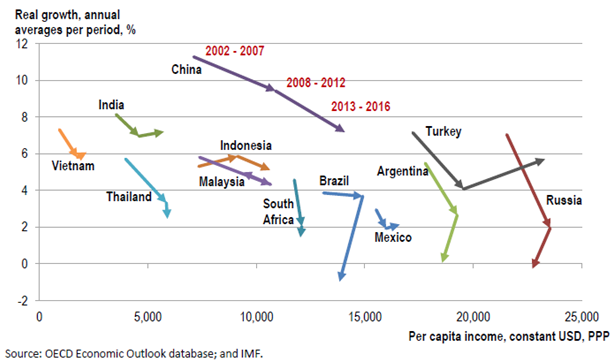
The overall slowdown and mixed growth performance of emerging market economies in the past 15 years (see chart) has revived angst about a so-called “middle-income trap”. While countries with lower incomes often do grow faster so as to close some of the gap with high income countries, they have done so at very different and uneven speeds.  Clearly, a durable and consistent strengthening of growth in these economies is key for global growth to return to higher long-term averages, as underlined in the latest OECD Interim Economic Outlook.

But how compelling is the notion of such a “middle-income” trap? A guided tour of the recent literature (Gönenç, forthcoming) shows that provided countries adopt the right policies, they are not doomed to get stranded mid-way but can and do converge with the most advanced economies.

Koengonenc

Indeed, a forensic investigation of the statistical evidence reveals that middle-income countries, defined according to GDP per capita or distance to the US benchmark, manage “escape velocity” to higher income levels more often than either poorer or richer countries do (Han and Wei, 2017). However, growth slowdowns are admittedly also more frequent in the middle-income group, which therefore displays greater dispersion in performance.

One reason is that the impact of economic policies on GDP growth is greater at middle than at lower and higher income levels, as shown in recent econometric analysis undertaken at the OECD (Égert, forthcoming).

Earlier long-term growth regressions have highlighted four areas that influence the speed of convergence, and where most middle-income countries have ample room for progress:

  1. Macroeconomic stability and openness, which are enhanced by trade and investment liberalisation, flexible exchange rates, sustainable public finances and strict financial sector supervision.
  2. Education, through the twin channels of workforce employability and productivity (Koen et al., 2013).
  3. Law and rule enforcement, which is hard to quantify but better captured in recent work (Guillemette et al., 2017).
  4. Financial development and diversification – from bank lending to various forms of equity funding, so that savings go to productive uses and entrepreneurs can more readily access funding (Cournède and Denk, 2015).

Even so, regressions leave much of the cross-country variation in growth unexplained. Growth remains a highly idiosyncratic process and may pick up when conditions – as captured by the indicators used in such regressions – look unfavourable, and vice versa (Levy and Rodrik, 2017). One reason may be related to how entrepreneurship flourishes, or is hindered, an area where experience varies considerably across countries and time for myriad reasons.

Many of the relevant factors were recognised already in the early 1960s by Rostow (1960) and others when they advised international organisations and the Kennedy administration on how to promote economic take-off in the developing world, calling for a shift in focus from individual infrastructure projects to more systemic changes in economic incentives and institutions. The latest econometric evidence supports their underlying insight that pushing ahead with reforms on a broad front should enable these economies to catch up over time with the more advanced ones.

Further reading 

 Cournède, B. and O. Denk (2015), “Finance and growth in OECD and G-20 countries”, OECD Economics Department Working Papers, No. 1223.

Égert, B. (forthcoming), “Quantification of structural reforms: Extending the framework to emerging market economies”, OECD Economics Department Working Papers.

Gönenç, R. (forthcoming), “The middle-income plateau: trap or springboard?”, OECD Economics Department Working Papers.

Guillemette, Y. et al. (2017), “A revised approach to productivity convergence in long-term scenarios”, OECD Economics Department Working Paper, No. 1385.

Han, X. and S. Wei (2017), “Re-examining the Middle Income trap hypothesis (MITH): What to reject and what to revive?”, Journal of International Money and Finance, Vol 73.

Koen, V., R. Herd and S. Hill (2013), “China’s March to Prosperity: Reforms to Avoid the Middle-income Trap”, OECD Economics Department Working Papers, No. 1093.

Levy, S. and D. Rodrik (2017), “The Mexican paradox”, Project Syndicate, 10 August.

Rostow, W. (1960), The Stages of Economic Growth, Cambridge University Press.


Four Challenges of Inclusive Growth from the OECD’s chief economist

by Catherine L. Mann, Chief Economist and Head of the Economics Department, OECD

  1. The challenge of measuring inclusiveness. A standard metric for measuring inequality is the Gini coefficient, which measures income distribution within an economy. But there are many other measures, such as distribution of income deciles, distribution of wealth, distributions of these by regions or by gender.  These are all static measures, even if they change over time. On the other hand, the persistence of earnings across generations, e.g. income mobility, explicitly is a dynamic intergenerational measure.  Which measure is best? Particularly as they deliver different rankings across countries.  For example, the Canadian Gini is persistently higher than the French Gini.  But, the metric of earnings persistence is much lower in Canada than than in France.  Which country is more inclusive? For more metrics, see OECD:  Measures of inequality, immobility


  1. Getting below the averages. Recent OECD research has found a wide gap in both productivity and wages between firms in each sector that are at the productivity frontier (in the top 5 percent, in productivity), where labour productivity has advanced some 35 percent since 2000,  and the rest of firms in the economy, where labor productivity has increased less than 5 percent over the same period.  The widening wage gap is reflected in the widening distribution of income across deciles where, among OECD countries,  the real household disposable income of the bottom 10 percent remains some seven percent below the peak in 2007, the mean income is only on par, yet the top 10 percent has edged higher.   Closing both the productivity and income gaps is a key element of inclusive growth.  While the specifics of the policies to close these gaps differ by country, there are elements in the policy domains of business dynamics and competition, labour market functioning and skills, and financial market structure and performance.  These policies,  if deployed in packages, tend to work synergistically rather than present tradeoffs to achieve inclusive growth.  For more on this topic, see the OECD:  Global Forum on Productivity


  1. Getting finance right. OECD research shows that specific kinds of finance can undermine inclusive growth.  Specifically, excessive mortgage debt increases the likelihood of a financial crisis, with deleterious outcomes for growth, and for equity, since those at the bottom of the income distribution are more likely to be at higher risk and higher exposure to this kind of debt and therefore to consequences of crisis.  On the other hand, deeper equity markets contribute to growth; although, to the extent that equity wealth is unequally distributed, deeper equity markets favour the wealthier.  OECD research also finds that otherwise identical workers, regardless of their income decile, are paid a wage premium if they work in finance. One reason is that too-big-to-fail rents are distributed partly to workers.  For more on this topic, see OECD:  Finance,growth, and inequality


  1. Globalization, technology, ‘tastes’ and regional impact on manufacturing jobs. How is the interplay of these factors relevant for inclusive growth?  A decomposition of manufacturing job loss finds that changes in technology and ’tastes’ (that is, consumer preferences for services vs. goods) dominate the direct force of trade flows in the loss of manufacturing jobs.  However, to the extent that manufacturing is regionally concentrated, the three factors together accentuate and concentrate jobs losses in those regions.  Not surprisingly, countries with higher regional concentration of manufacturing  jobs have tended to have experienced higher overall inequality. The policy approach to ameliorate this concentrated impact so that all can enjoy the benefits of globalization and technological change remains a critical task.  For more on this topic, see OECD:  Chapter 2 of the June Economic Outlook

This post also appears on the C.D. Howe Institute site


Short-term momentum: Will it be sustained?

By Catherine L. Mann, OECD Chief Economist and Head of Economics Department

Global growth is projected to increase to around 3.5% in 2017 and 3.7% in 2018 from 3% in 2016 in our latest Interim Economic Outlook. The forecast has slightly improved since the OECD June 2017 Economic Outlook, with the upturn becoming more synchronised across the world. Activity has picked up more than anticipated in the first half of the year in some of the largest economies – the euro area, Japan, China. Short-term momentum is reflected in a rebound in industrial production, consumer spending and investment since the second half of 2016, while trade growth has recovered from the slump in late 2015 and early 2016. Business and consumer confidence have strengthened. However, short-term momentum is no guarantee of medium-term sustainable growth. While the signs of recovery in business investment and trade are encouraging, they have not gathered sufficient pace to sustain healthy productivity growth. Wages have largely failed to pick up despite rising employment, limiting gains in household disposable incomes, especially for the bottom 10%.

IEOmomentumblo

Lifting medium-term global growth requires a durable strengthening of growth in emerging market economies – but GDP growth has slowed overall in these countries since the 2000s, and the ability of “catching up” economies to grow faster than advanced economies has been mixed. Deeper reform to enhance capital deepening and productivity gains will be needed to overcome the headwinds of rapid demographic developments in some countries, as well as a further moderation of growth in China.

Policy must not be complacent in the face of stronger short-term momentum. As the upturn has broadened, policy support for inclusive growth should be continued but further rebalanced from monetary policy towards fiscal and structural initiatives, while managing risks.

Monetary policymakers face a delicate balancing challenge. Monetary support remains necessary to ensure that the recovery is sustained and that inflation increases towards its target levels. Yet as the long period of low interest rates has boosted asset price valuations and encouraged riskier asset exposures, financial stability vulnerabilities persist and create uncertainties.

On the fiscal side, policymakers need to deliver fiscal initiatives focused on inclusive and sustainable growth. Underlying primary balances in many OECD countries are expected to ease under current plans in 2017-18, reflecting use of fiscal space – including through savings realised on government borrowing costs. Governments should ensure that fiscal easing is delivered, while making a better use of the mix of tax and spending policies. Priority should be given to public spending that yields the highest benefits for growth, inclusiveness and long-run supply. Education, hard and soft infrastructure, family benefits and health investments are the types of quality public spending that should be prioritised according to specific conditions in each country.

Stronger structural reform ambition should aim to address the missing engines of the current global upturn – private investment, trade, and productivity gains. More can be done to ease barriers to product-market entry and competition, both domestically and through a renewed commitment to trade and foreign direct investment openness. Improved competition would help revive the stalled diffusion of innovation between frontier firms and the rest of the economy, and address the growing productivity and wage dispersion. In many countries, there is significant scope to reform insolvency regimes, thus redirecting resources trapped in “zombie” firms towards productive investment.

Coherent packages of structural reforms can enhance their overall effectiveness. Reforms to reduce barriers to product market competition, trade and investment should be accompanied by labour-market measures to help vulnerable workers transition to new jobs. Integrated policy packages would help reap the benefits from innovation and globalisation while dealing with the job losses that are concentrated in specific industries or regions.

This period of short-term momentum in the global economy, along with the fiscal room created by the current monetary environment, gives policymakers space to address the structural impediments that hold back productivity growth and leave citizens behind. Sustained and inclusive growth depends on policymakers following through to meet the expectations of their citizens.

References

OECD Interim Economic Outlook, September 2017.


As Estonian exporters lead the way, policy needs to adapt

by Zuzana Smidova, Estonia Desk, OECD Economics Department

International trade plays an important role in the Estonian economy (Figure 1). Around a half of the private sector employment is sustained by foreign demand, twice as much as the OECD average. By another measure, over 40% of the value added created in the economy is linked directly or indirectly to exports, largely in the services sector. Yet, value added per worker produced in Estonia and consumed abroad remains low, even if comparable to its EU peers.

Estonia Suzana blog

International trade and foreign direct investment can serve as a ladder for climbing up the value added chain as they are major channels of technology diffusion and productivity growth. Exporters display higher productivity and innovation than companies oriented on the domestic market, and this is true in Estonia too, as new research shows (Benkovski et al, 2017, forthcoming) (Figure 2). Exporters are faced with tough global competition and have to meet international standards.

Estonia Suzana2blog

To increase export potential and value-added drawn from trade, innovative capacity and transfer of knowledge from highly productive firms to the rest of the economy need to improve. For the moment, innovation of the typical Estonian firms is limited as spending on business R&D is low. In this vein, nurturing cooperation between the researchers and business is crucial, as highlighted in the new Economic Survey of Estonia (OECD, 2017). The new industrial policy green paper, initiated by the business community and focused on digitalisation of traditional industries is welcome. It has the potential to improve the productivity and innovation capacities of these sectors. Furthermore, policy efforts should concentrate on strengthening adult education and allowing for immigration of talents, since shortage of skilled labour is starting to show as a major obstacle for further business growth and investment. This can also help with improving the innovative capacities.

By giving access to a wider variety of goods and services at cheaper prices, international trade raises well-being and consumers’ purchasing power. It also means fast transmission of global shocks, requiring a robust social safety net and adjustment policies. To ensure that all benefit from opportunities created by globalisation, the Estonian policymakers should focus on two policy areas. Firstly, those who can work need to have the right skills and incentives to participate in the labour market. Secondly, those who are out of the labour market should be supported by an effective and adequate social safety net, conducive to upskilling and maintaining work incentives. This means for instance increasing the level of subsistence of benefits and relaxing eligibility conditions for unemployment benefits, not least to improve participation in active labour market measures.

References:

Beņkovskis, K.,Masso, J., Tkasevs, O., Vahter, P., Yashiro, N. (2017), “Export and productivity in Global Value Chain: Evidences from Latvian and Estonian firms” OECD Economics Department Working Paper, OECD Publishing, Paris, forthcoming

OECD (2017), OECD Economic Surveys: Estonia 2017, OECD Publishing.


Slovakia…it’s time to invest in the future

by Gabriel Machlica, Slovak Republic Desk, OECD Economics Department

The Slovak Republic continues to exhibit robust economic performance. International competitiveness is strong, fiscal and financial policies are prudent, poverty and income inequality are low, and the country’s environmental footprint has improved markedly. Employment is rising, prices have been stable, and the external account is near balance. However, there are persistent, substantial public-sector deficiencies, which weigh on the wellbeing of the population and can undermine the sustainability of the economic expansion. These are mostly visible in terms of education and health-care outcomes.

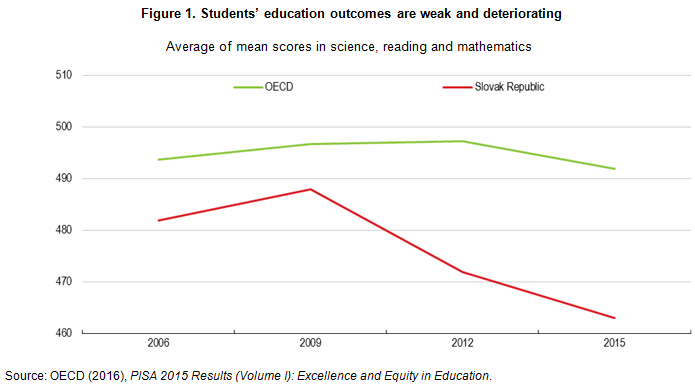
The Slovak education system is not properly preparing students for the labour market. PISA outcomes for 15 year-old Slovaks are weak in international comparison and have deteriorated over time (Figure 1). At the same time, secondary schools fail to overcome the differences in learning outcomes stemming from students’ socio-economic backgrounds. Almost one-third of 15 year-old Slovak students did not obtain even a basic level of proficiency in assessed subjects. This is worrying, as weaker students have limited access to employment and better paying jobs. Slovak tertiary education is among the weakest in the OECD. University research quality as measured by international rankings is low even in a regional comparison. As a result, an increasing number of students choose to study abroad to get a better education.

slovakia2017future

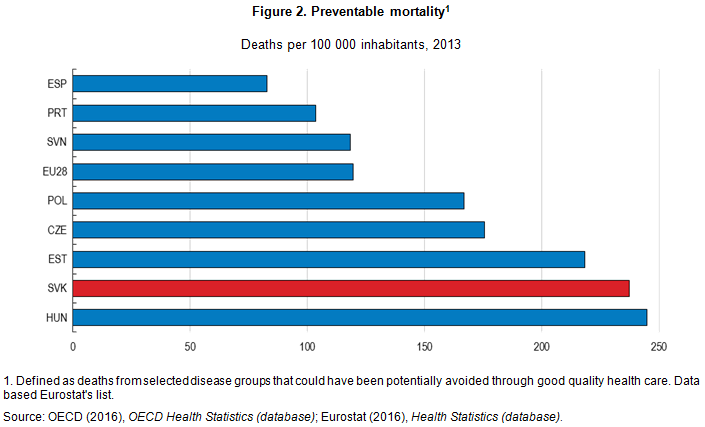
Regarding health-care outcomes, Slovakia ranks poorly in international comparisons. Life expectancy at birth is shorter than in countries with similar or lower living standards. Life expectancy at 65 and health-adjusted life expectancy are among the lowest in the OECD. Infant mortality is high and more people in Slovakia die of diseases that could have been prevented (Figure 2). Improving the health-care system could bring large gains in well-being. For example, improving it to the EU level could save about 5000  lives per year.

slovakia2017mortality

Over the last decade the Slovak economy has improved markedly in terms of macroeconomic fiscal and financial-stability outcomes. Nevertheless, it is important to undertake significant reform of the public services, especially education and health care, in order to spread the benefits of solid economic performance more equitably across Slovak society.

Further reading:

OECD (2017), OECD Economic Surveys: Slovak Republic 2017, OECD Publishing, Paris, http://dx.doi.org/10.1787/eco_surveys-svk-2017-en

Šiškovič, M. and M. Játi (2015), “Čo skutočne merajú medzinárodné rebríčky vysokých škôl”, Komentár 01/2015, Inštitút vzdelávacej politiky, Ministerstvo školstva, vedy, výskumu a športu SR.

U21 (2016), Ranking of National Higher Education Systems, Melbourne Institute of Applied Economic and Social Research, University of Melbourne.


Estonia: Using fiscal space for a more inclusive growth

By Pierre Beynet, Head of Division, OECD Economics Department

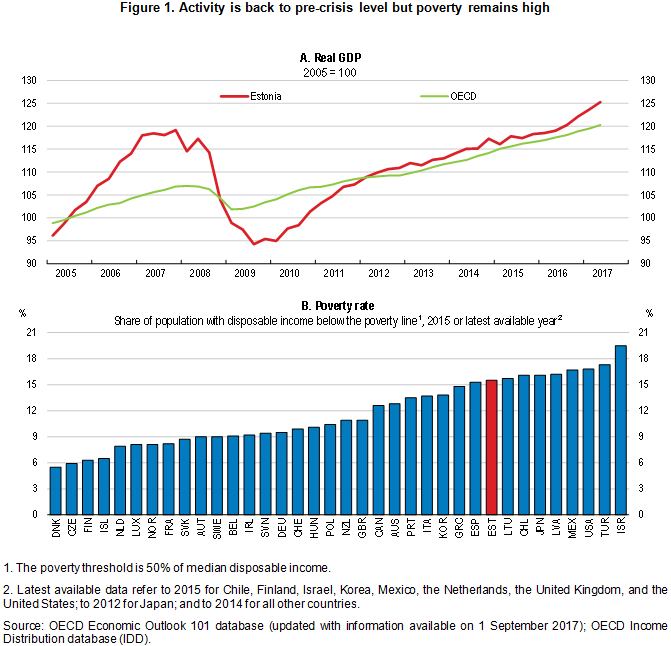
Estonian growth is picking up again strongly in 2017 and the level of activity has finally surpassed its pre-crisis level, almost 10 years after the outset of the financial crisis (Figure 1, panel A). However, poverty remains among the highest in the OECD (Figure 1, Panel B).

To make growth more inclusive, the 2017 OECD economic survey argues that Estonia should make its tax and benefits policies more redistributive, but also use more actively its large fiscal space by allowing a small fiscal deficit in the longer term (OECD, 2017).

Beynet estonia

Market income inequality is high (Figure 2, Panels A), but the redistributive effects of the Estonian tax and benefit system is low (Figure 2, Panel B). It leaves a considerable proportion of the population at risk of poverty, notably the unemployed, disabled and low-educated. The old-aged are also more at risk of poverty, in particular because of the relatively low level of pensions.

Beynet2esto

The government is already working on important redistributive measures. For instance, the planned increase in the personal income tax allowance, which is steeper at lower wage levels, will improve the progressivity to the tax system from 2018. However, the lowest income earners will not benefit from this measure since they are exempt from the personal income tax. Besides, the level of spending allocated to protection of the most vulnerable is low: around 31% of total public spending in 2014 went on social spending, some 9 percentage points less than the EU average. The targeting of social programmes is also poor, with means-tested measures accounting for a low share in total social spending.

Fiscal room is available for further measures to make growth more inclusive. Estonia has the lowest gross public debt relative to GDP in the OECD (Maastricht debt is at around 10%) and a structural budget surplus since 2009. Fiscal policy has been tight over past years, despite economic slack. The government plans a small structural deficit in 2018, 2019 and 2020, which is welcome, but the current fiscal rule imposes a return to a balanced budget in structural terms from 2021.

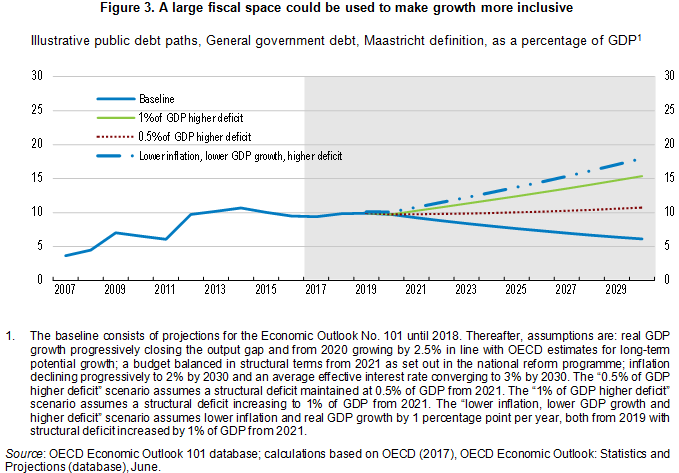
Beyond 2020, financing growth-enhancing measures could require revising the fiscal rule. Maintaining a small structural deficit for an extended period would not undermine the long-term sustainability of public finances. For instance, a persistent deficit of 0.5% of GDP would result in Maastricht debt reaching less than 11% of GDP in 2030 (Figure 3). In the same vein, increasing the deficit by 1% of GDP would still maintain a prudent debt level, even if coupled with 1 percentage point lower inflation and GDP growth (Figure 3).

Beynt3esto

References

OECD (2017), OECD Economic Survey of Estonia, OECD Publishing, Paris.